Musicbed
Filmsupply
Stills
Contact Us(800) 805-6802
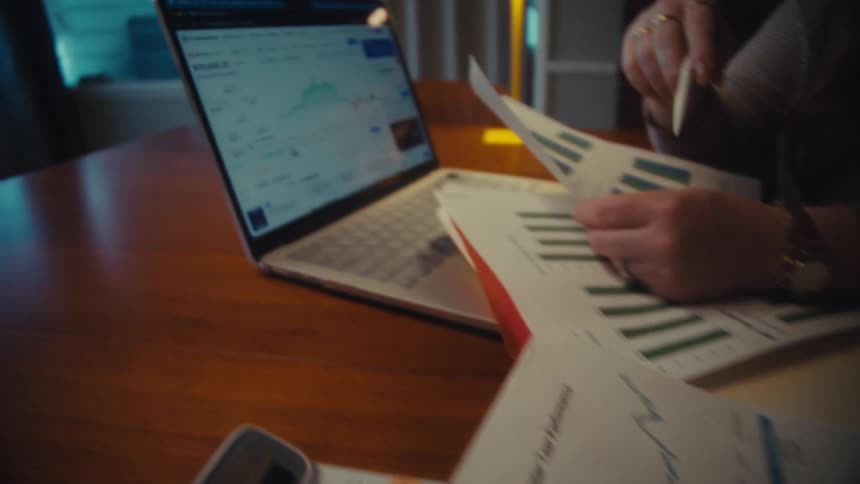
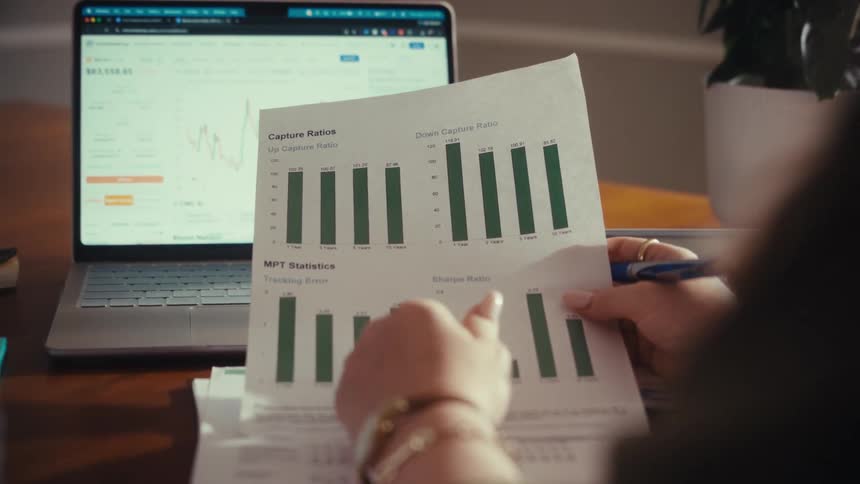
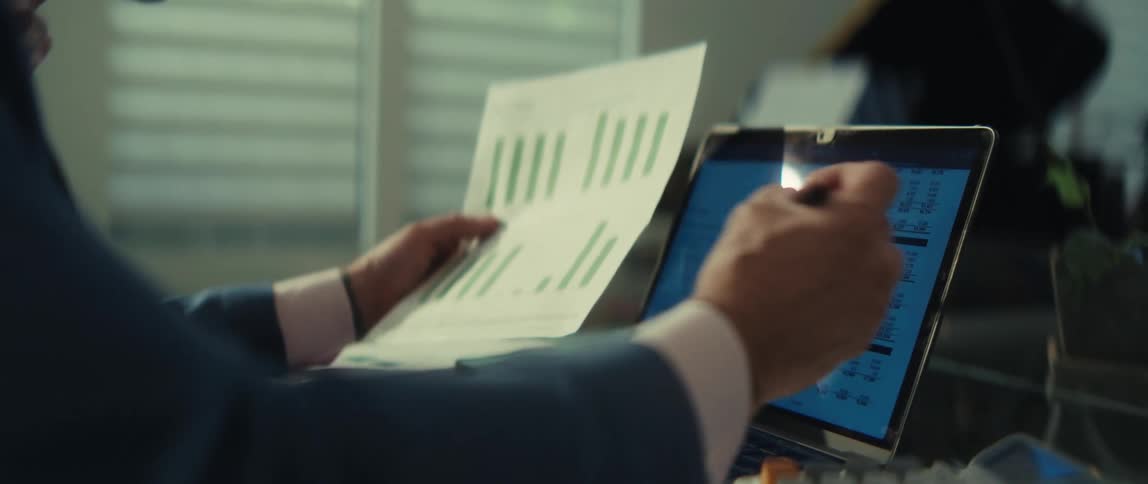
Two business partners analyze financial data, comparing portfolio growth charts on paper with live market trends on a laptop
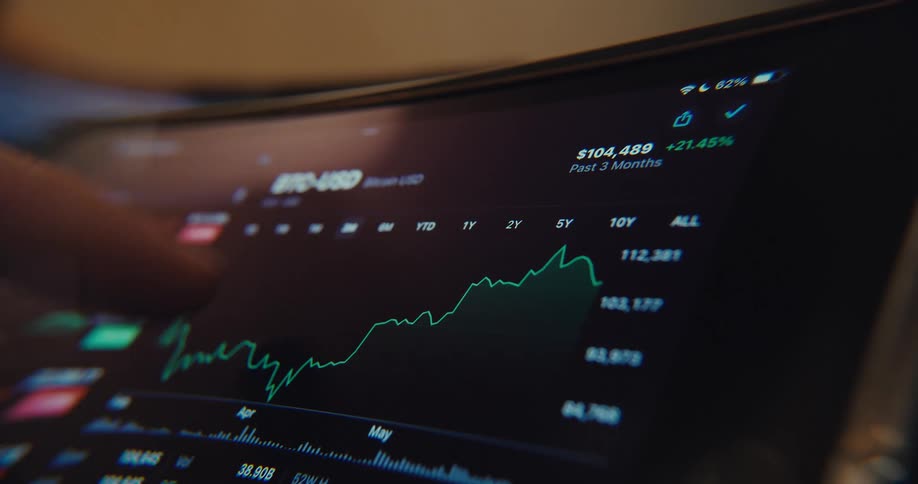
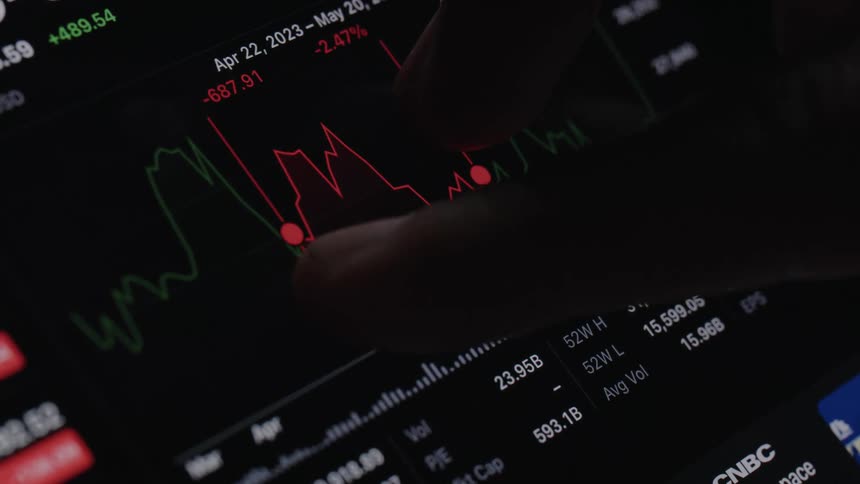
A finger points at a tablet screen displaying a fluctuating stock market graph
Candlestick chart against a gray background
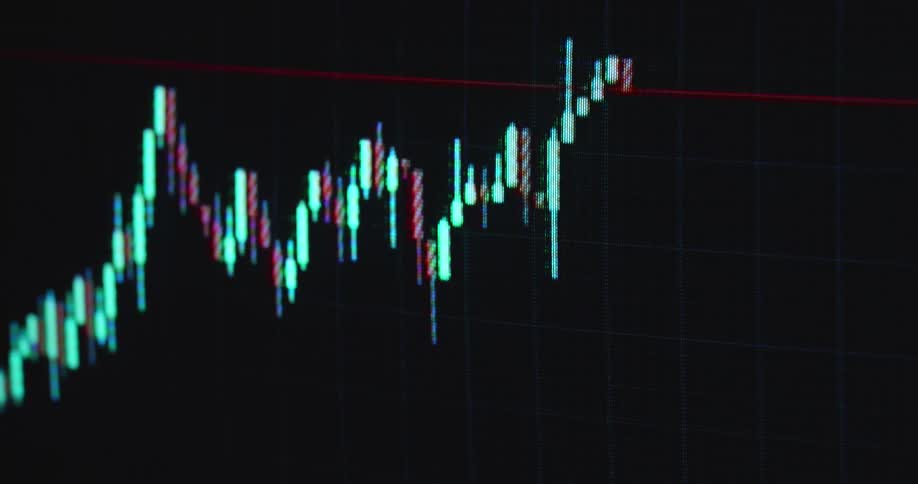
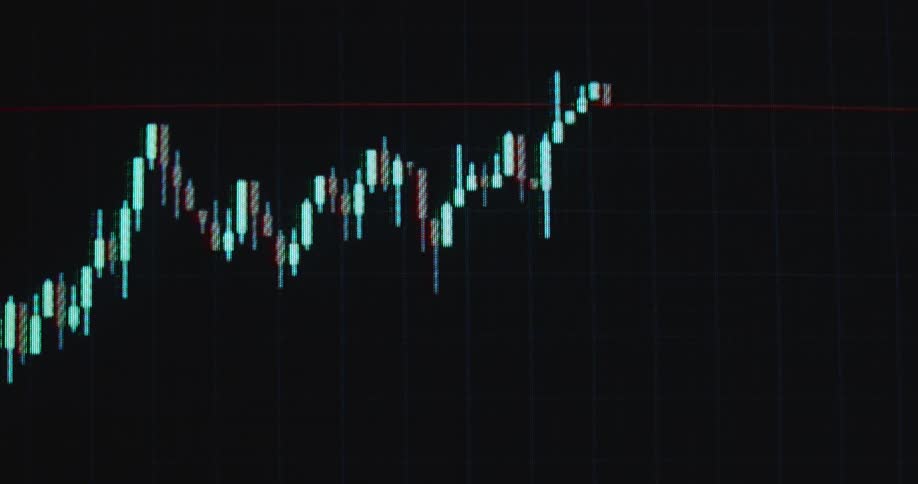
Pixelated candlestick chart on a screen or monitor panel forming a bullish flag pattern while the trading chart analysis shows that the graph is about to break resistance to the upside making the price of the stock or asset go up and increase in value
Financial candlestick chart on a screen indoors
Close up view of a person looking at stocks
Stack of golden coins with the bitcoin logo printed on them in front of a screen showing a financial graph
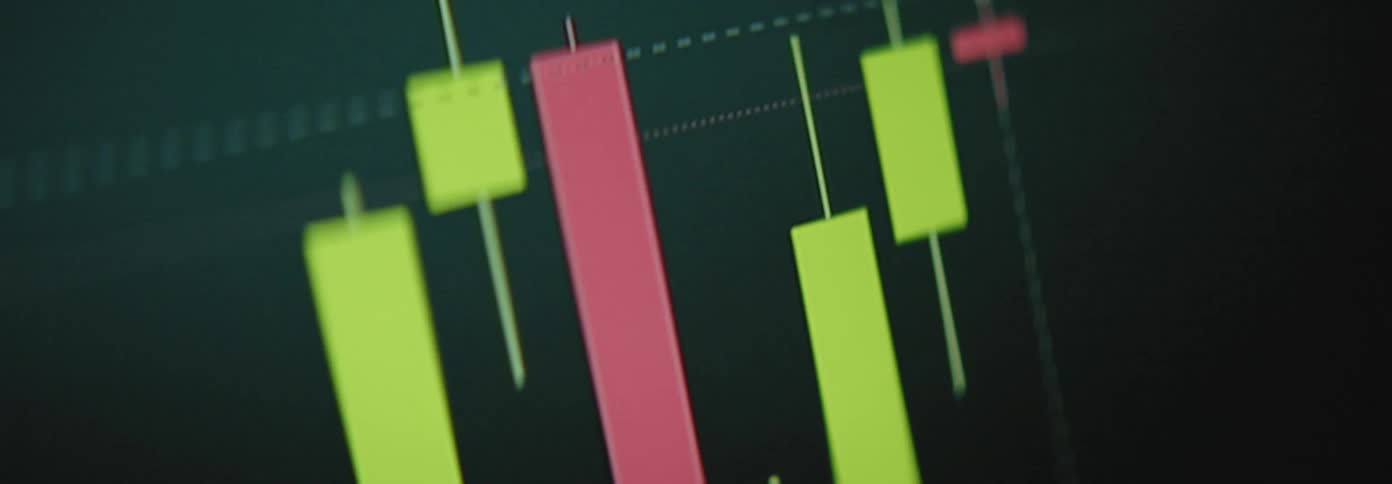
Red and green candlestick chart on a pixelated screen with RGB pixels as the bearish graph breaks resistance to the downside and the market or asset value collapses causing massive losses and volatility due to an unexpected crash
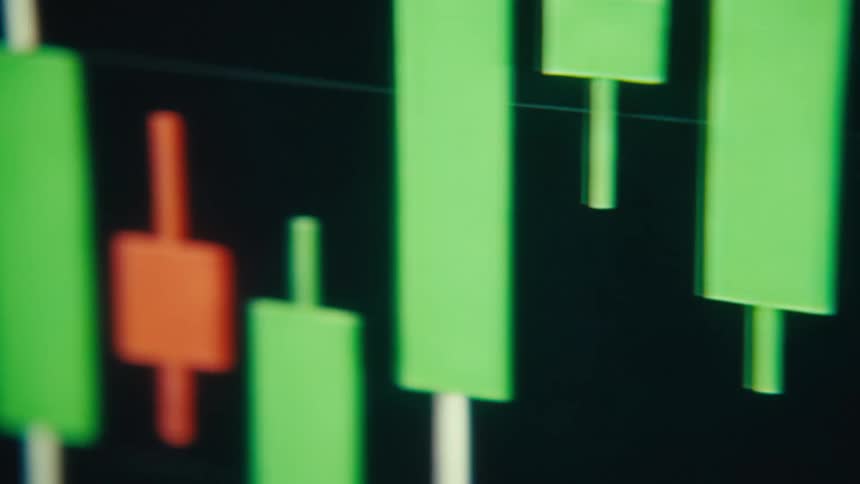
A close-up of a live stock market candlestick chart displays fluctuating financial data on a digital screen
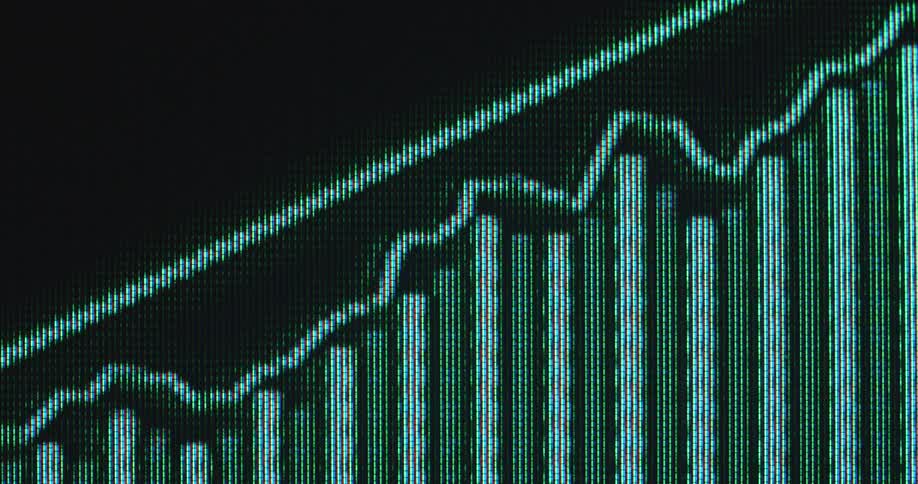
Pixelated screen of a vintage 90s computer displaying a green graph with an arrow pointing upwards symbolizing the beginning of the digital financial era and the first online trading platforms for buying stocks in the internet
A line graph is displayed on a monitor on the side of a building
Water flowing over gold coins
The line graph goes up and down on the monitor
Informational graphs cover the computer screen
Retro computer monitor or screen displaying a neon green growing graph of a vintage broker or trading software enabling users to buy and sell stocks online in order to make profit and earn money and invest for their future
Person typing on a macbook
A close-up of two people analyzing a financial report with bar graphs detailing return and risk
Swiping on the smartphone
The line graph is moving on the screen
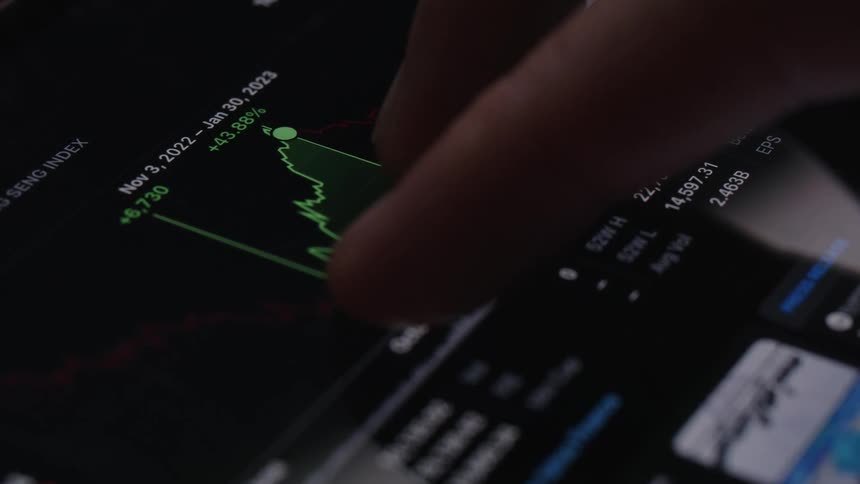
A finger moves a dot along a graph
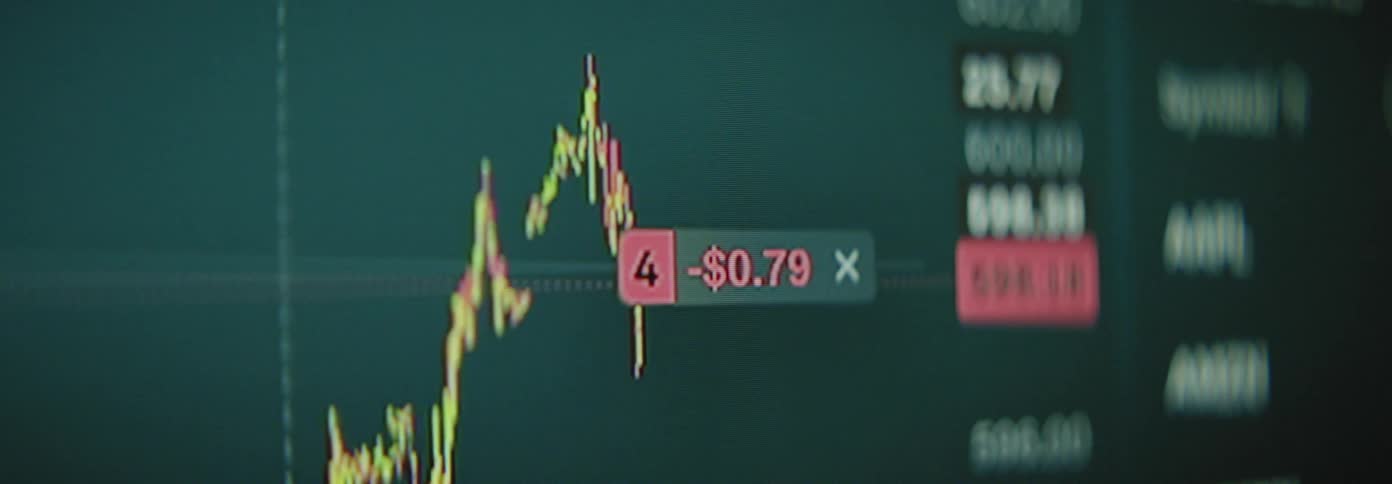
Handheld macro shot with dynamic camera movement of stock or crypto currency trading candlestick chart going up before crashing due to unexpected black swan event causing recession and economic depression on screen with grid and red candles
Close up of the changing numbers on the indicators of a trading website on a screen inside a dark room
An over-the-shoulder view of a woman analyzing financial performance data on a printed chart with a laptop showing stock market graphs in the background
Water rippling over coins in a river
Extreme macro close up of green and red candles with long wicks of user interface of trading application show the price of a stock or crypto currency going down with a negative trend symbolizing volatility and price action or movement
Water droplets are moving across gold bitcoins in water
A closeup shot shows a computer screen displaying a volatile financial graph with jagged lines fluctuating up and down in a rapid unpredictable pattern the camera pans along the digital chart showcasing the dynamic and complex movements of the data
Locked off macro shot with no camera movement of red and green candles creating candlestick chart of a bearish market pattern with drastic crash and recession with massive financial losses as the trading software is running on the computer
An animated bar graph shows exponential growth with an upward trending arrow
Stack of golden coins with the bitcoin logo printed on them
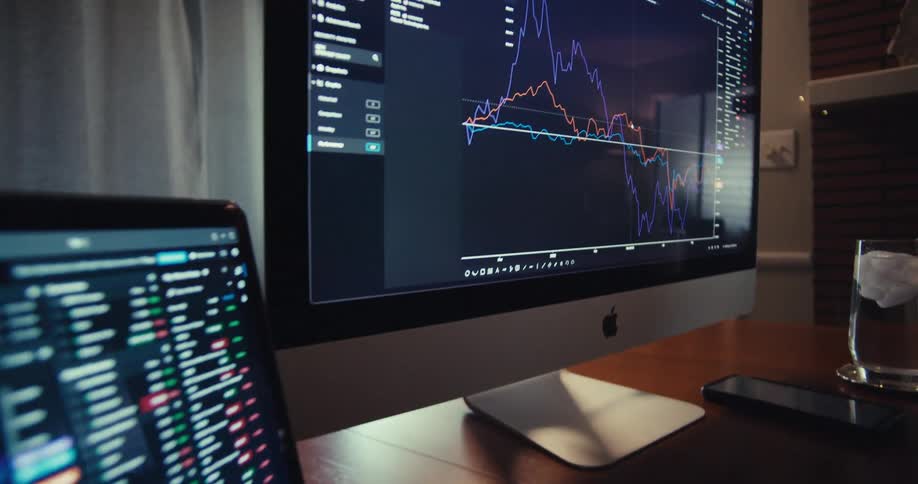
Cryptocurrency graphs on a laptop screen near a tablet scrolling up and down
Handheld macro shot with dynamic camera movement of a data graph animation that moves upwards on a CTR pixel screen with a positive trend or rising development as symbol for increasing prices caused by high inflation
Extreme macro close-up of a pixelated candle of candlestick trading chart changing between the colors green and red as symbol for volatility and uncertainty in the financial markets while the price of the stock or cryptocurrency rises and falls
Computers screens are full of information
A clip of a screen displaying a digital trading candlesticks
Closeup shots of computer and laptop screens showing realtime stock market fluctuations
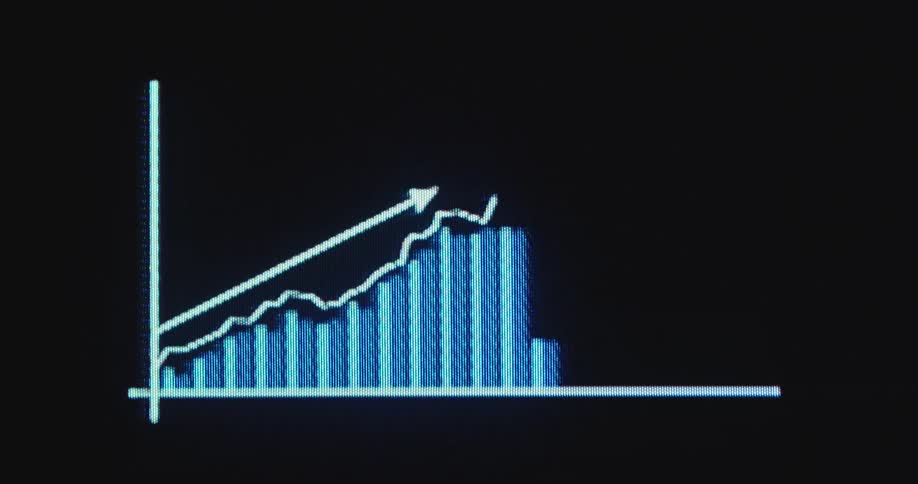
A blue and white graph or chart animation presents successful business data and a growing economy as the arrow moves upward with a positive price development due to healthy financial markets
A person touches the graph on the tablet
A closeup shot shows a digital financial chart with red and green candlestick graphs on a black background the camera pans slowly to the right showing the bars moving up and down to reflect market changes
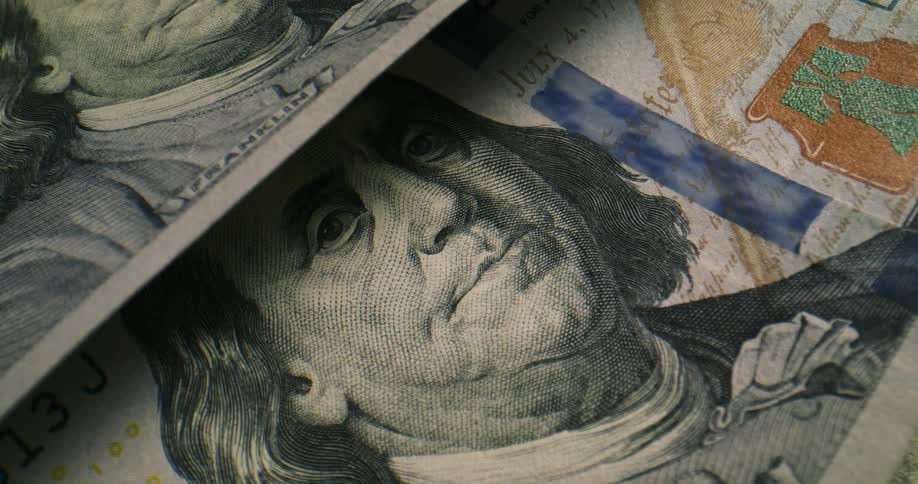
Money is stacked together
A financial analyst cross-references data from a printed report with a spreadsheet on his laptop while using a calculator
Information is listed all over the monitor
Person in a suit points with a pen at a printed chart on a sheet of paper
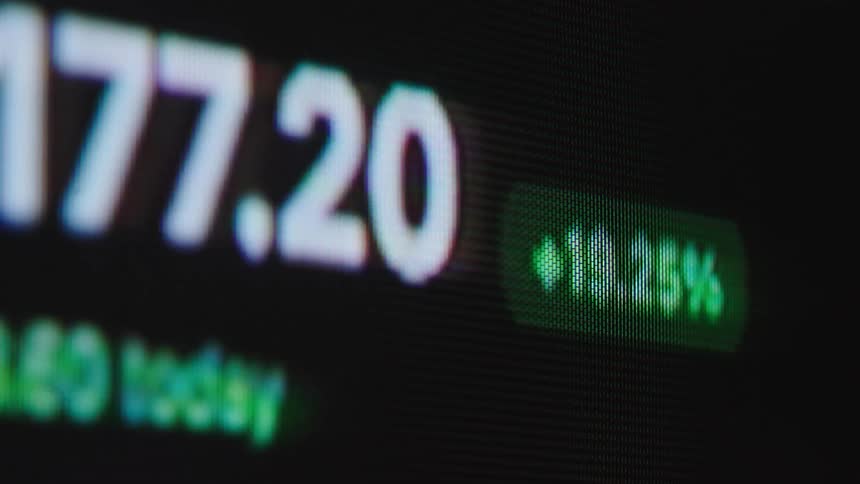
A macro shot of a volatile stock price rapidly increasing on a digital trading screen, showing a significant percentage gain
Candle chart in a digital system
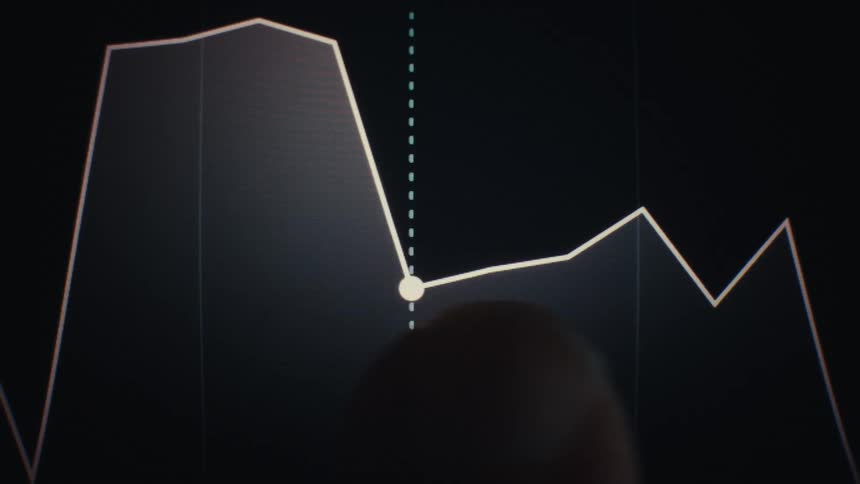
Finger points to a highlighted point on a line chart showing value variation
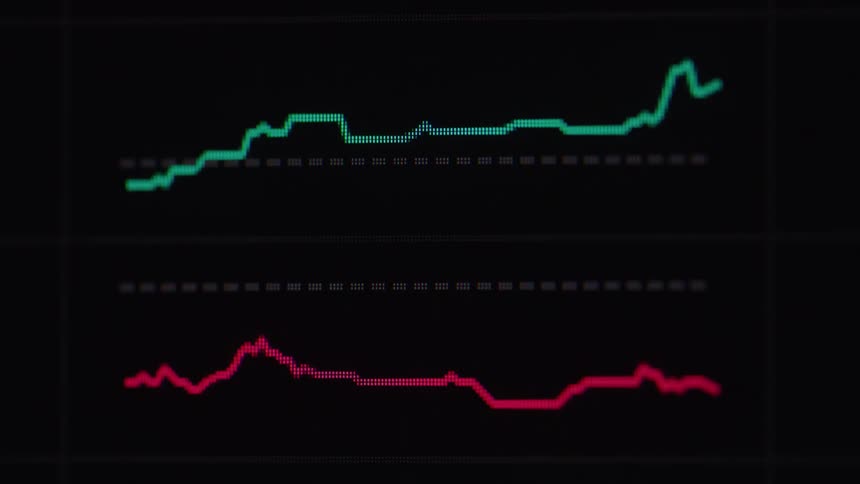
Multiple plots in blue and red are scrolled over against a black background
A stack of golden colored coins have the bitcoin cryptocurrency logo on them
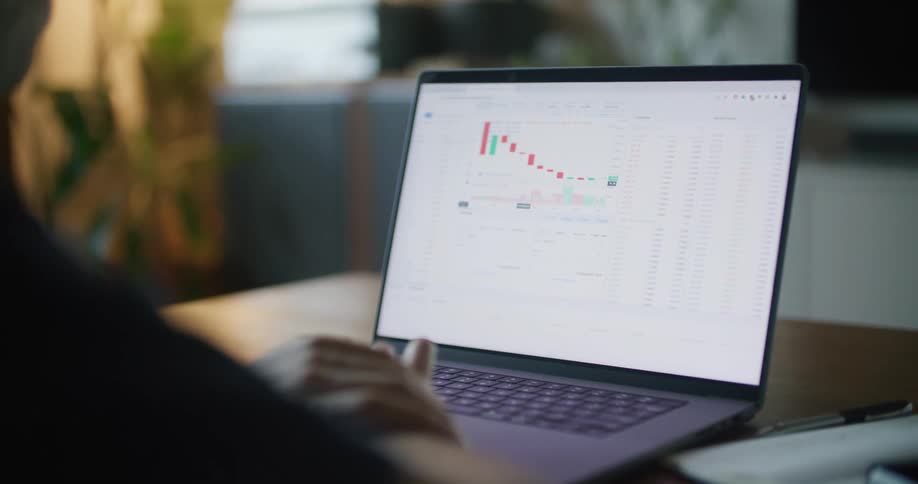
A man is sitting at a desk looking at a laptop computer with a graph on the screen
A green digital chart features a sharply rising arrow indicating a strong upward trend and increasing profit due to a great performance of stock or crypto trading portfolio via an online platform or exchange
George washington on quarter dollar coin
A closeup view of a stock market chart with red and green candlesticks fluctuating
A neon green retro monitor displays a chart showing the movement of a stock price with an arrow crashing with a dramatic downward or negative tendency or direction causing investors to lose money presented by data visualization
A gold bitcoin is standing on edge above moving water with water droplets on it
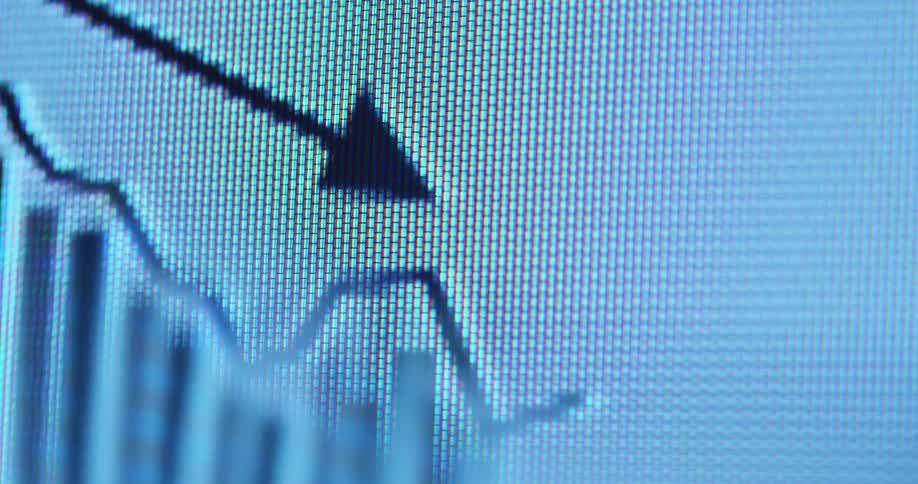
A macro view of a digital screen shows a black animated graph with a falling line chart and a downward pointing arrow overlaying vertical bar charts representing a market decline or financial loss on a white background
A close up view of financial data charts and graphs displayed on a screen with light distortions
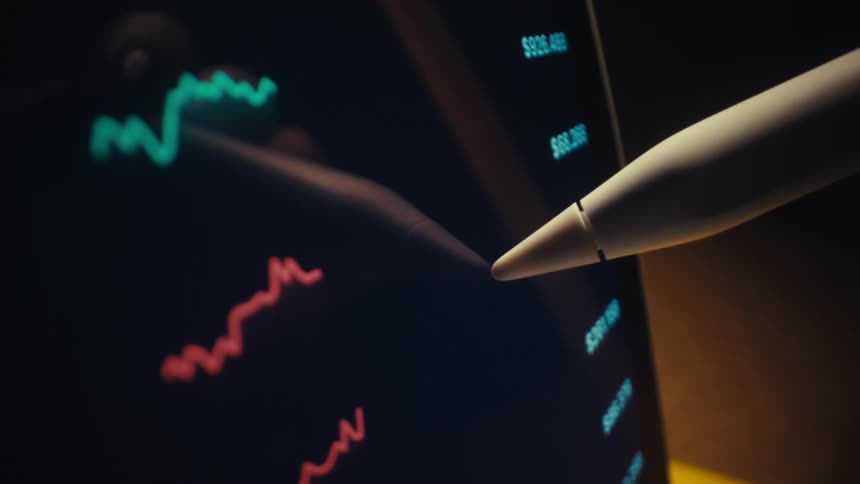
A stylus points at colorful fluctuating line graphs displayed on a digital screen suggesting data analysis or market tracking
Stacks of golden coins with the bitcoin logo printed on them
A persons arm touches a display showing stock prices then jots down something on a piece of paper
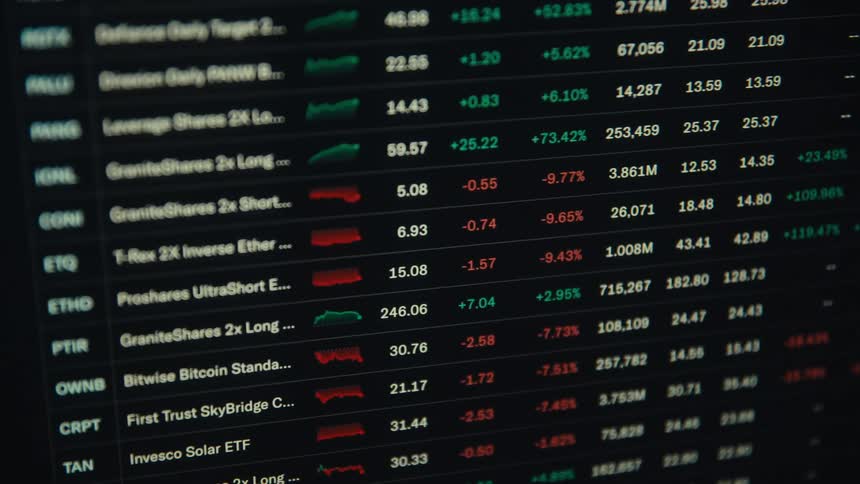
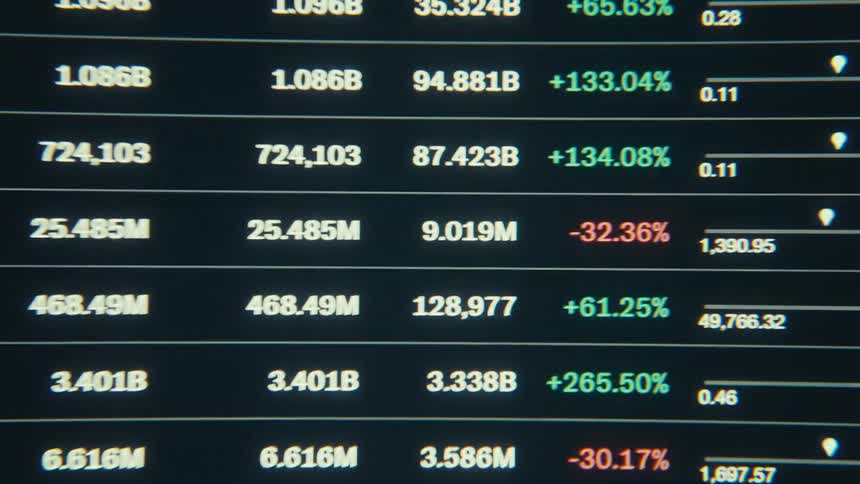
A shot shows a view of a screen with a list of companies and their financial data
The pile of cash is on fire
A close-up of a computer screen displaying a real-time candlestick chart for online stock, crypto, and forex trading
A pixelated smartphone or display device screen or monitor shows the user interface of a finance app or online broker and trading platform for buying and selling stocks and crypto currencies such as Bitcoin or ETH as the trading chart moves up

Need help finding the
right footage?

Have it delivered to your account within 1 business day.

This is Filmsupply

Our StoryOur FilmmakersArticlesFilmsPopular SearchesAll Categories

FM

A family of brands dedicated to empowering the creative.

FILMSUPPLY

Footage licensing for productions

MUSICBED

Music licensing for filmmakers

STILLS

Image licensing for creatives

© 2026 FM LLC.

Privacy PolicyLicense TermsTerms & ConditionsCareers