Musicbed
Filmsupply
Stills
Contact Us(800) 805-6802
Swiping on a phone to see different charts
A computer screen indoors displaying a stock market price chart with a green line as a persons finger moves across it
Coworkers highlight financial information and make calculations
Numbers and a line chart are on the computer monitor
A close view of professional documents featuring blue and green line graphs as well as circular data charts and financial statistics on white paper as the camera moves across the pages
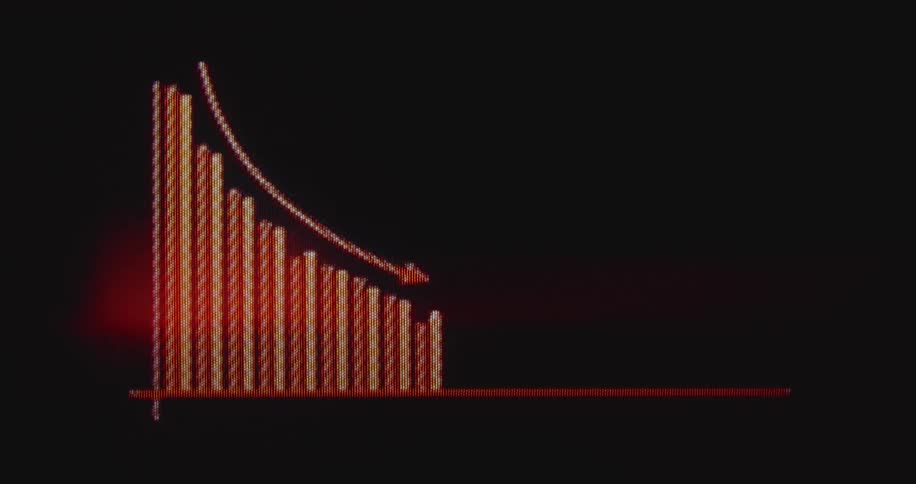
An extreme close-up, pixelated view of a red financial graph with a downward arrow indicating a stock market crash and economic decline
Man reading spreadsheets printed on paper
A screen shows a financial chart with lines and bars moving up and down
Chart of rising and falling candles against a blurred background
A finger scrolls through a stock market chart on a smartphone in a closeup shot
Line graph changes as the numbers in the data change on a digital screen
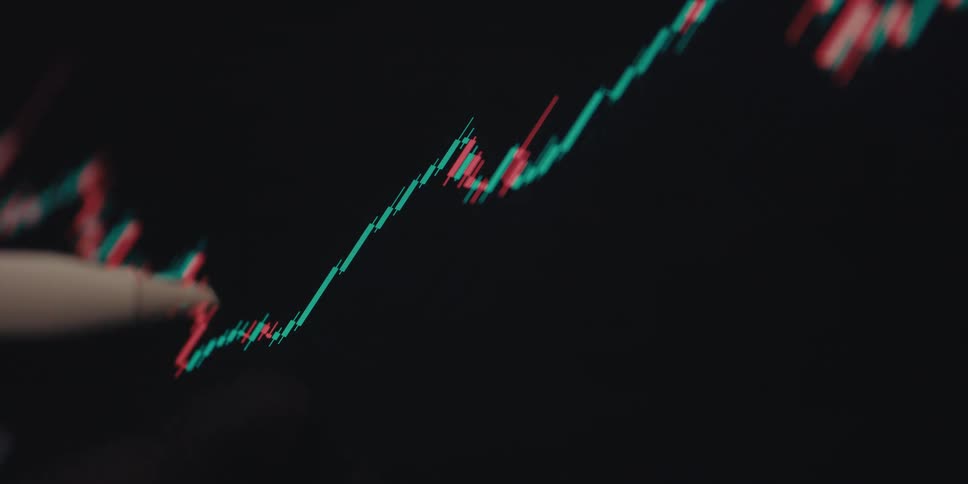
A stylus pen resting against a computer screen displaying a stock market chart with red and green lines
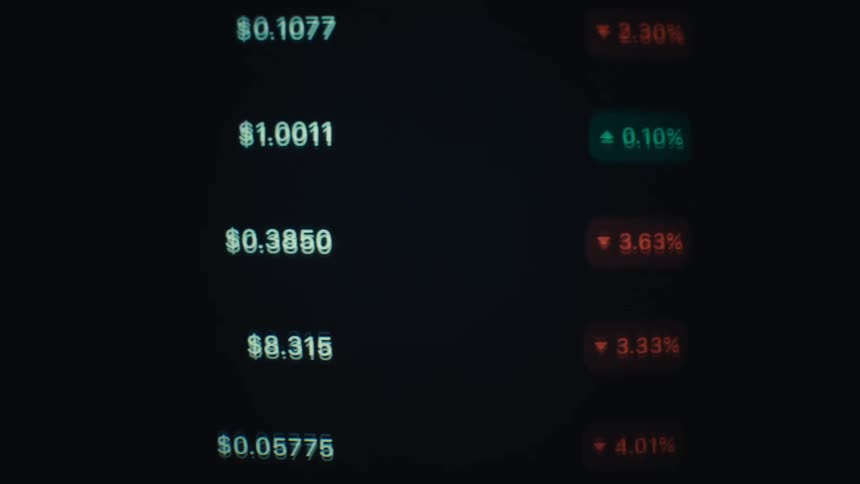
List of cryptocurrencies and dollar values displayed on a dark screen
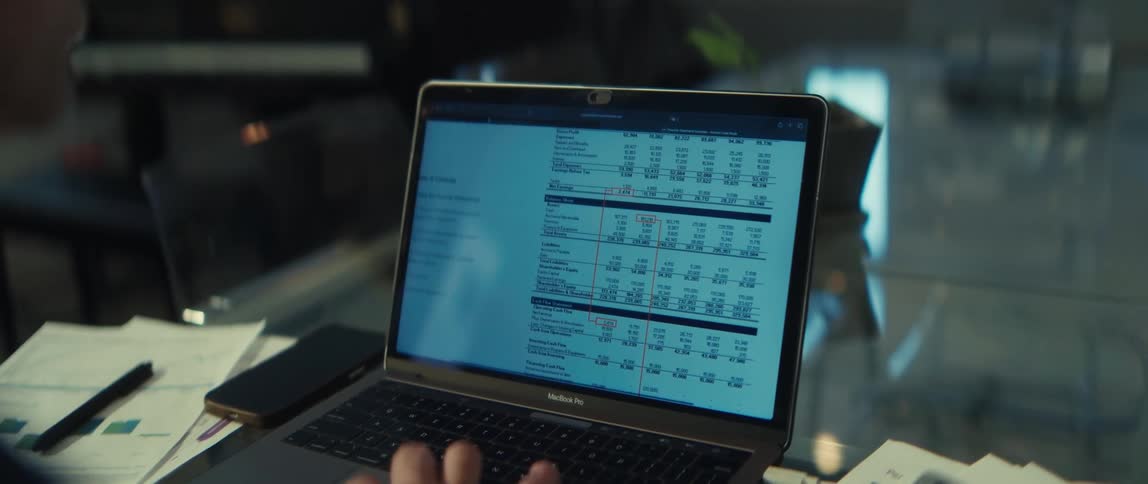
Over-the-shoulder view of a person analyzing a detailed financial spreadsheet on their laptop computer
Close up of man trading on a laptop and desktop computer in a room
Hand holds eyeglasses over printed reports with charts next to a tablet
Numerous gold colored coins with an upper case b on them sit in a puddle of water
A line graph is on the computer monitor
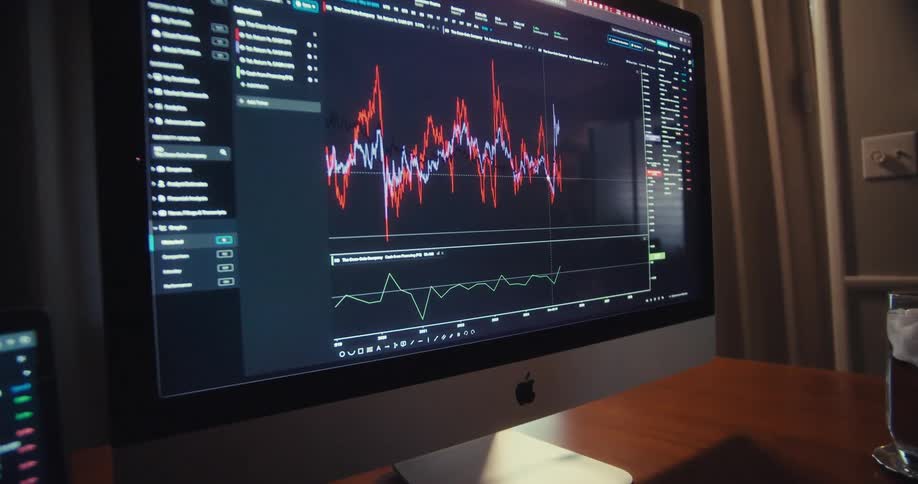
The monitor has a color coded line chart on display
The camera captures an extreme closeup of a screen as a graph of a share index traded at Wall Street or on an online stock exchange app is plotted while going up and down or falling or rising and changing between positive green and negative red
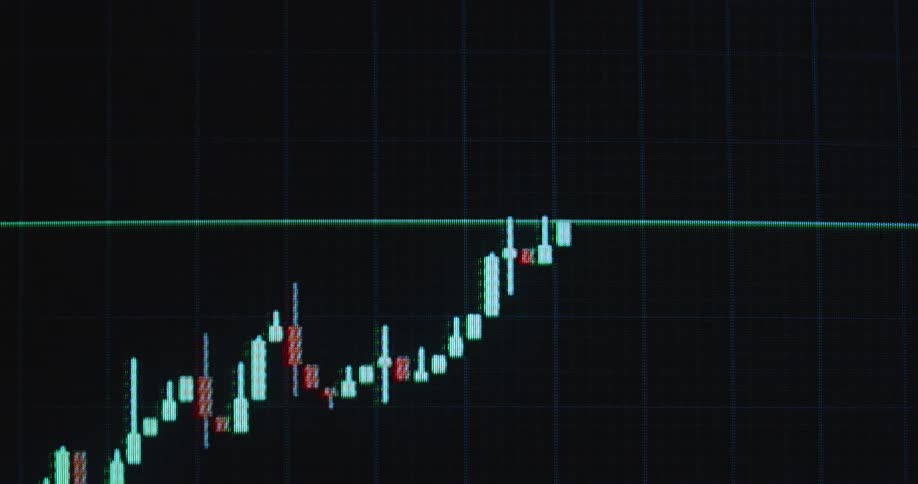
Tall green candlestick bars with thin white wicks rise against a dark background their sharp tops and bottoms hinting at sudden bullish spikes and shortterm volatility
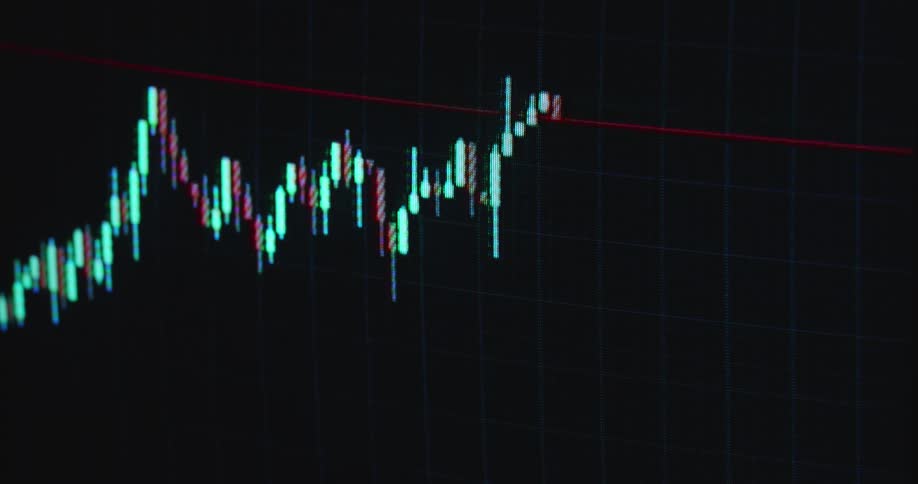
Bright neon green bars or candles of a candlestick chart pattern or financial graph on computer display screen with dark background and positive price development symbolizing successful stock trading with upward trend and handheld camera movement
Screen displaying the financial market chart in candles
A digital chart with a downward-pointing arrow slowly pans across a screen, symbolizing economic decline
A person is scrolling through stock prices on their phone
A shot shows a graph on a screen with data lines moving up and down
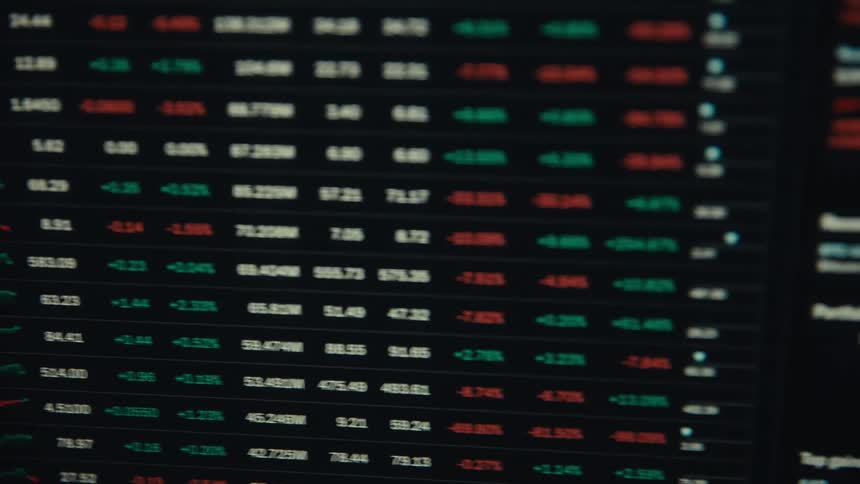
A dense slightly blurred market leaderboard of tickers and redgreen figures fills the screen
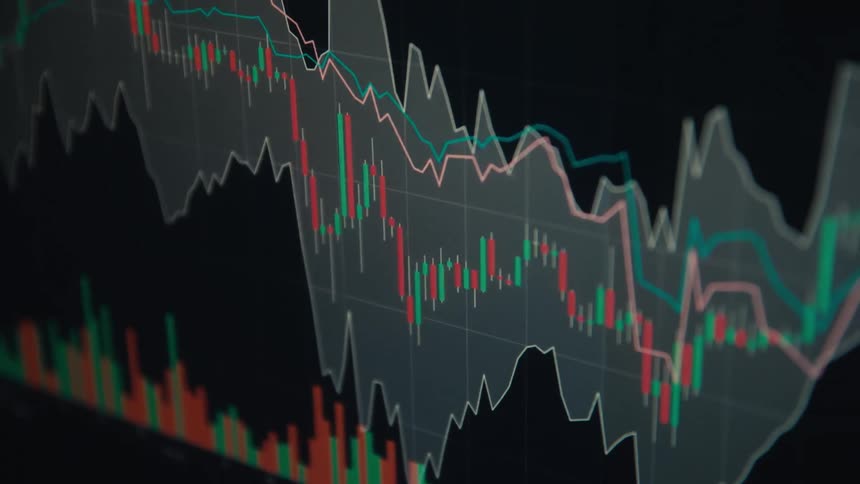
Candlestick and line charts display variations on a financial panel
A macro close-up of a digital stock market graph showing a bearish trend with a declining arrow indicating a financial crisis
A macro close-up of a digital screen shows an animated financial chart with a positive upward trend
The line chart on the computer has different shades of color
Rising blue candlestick chart against a black background of a pixelated computer screen displaying the user interface of an online trading platform or crypto currency exchange for trading bitcoin or other digital assets
Extreme close-up macro shot of a blue financial bar graph on a computer screen with a white arrow indicating a downward trend
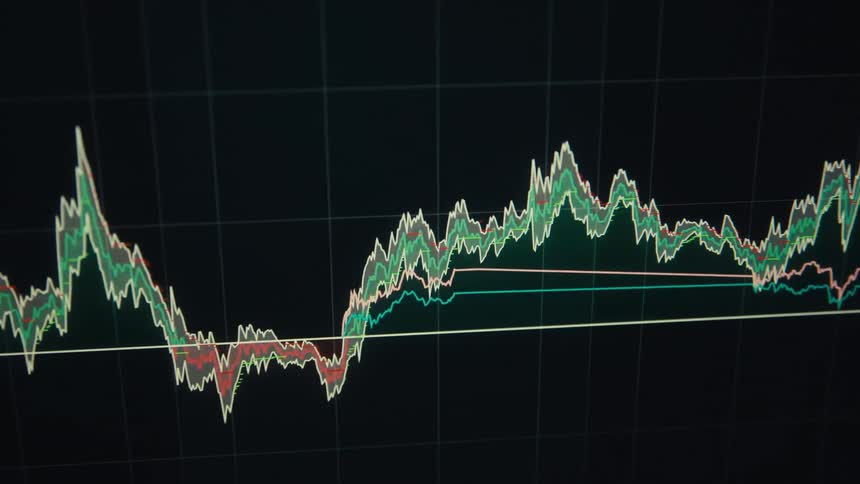
Market chart displaying shaded areas and colored lines representing financial fluctuations
Close up of the shiny engraved surface of golden bitcoin physical coins over a reflecting surface
An animated bar graph with a red arrow illustrates a declining trend, symbolizing financial loss or economic downturn
Stack of golden coins with the bitcoin logo printed on them in front of a screen showing a financial line graph
Macro view of a digital screen showing a white animated financial graph and arrow moving upwards on a black background
A macro shot of a blue bar graph on a computer screen with a white arrow indicating an upward trend of growth and success
A digital display shows multiple lines of data graphing price fluctuations over time
Screen displaying bearish financial market graph as candlestick chart crashes while stock and crypto currency markets decline and assets lose their value due to drastically decreasing and falling prices causing panic sales and recession with volatility
Candlestick chart of ETF or exchange-traded fund with steady growth and positive price performance over a long time span or years as the price of the asset steadily increases with an uptrend and successful value development symbolizing good investment
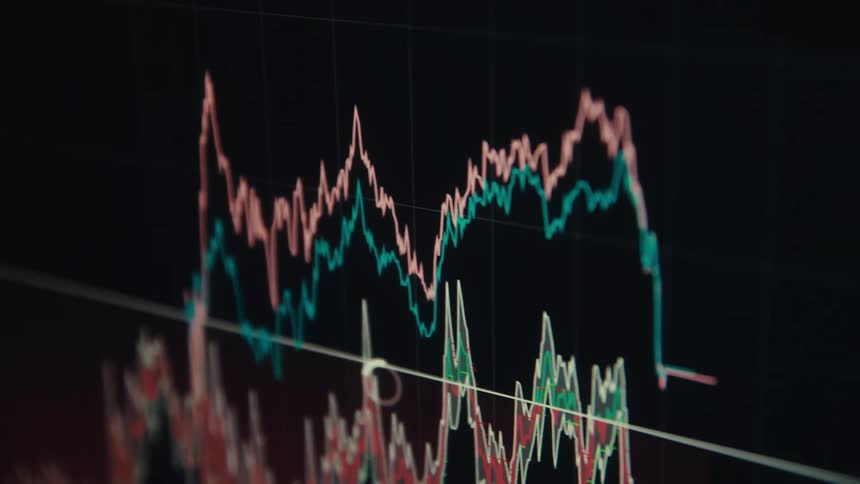
A dark video shows blue green and red stock market line graphs on a computer screen against a grid
A bullish candlestick chart pattern moves on the computer monitor with visible pixels as the bull flag breaks resistance to the upside causing massive surge and gain for investors and traders trading stocks and crypto currency coins or tokens online
A candlestick chart or trading graph animation showing a stock price or crypto currency rising over time with exponential growth and a positive trend or development on a dark computer screen with RGB pixels as symbol for a growing shares or bond market
Close-up macro of a financial bar graph on a digital screen with a white arrow pointing down, indicating a downward trend, recession, or stock market crash
The animated trading graph or candlestick chart is moving on the computer display as a recession hits the global finance markets and the prices crash as red candles symbolize the end of a market cycle and the beginning of a financial crisis or depression
A number of shiny coins with the bitcoin logo on them are piled on a wet surface
Handheld macro close-up of bullish financial market chart or candlestick trading graph on black screen displaying the UI of stock or crypto broker application or platform as the price surges and the value of the asset increases during investment bull run
Several wet golden coins with the bitcoin logo printed on them
A screen shows a financial chart with green and orange bars moving up and down
Water flows over the bitcoins
Retro Macintosh computer screen displaying financial market chart of an online trading platform or broker application for buying stocks or shares with bright neon green candles as the price goes up or increases with a positive trend
Red and neon green glowing candles create a bullish candlestick chart pattern with upward movement and positive price development as symbol for a healthy commodity or equity market or profitable stock or crypto trades via online broker app
Person working on a portable electronic device with a touch screen
Extreme closeup of a pixelated red chart with significant downward trend highlighted by descending line and arrow as the stock market or the global economy decline and the US dollar loses value due to negative price development
Red lasers flash on a screen behind a stack of gold coins
Close up of water running over the shiny engraved surface of golden bitcoin physical coins
Extreme macro shot of a digital bar chart with a downward-pointing arrow, symbolizing financial crisis, decline, and loss
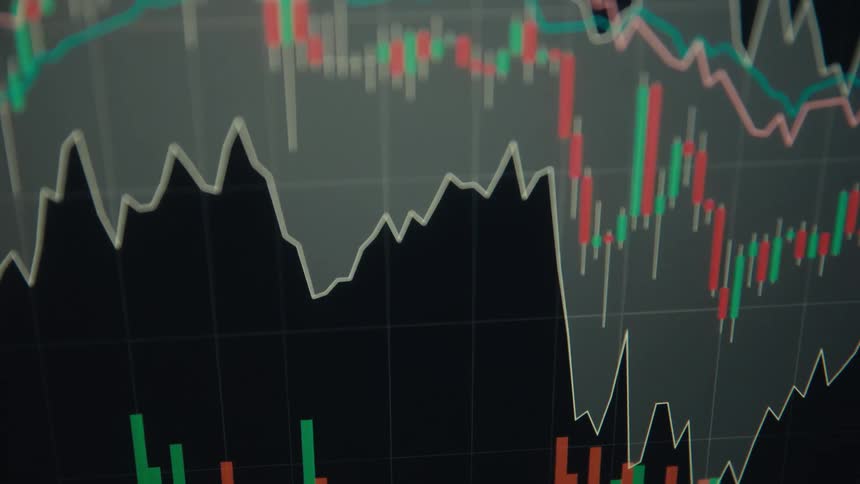
Candlestick chart of a stock market price displayed on a computer screen with green and red candles
A single shiny coin with the bitcoin logo on it stands atop a wet surface
A monitor displays a stock market candlestick chart with green and red candles moving across a dark grid

Need help finding the
right footage?

Have it delivered to your account within 1 business day.

This is Filmsupply

Our StoryOur FilmmakersArticlesFilmsPopular SearchesAll Categories

FM

A family of brands dedicated to empowering the creative.

FILMSUPPLY

Footage licensing for productions

MUSICBED

Music licensing for filmmakers

STILLS

Image licensing for creatives

© 2026 FM LLC.

Privacy PolicyLicense TermsTerms & ConditionsCareers