Musicbed
Filmsupply
Stills
Contact Us(800) 805-6802
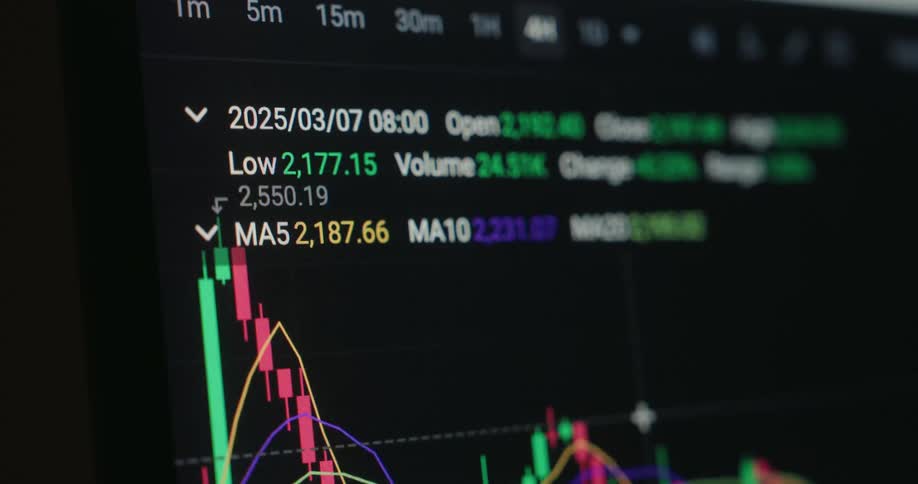
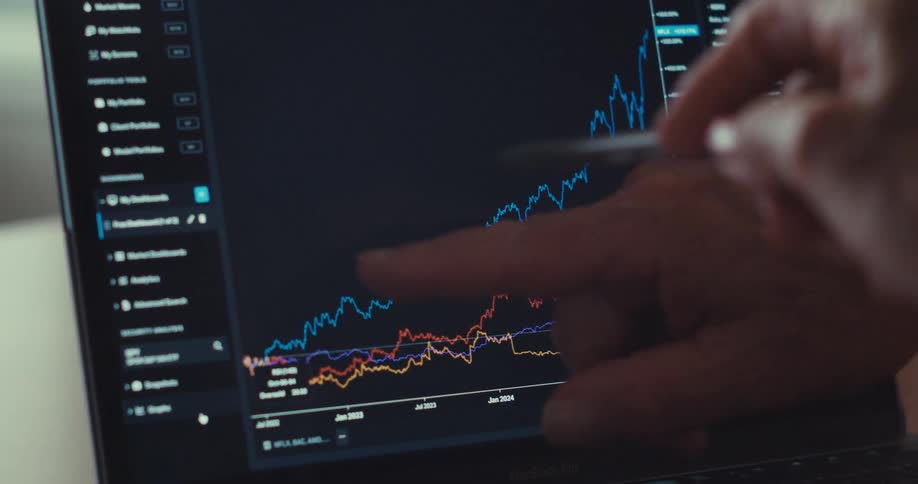
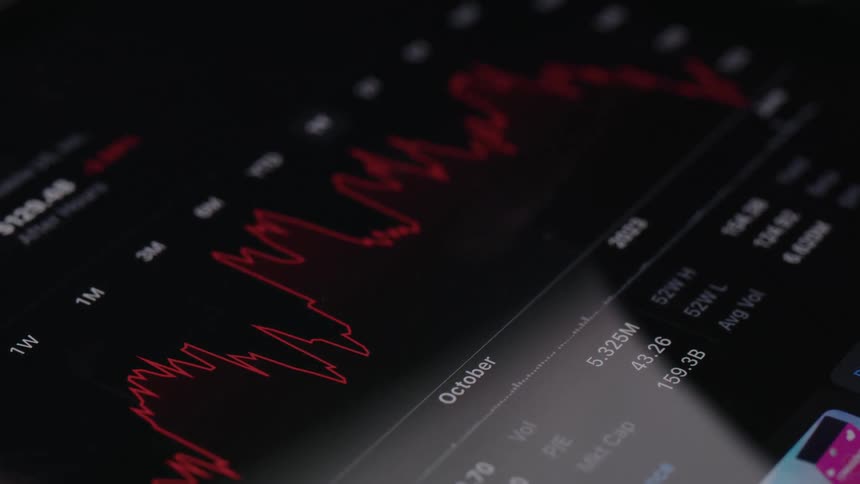
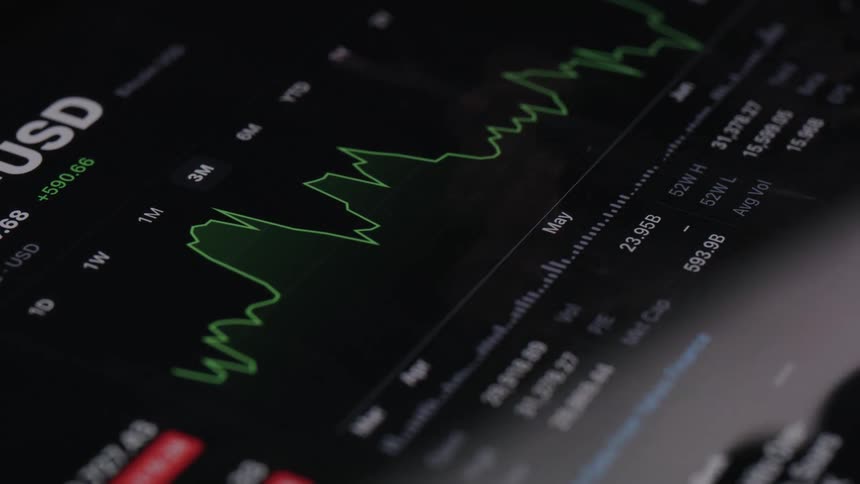
Screen displays the values and the relevant plot of changing stock data
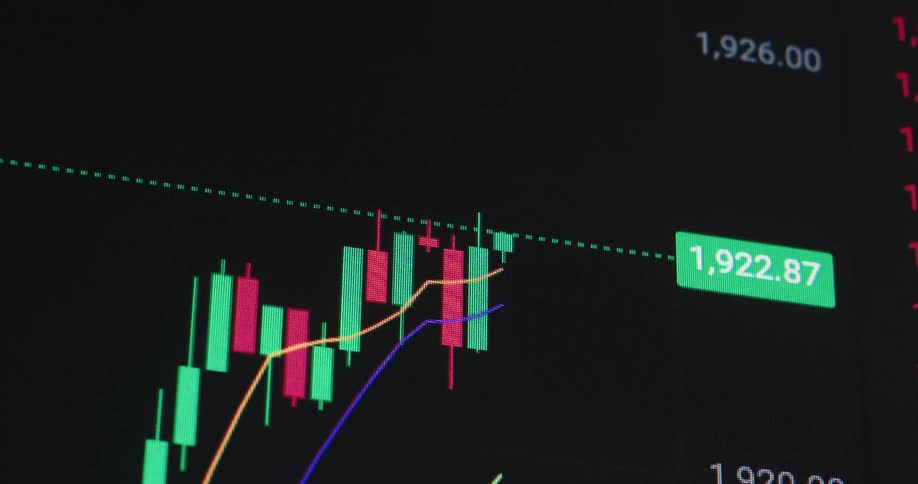
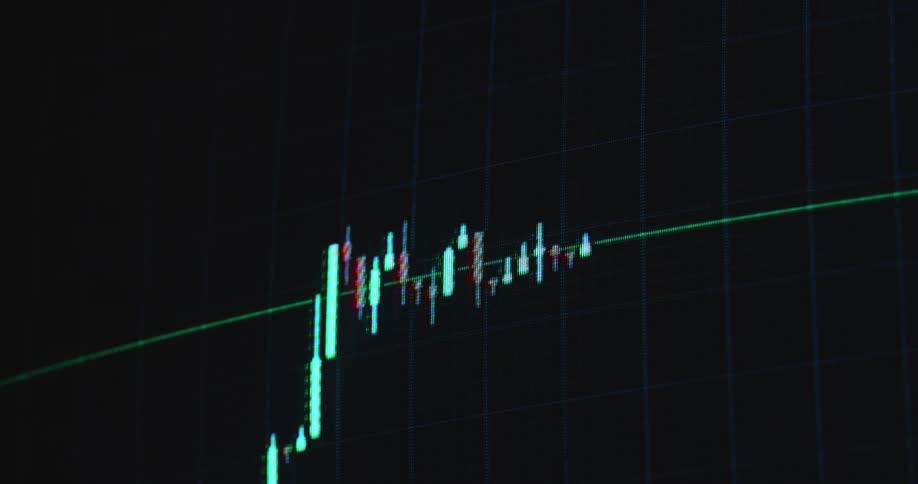
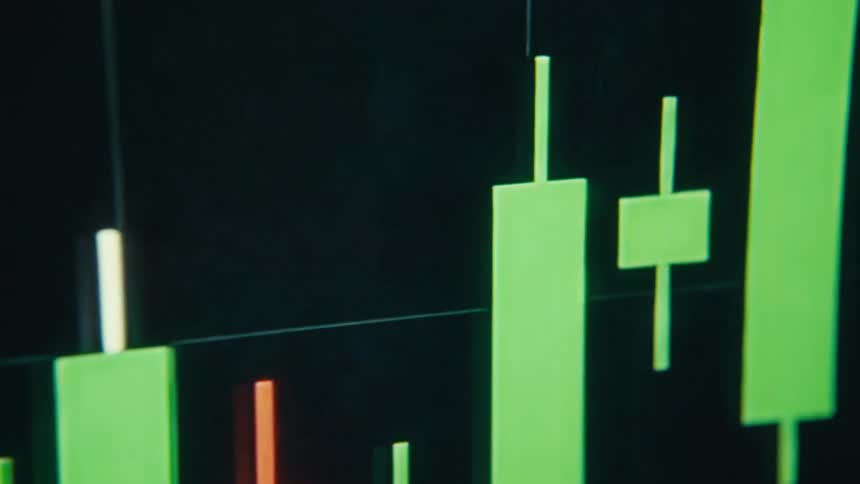
Bullish financial market candle chart
Blue colors the area under the line in a graph contrasting with the black background on a computer screen
A computer screen displaying a stock market candlestick chart with fluctuating red and green lines indicating market trends
A vibrant green digital graph displays fluctuating diagram consisting of lines and vertical bars with a prominent downward arrow indicating a decline of the Wall Street stock market or global economy with negative price development
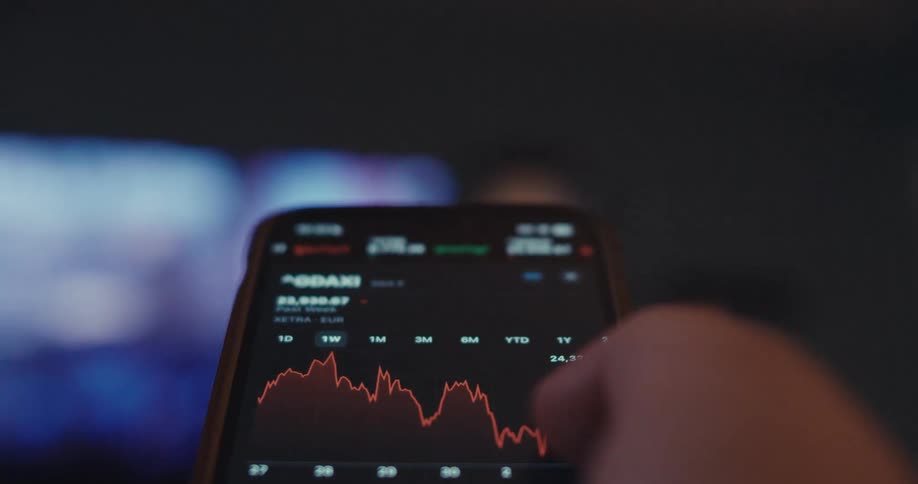
Hand holding a smartphone displaying a financial chart on a lit screen
A green graph on a monitor
Finger pointing at a market line chart displayed on a digital screen
Macro close up of a red arrow that moves up across a pixelated screen as a financial trading graph is building beneath it symbolizing economic growth or rising stock prices or crypto currency trading as successful investment
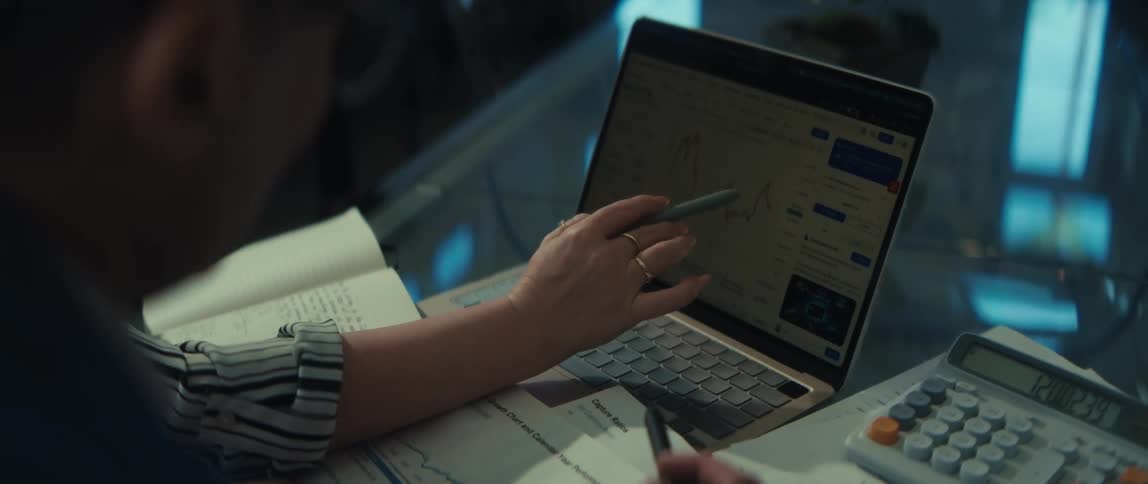
Two people point at the plot displayed on a laptop while collaborating
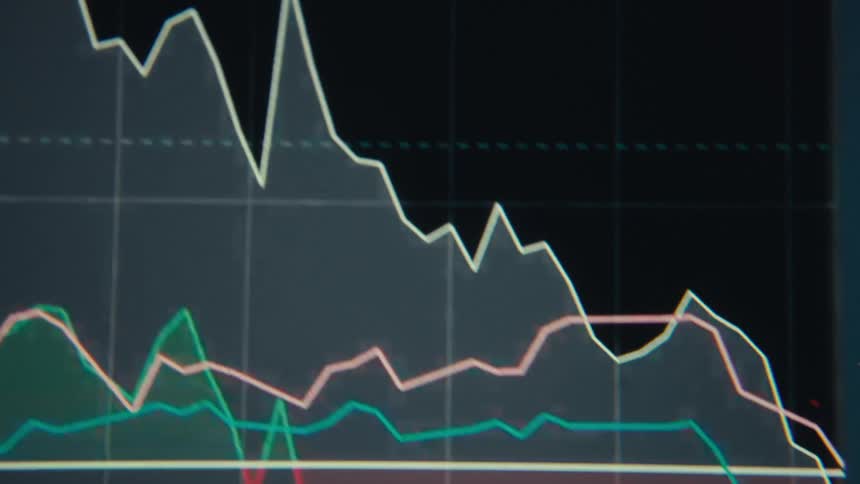
Stock data is plotted in red and green against a black background on a screen
An over-the-shoulder view of two colleagues collaborating and analyzing financial charts on a laptop at a desk
Monetary values displayed on a dark digital financial interface
Closeup of a screen displaying a fluctuating line graph
Reflection on a screen partially obscures a candlestick chart
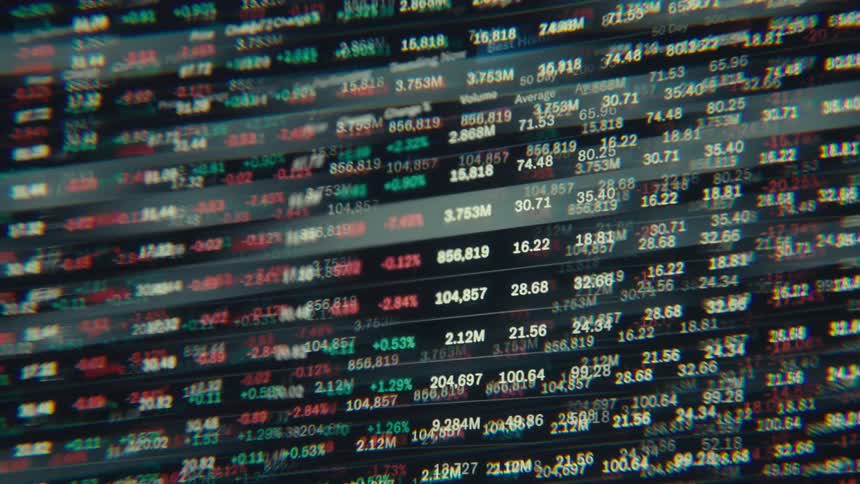
An extreme close-up of a digital display shows columns of rapidly changing financial or statistical data with visual glitches
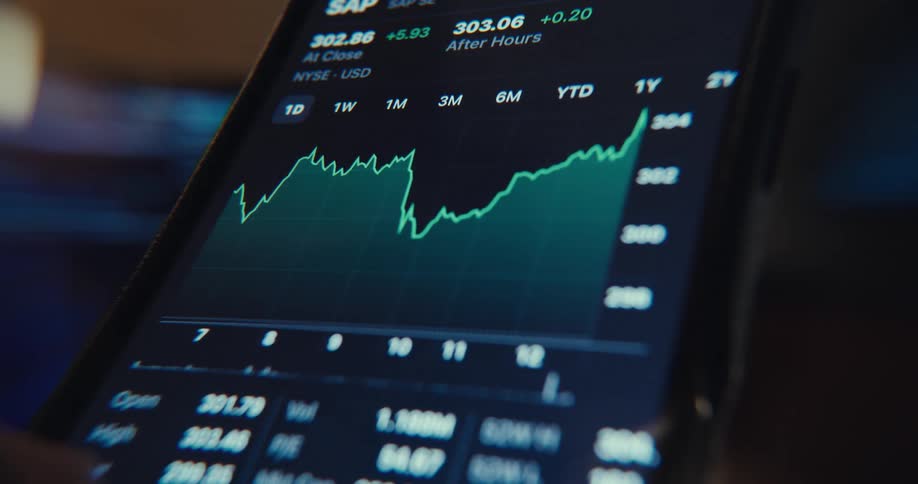
Finger interacting with a smartphone screen displaying a stock market chart
Financial chart with colored lines and areas showing market fluctuations
Futuristic macro close up of a retro digital CTR screen playing animated graph with a rising line chart and upward pointing arrow overlaying moving black bars representing stock market or business growth with financial success on white background
Close up of the shiny engraved surface of golden bitcoin physical coins over a reflecting surface
White and blue lines
Close up of a candle diagram stock chart pattern on a digital RGB TV screen consisting of pixels and green and red candles as the graph rises with a positive upward tendency symbolising financial success and share trading
Green and orange colors of a candlestick chart contrast with the black background on a computer display
A person uses their tablet to check stocks
A bullish bull flag chart pattern is displayed on a dark monitor as the red and green candlestick candles form sideways consolidation before breaking resistance for a massive move to the upside with positive price development and profit in a bull run
A close-up of a business analytics chart loading on a digital screen, focusing on 'Services' and 'Subscriptions'
Extreme close-up of a declining financial chart on a digital screen with a downward-pointing arrow indicating a market recession
Digital chart shows a sharp rise followed by a decline throughout the trading session
A screen displaying fluctuating stock market numbers in focus
The information on the monitor is shaking and blurry
Charts are flashing on the computer screen
A screen with red and blue graphs
A closeup shot of a screen displaying fluctuating stock market graphs and numerical data
A closeup of a persons hand shows their thumb touching a smartphone screen displaying a financial line graph for the stock market
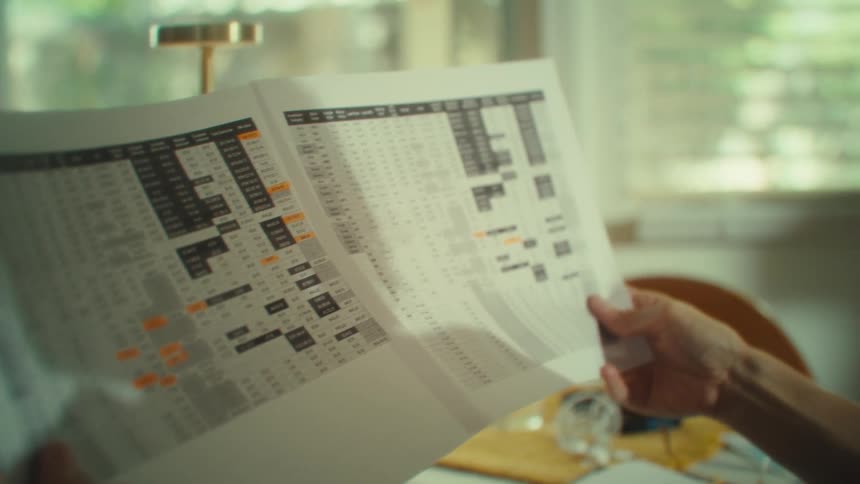
A closeup shot of a persons hands holding up and carefully examining a detailed paper document with a spreadsheet or a table of data
An extreme close-up of a computer screen showing an animated bar and line graph with upward trending data
The neon green pixels of a retro tube television screen display a sales chart or graph on a black background moving upwards representing a positive statistic and data for a corporate presentation
A red and green line graph depicting a sharp decline is prominently displayed on a dark background suggesting a financial downturn and loss
An animated red bar graph with a downward pointing arrow trends down, symbolizing economic recession
Person points to a specific section of a declining chart printed on paper
Charts of currencies rising and falling
A view of graphs and lines on a screen
Hands of two people pointing at a laptop screen displaying a graph
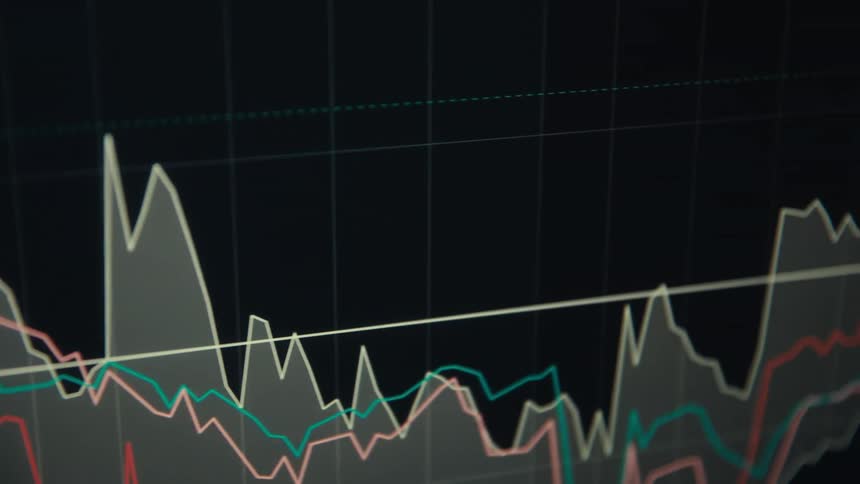
Multi line plot and a candlestick chart share a computer screen
A hand holding a yellow highlighter hovers over a detailed spreadsheet on a laptop screen filled with colorcoded data points
An investor compares their portfolio growth chart on paper to live market data on their laptop while analyzing performance
The tablet display is full of numbers
Closeup of a monitor displaying a financial market chart
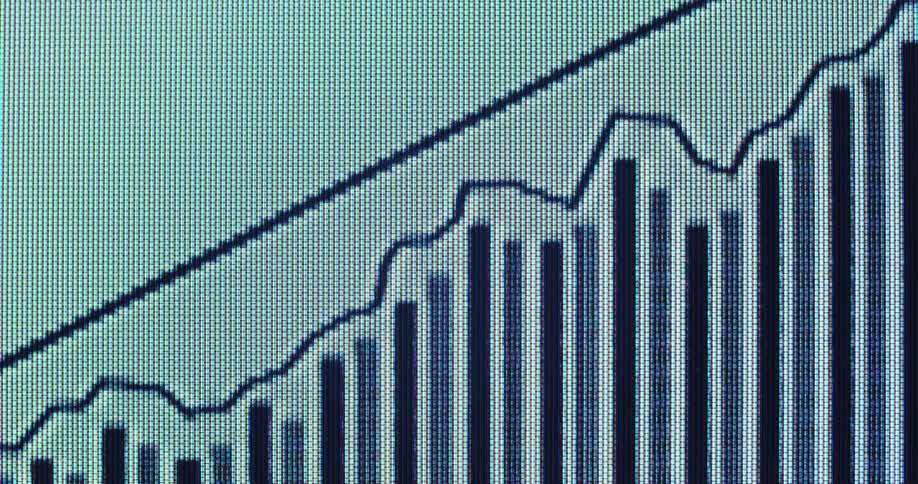
Macro close-up view of a digital screen shows an animated graph with a rising line chart and an upward pointing arrow overlaying vertical bar charts representing market growth or financial success on a white computer screen background
A pile of went coins have the bitcoin cryptocurrency logo on them
Closeup of a computer screen showing live stock market data and charts
Bullish and bearish financial market candle chart
Static shot of a falling graph from an online trading application in a down trend during critical market cycle entering bear market after a crash and crisis on vintage screen with rgb pixels and glitches and retro digital look
The bar graph goes up and down across the entire computer screen
Dramatic upward perspective of Bull Flag chart pattern as the green candles break resistance to the upside and the stock or crypto currency goes on price discovery with positive upward movement and trend displayed on monitor of a professional broker
A person is pressing the tablet
Digital pixelated graph with positive trendline going up showing growth and financial strength of the global or US economy or an economical upward trend while making progress and profiting from business opportunities
A person traces his finger across the monitor
Line graphs and information are displayed on the computer screens
Closeup of a screen displaying distorted stock market data
A finger scrolls a glowing market chart on a screen that shows fluctuating prices with sharp dips and recoveries
A close view of a glowing computer screen displays colorful digital stock market charts and data with motion blur and light leak effects across the frame
A stylus points at colorful fluctuating line graphs displayed on a digital screen suggesting data analysis or market tracking

Need help finding the
right footage?

Have it delivered to your account within 1 business day.

This is Filmsupply

Our StoryOur FilmmakersArticlesFilmsPopular SearchesAll Categories

FM

A family of brands dedicated to empowering the creative.

FILMSUPPLY

Footage licensing for productions

MUSICBED

Music licensing for filmmakers

STILLS

Image licensing for creatives

© 2026 FM LLC.

Privacy PolicyLicense TermsTerms & ConditionsCareers