Musicbed
Filmsupply
Stills
Contact Us(800) 805-6802
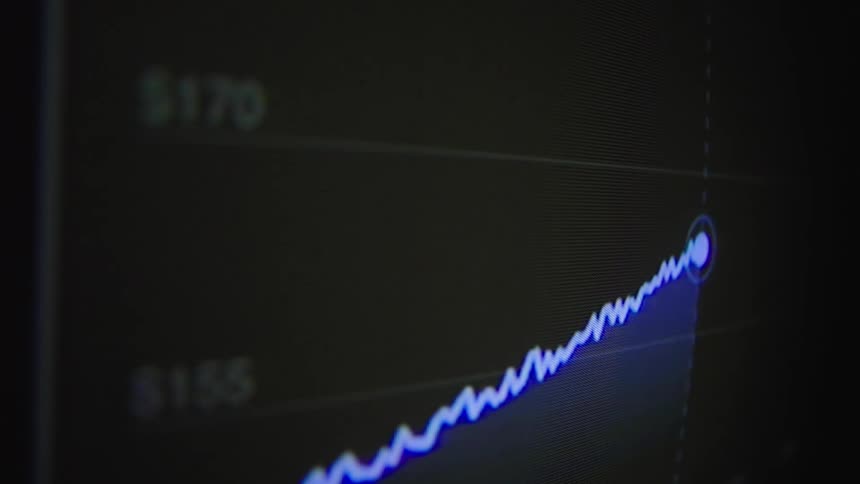
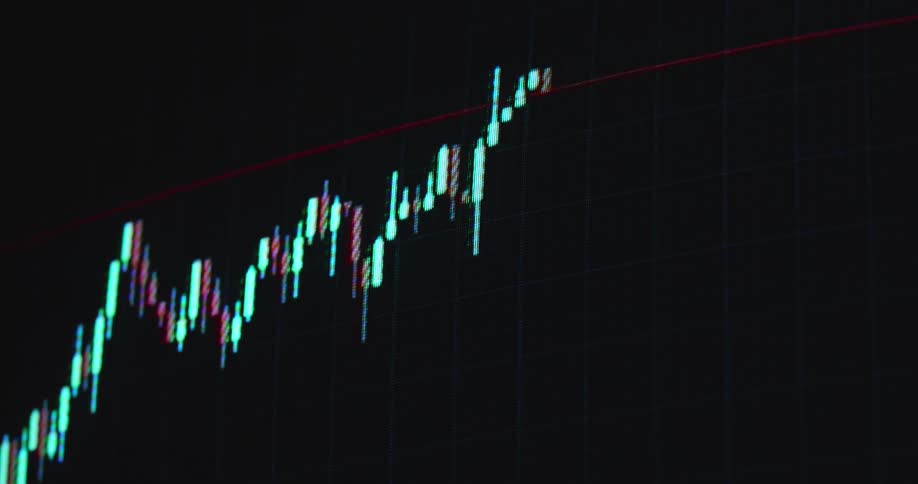
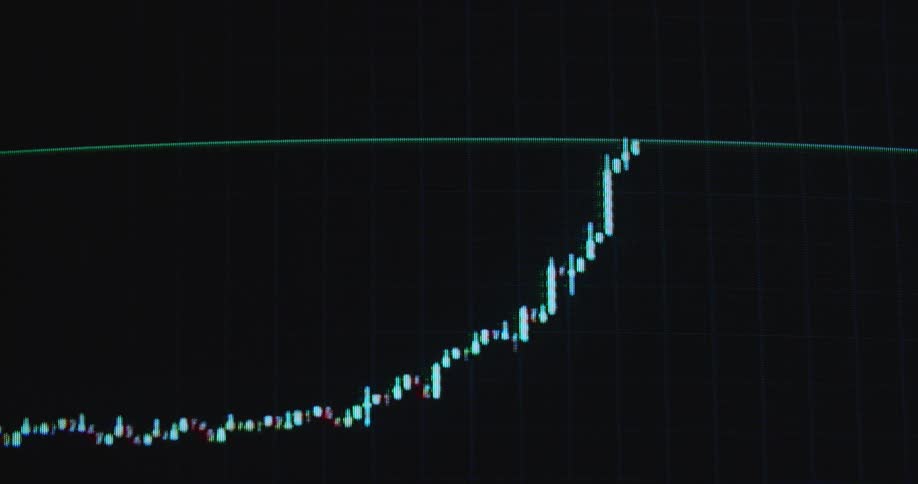
A close-up of a rising stock market graph on a digital display showing financial growth
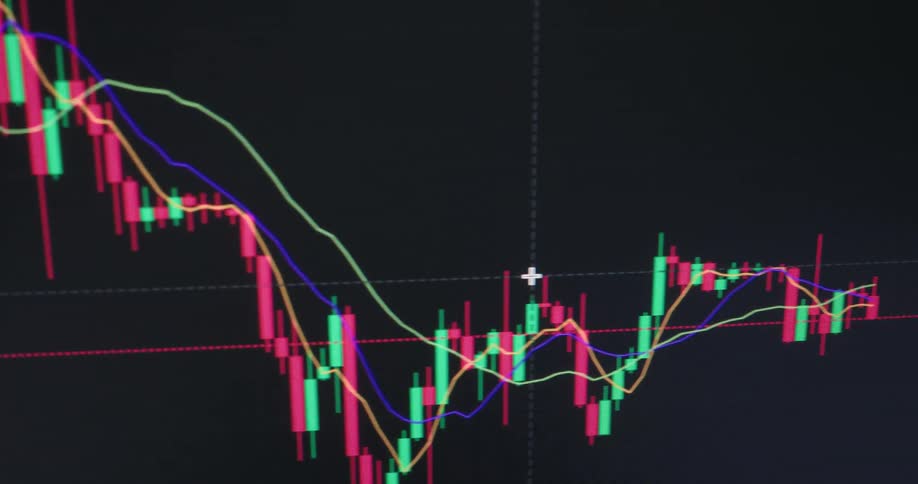
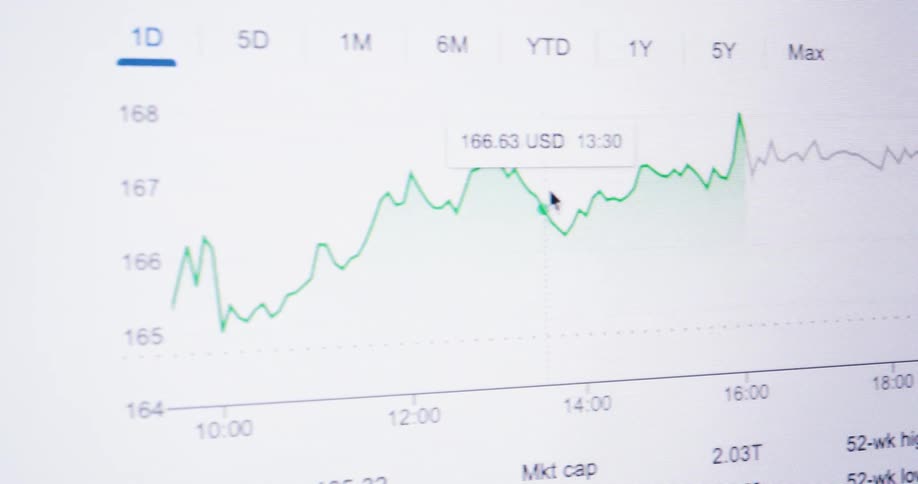
A close-up of a digital stock market chart displays real-time price fluctuations with candlestick patterns on a screen
A rapid distorted pan across a financial monitor displays a flurry of stock symbols and fluctuating dollar amounts with bright green and red indicators shimmering through a heavy fisheye lens effect
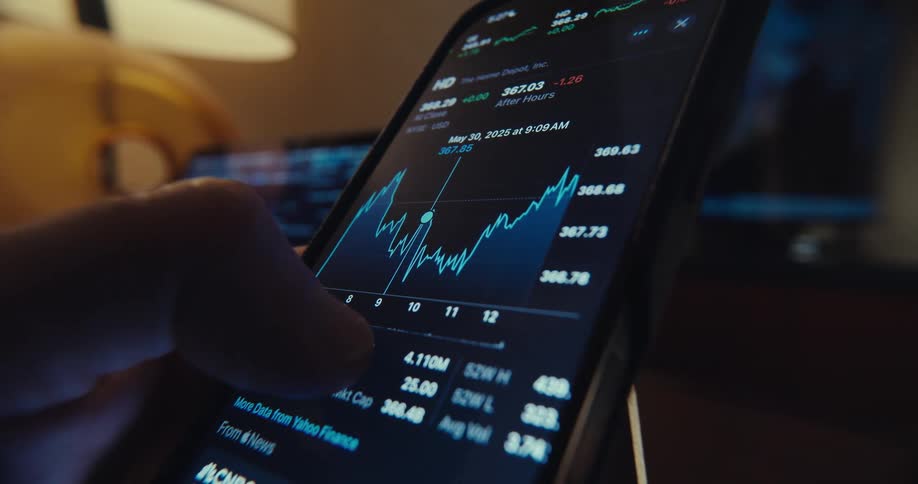
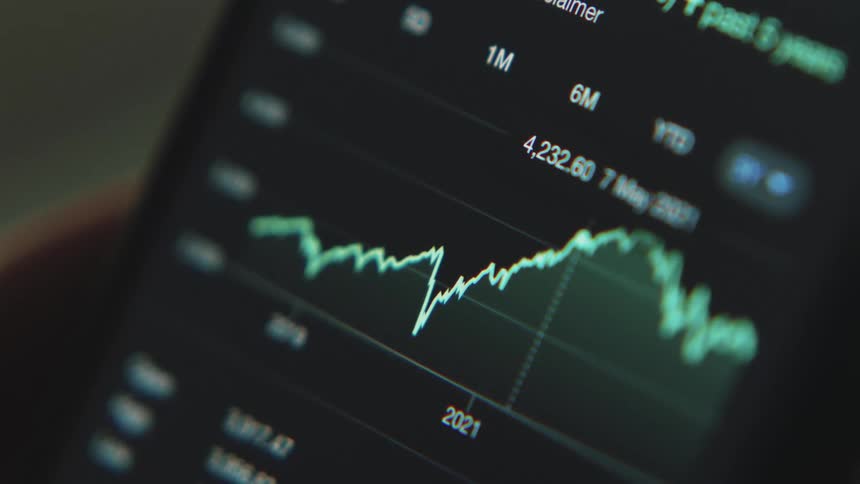
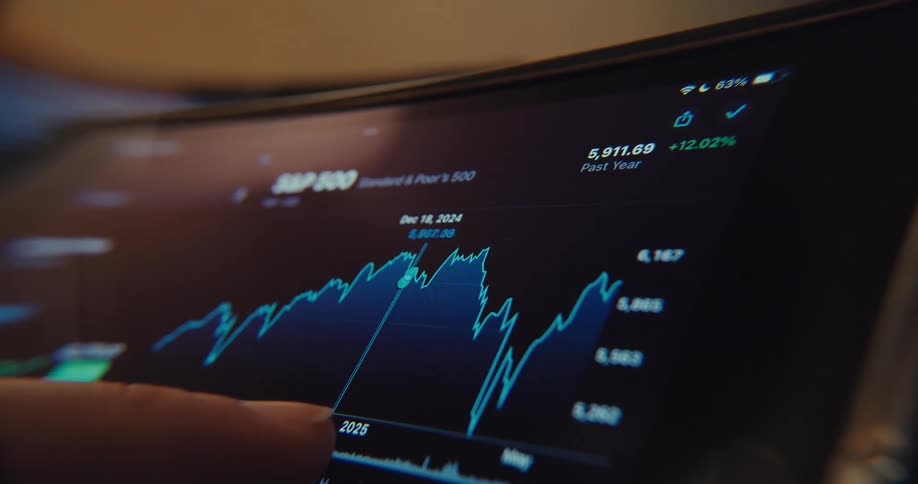
A finger scrolls through a live stock chart on a smartphone screen
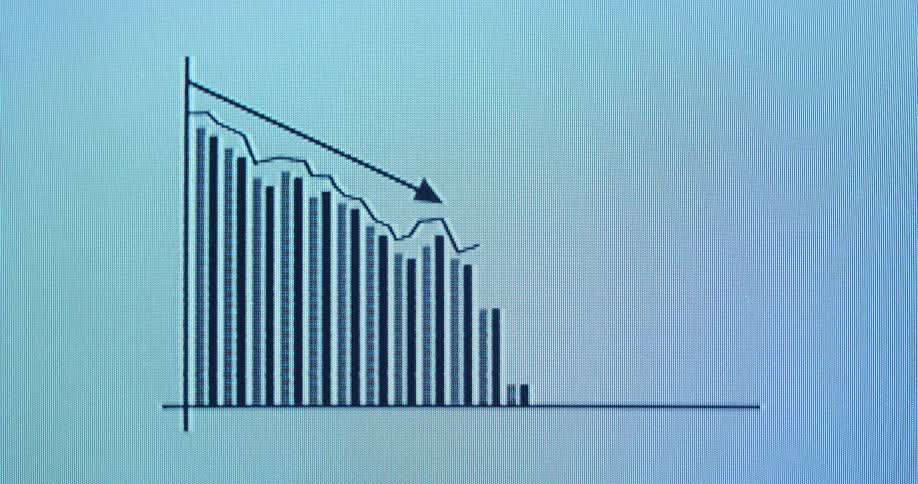
A macro view of a digital screen displays a falling stock market chart with a downward trend arrow
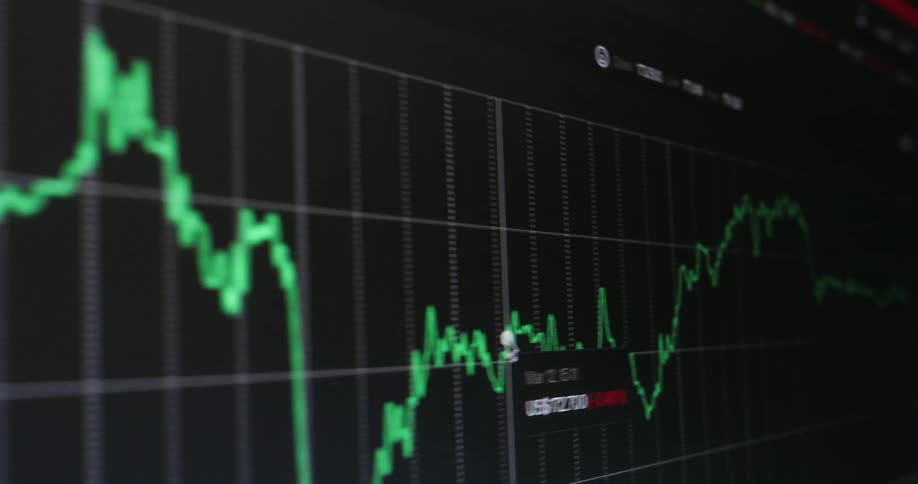
A chart showing the change in stock prices
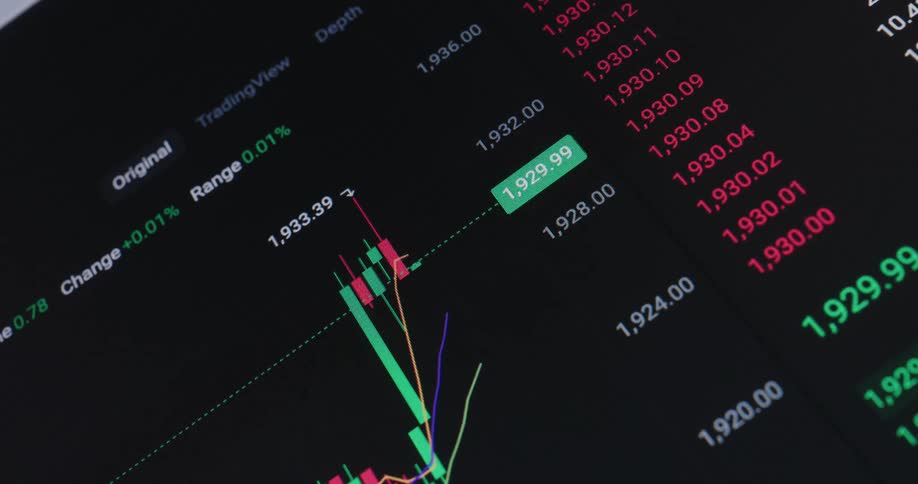
A close-up of a digital screen showing a real-time stock market chart with fluctuating numbers and candlestick patterns
A person is scrolling through information on their cell phone
Black swan event hits global economy or financial markets causing crash crisis or meltdown and stocks and shares or other investments collapse into red digits or figures causing panic and massive losses followed by economic recession and bear market
Digital display shows graph and data points
Scrolling on a chart showing the fluctuation in a stocks price
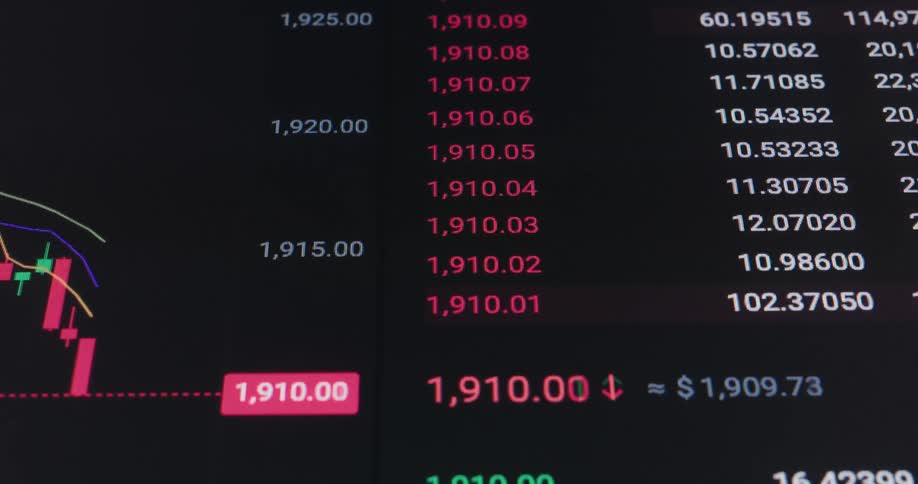
Red candlestick charts indicate sharp market downturn with fast price movement and negative development caused by stock or finance market crash and recession displayed on digital computer screen causing stress and panic while assets lose value
One bitcoin stands on edge as other gold bitcoins are lying in moving water
Close-up of a digital bar graph showing financial growth with increasing dollar values in millions
A close up of numbers and charts on a screen
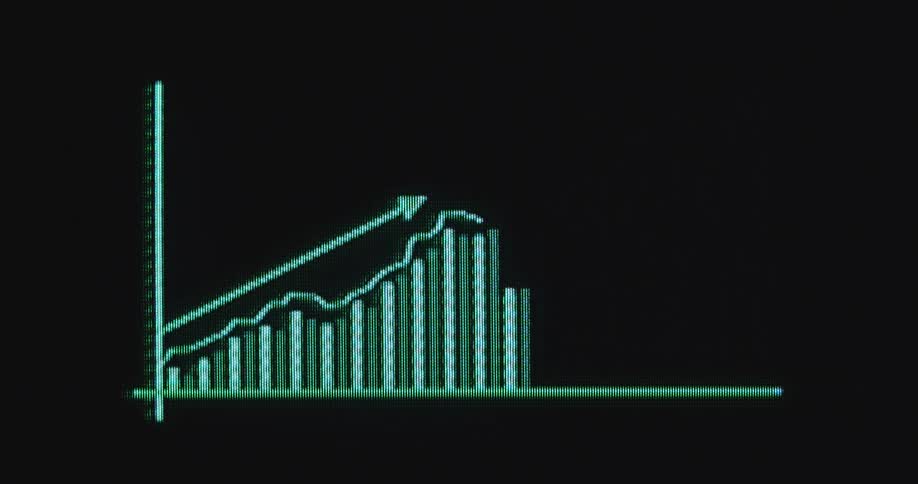
An animated green bar chart on a digital screen illustrates exponential growth with a rising arrow
A computer monitor displays a stock market candlestick price chart
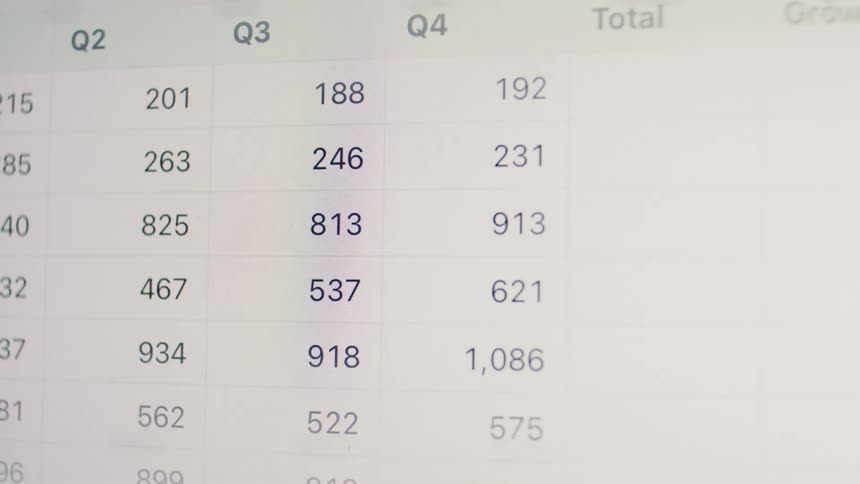
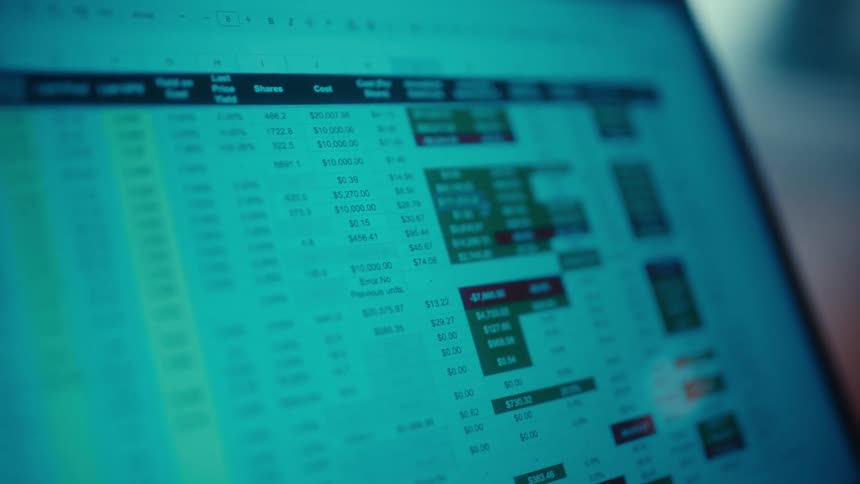
A close-up view of a spreadsheet on a computer screen being automatically populated with quarterly financial figures and totals
A person is checking a graph on their phone
A graph speeding through the evolution in price of a stock over several years
Mouse scrolling over a graph of the value of a currency
A financial ticker screen displays rapidly changing numbers, shifting between red losses and green gains
A close view shows blurry digital graphs and stock market data with red and green bars moving quickly across a dark screen
A pile of cash is on fire
A green rising digital bar chart appears on the computer screen symbolizing financial freedom and success due to economical growth and an upward trend of the global economy and digital stock markets and crypto trading platforms
A woman is looking at a graph on her laptop
Digitized trading graph crashes and falls down as the stock market collapses with a negative downward tendency into the red digits providing opportunities for new stock brokers and investment strategies in the equities or crypto currency market
A mans finger drags across the screen of a tablet to get relevant data from a graph
A line graph is on the long monitor
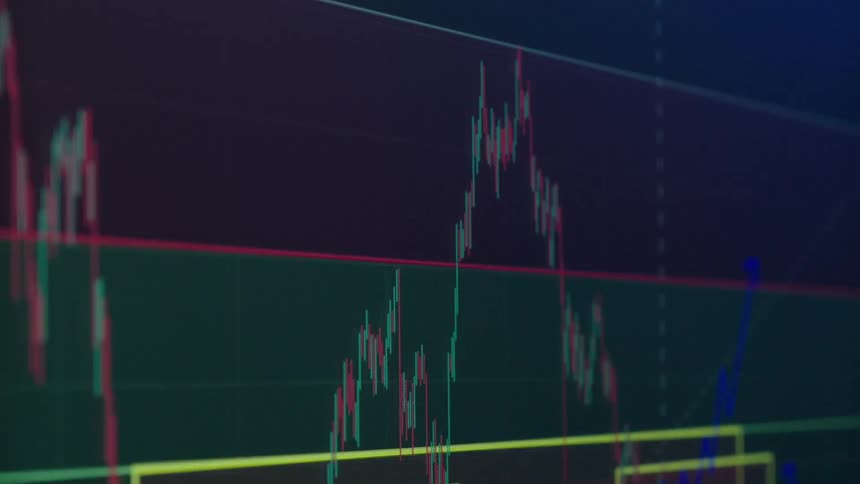
Screen displays pink and green graph lines on a grid
Stacks of money on fire on the floor in a dark room
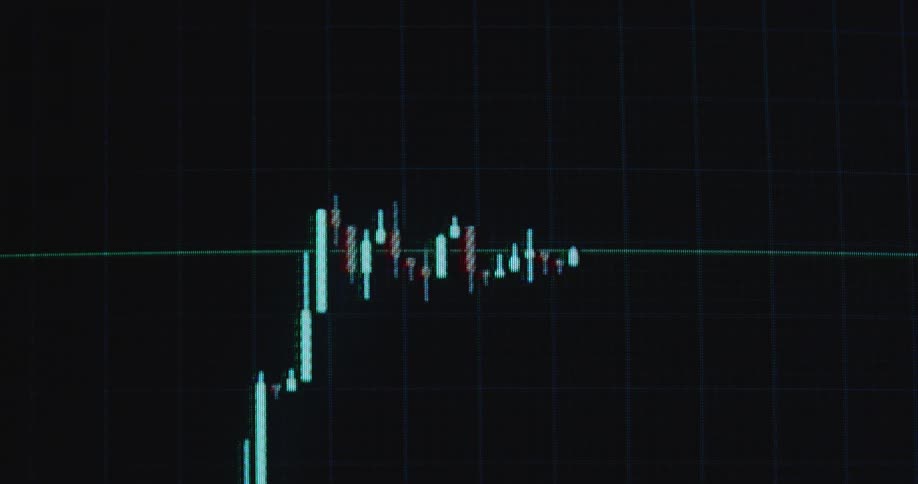
Financial candlestick chart showing strong upward movement after Bull Flag breaks resistance to the upside and bullish price action continues during massive crypto bull run and alt coin season creating generational wealth among investors and traders
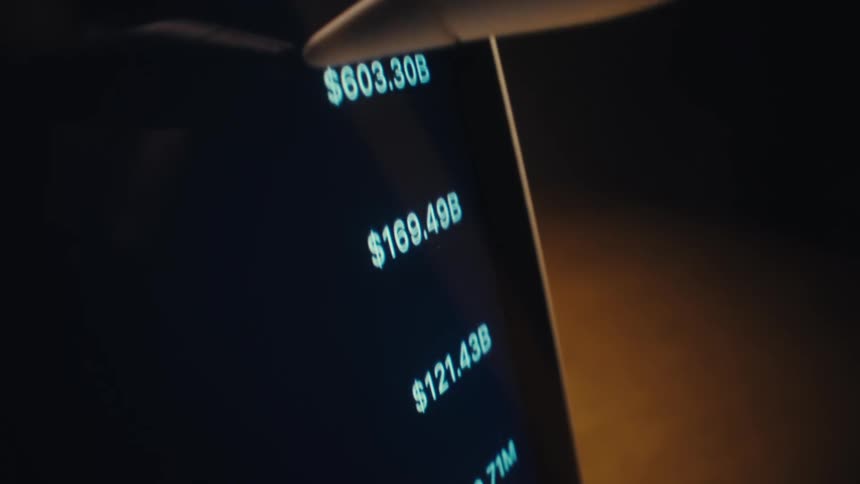
A close up shot of a dark digital screen displaying a list of large financial values in blue text which a person scrolls through using a white stylus
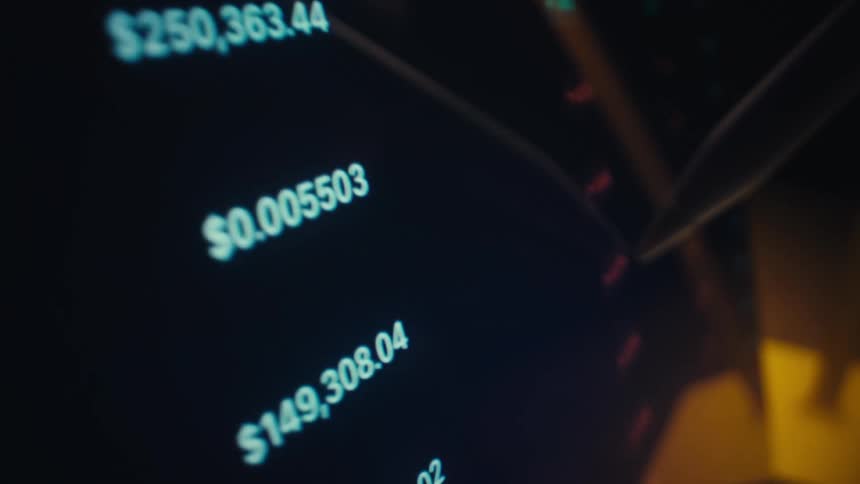
Digital pen pointing to numeric values displayed on a dark financial interface
A view of a stylus controlling a smartphone screen
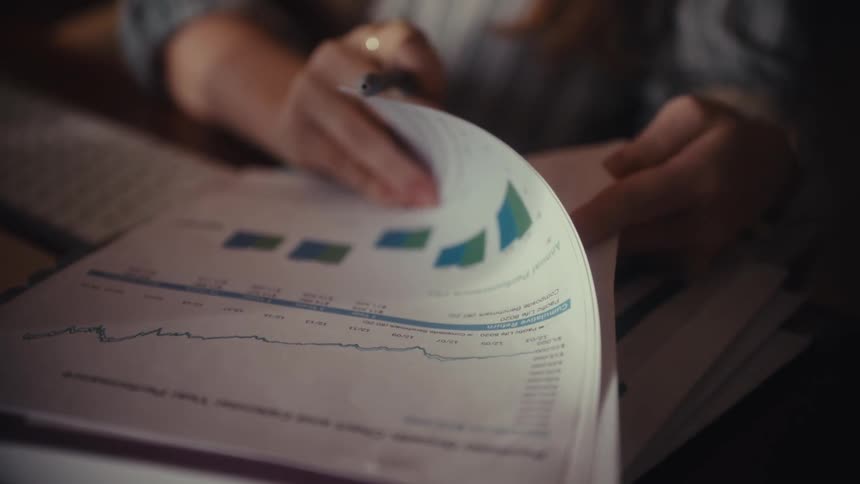
A person reviews and marks financial documents on a desk
A woman reviewing documents beside her laptop while working late in a dimly lit home office
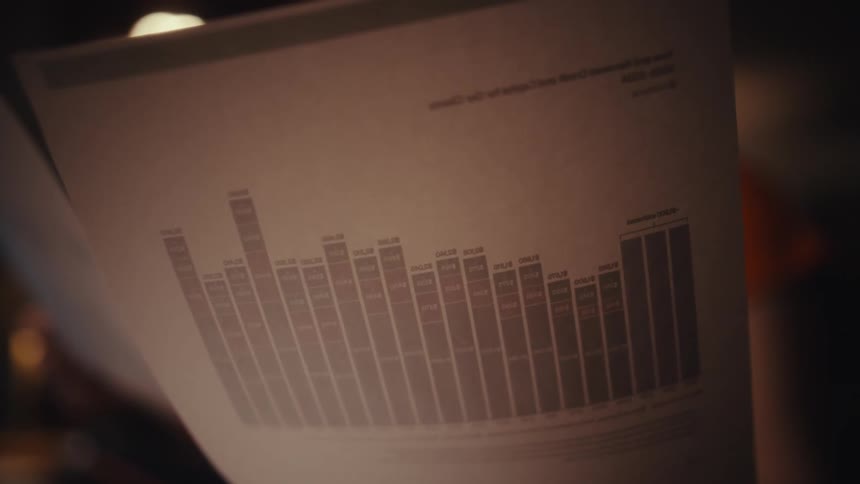
Document with a bar chart and financial data in selective focus
A woman looking at a computer screen
Stock percentages are listed on the monitor
Screen showing numbers scrolling and switching between red and green due to the stock market
A woman is using a pen to point at a graph on a sheet of paper as she talks to someone in an office
A computer monitor displaying a series of stock prices
Close up of pixelated investment graph going up during an upward trend as a symbol for rising stock market and financial freedom and success during economic growth on an old TV or computer screen showing a finance app
Numbers and a graph are on the computer screen
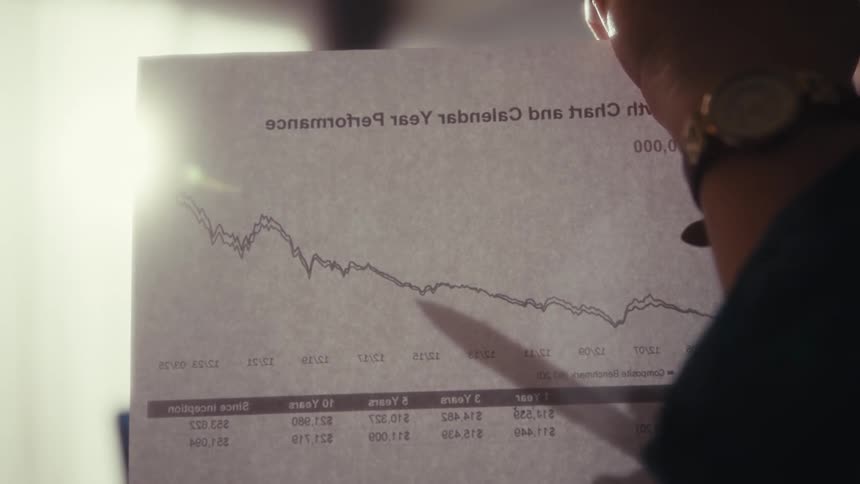
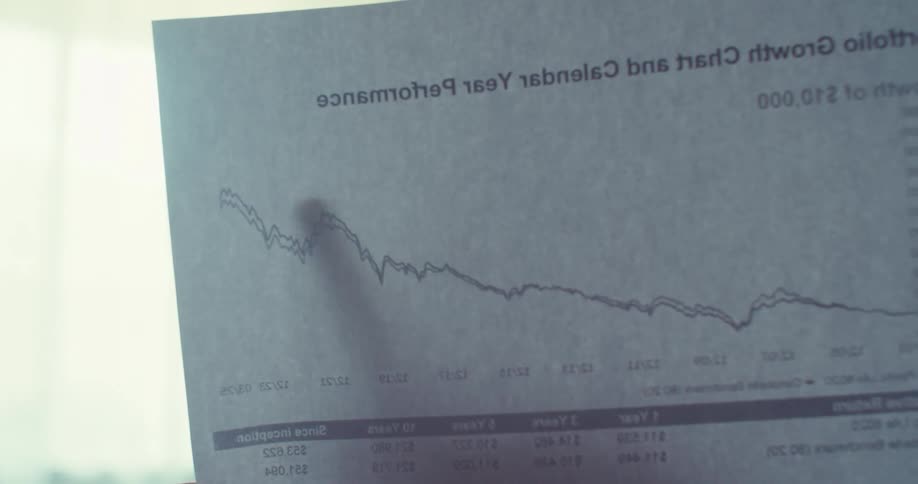
A business analyst slowly reviews portfolio growth charts and performance data on paper documents
Pixelated RGB computer or display device screen presenting a candlestick trading chart with positive exponential price development as the green candles go up indicating a healthy global economy and stock market reaching new all-time highs
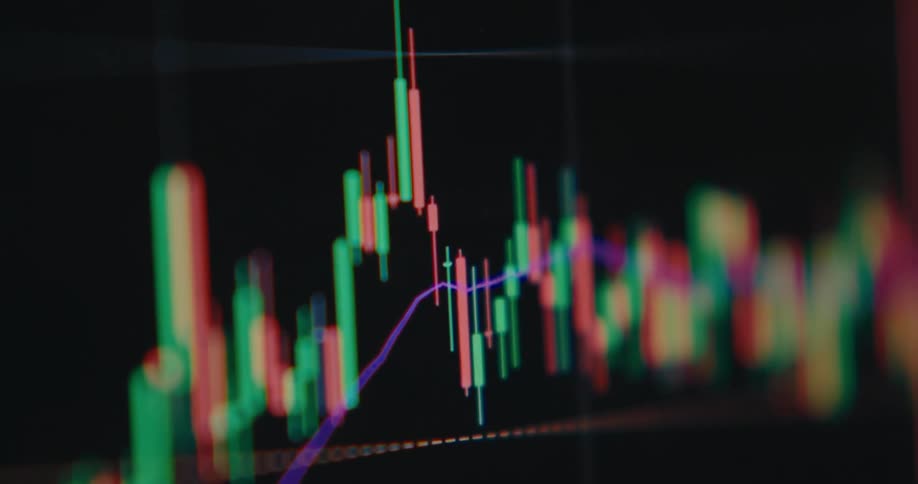
A close-up, shallow depth of field shot of a colorful candlestick graph displaying fluctuating financial market data on a screen
The numbers move fast on the monitor
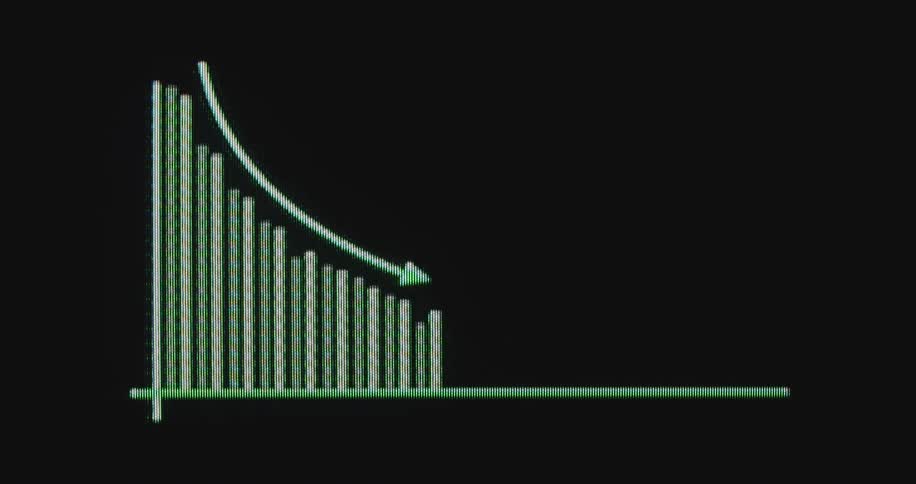
An animated retro-style green bar chart with digital distortion shows a steep decline on a dark screen
A man wearing thick glasses is holding a financial report showing an upward trend and is using a pen to draw attention to the graph line
A macro shot of a digital screen reveals a rapidly changing stock market graph, with prices fluctuating and a green line trending upwards
Dynamic hand-held macro shot of pixelated screen showing stock trading chart or financial graph crashing with negative downward tendency falling into the red figures causing stress and panic with fear of economic recession
Pixelated macro close-up of a digital screen showing the user interface of an online trading platform or finance app or broker application displaying a candlestick chart or graph with green candles as the price increases and goes up with a positive trend
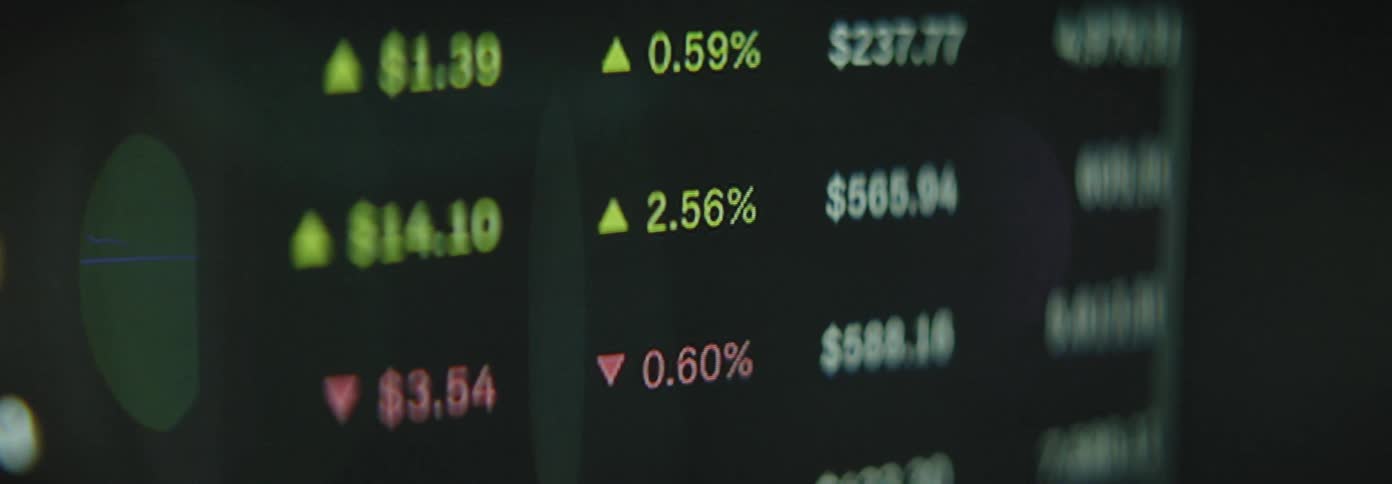
Close-up of a digital stock market board showing real-time price changes, with green numbers rising and red numbers falling
Falling financial market chart against a background of abstract numbers
Grid and white lines displayed on a screen with blur effect
A wall made up of animated graphs
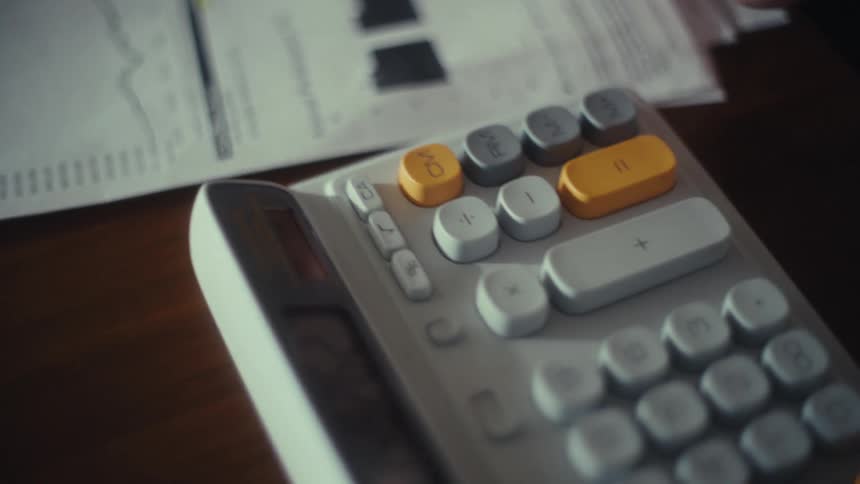
A persons hands highlight a chart on a document and then press buttons on a calculator sitting on a table next to the papers
CRT or cathode ray tube monitor with RGB pixels displaying animated bar chart with negative trend line and downward pointing arrow going down as the business expenses are lowered or the profit is declining due to bad economic development
Pixelated computer screen displays a red graph with statistical data showing the increasing inflation rate as prices for everyday goods and living costs in the US rise with a very high CPI or consumer price index causing financial problems
The candlestick trading chart or graph steadily rises with a positive upward tendency and trend showing the price development of the MSCI World or S&P 500 or another ETF as a store of value and protection against inflation
A pair of coworkers in an office examine printed reports together at a table

Need help finding the
right footage?

Have it delivered to your account within 1 business day.

This is Filmsupply

Our StoryOur FilmmakersArticlesFilmsPopular SearchesAll Categories

FM

A family of brands dedicated to empowering the creative.

FILMSUPPLY

Footage licensing for productions

MUSICBED

Music licensing for filmmakers

STILLS

Image licensing for creatives

© 2026 FM LLC.

Privacy PolicyLicense TermsTerms & ConditionsCareers