Musicbed
Filmsupply
Stills
Contact Us(800) 805-6802
A digital chart with a downward-pointing arrow slowly pans across a screen, symbolizing economic decline
Numbers and a graph are on the computer screen
A close up of digital writing and numbers
Screen displaying the financial market chart in candles
Computer monitors are showing graphs and data
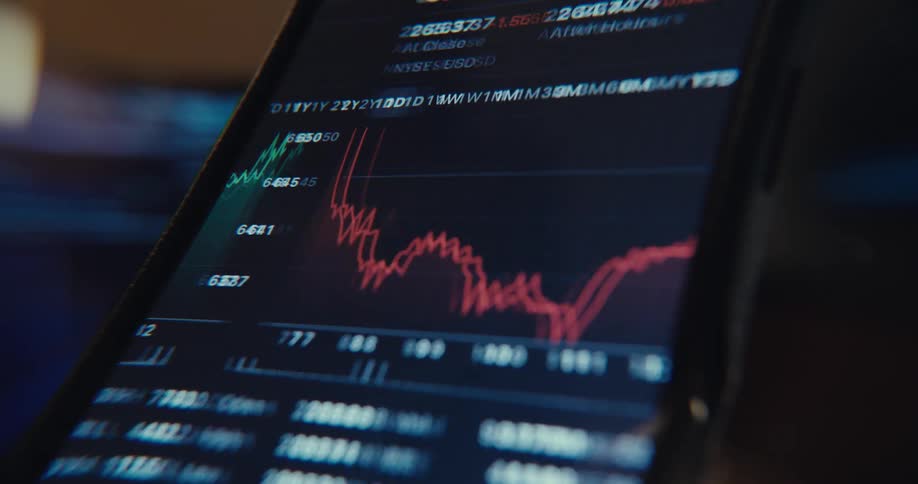
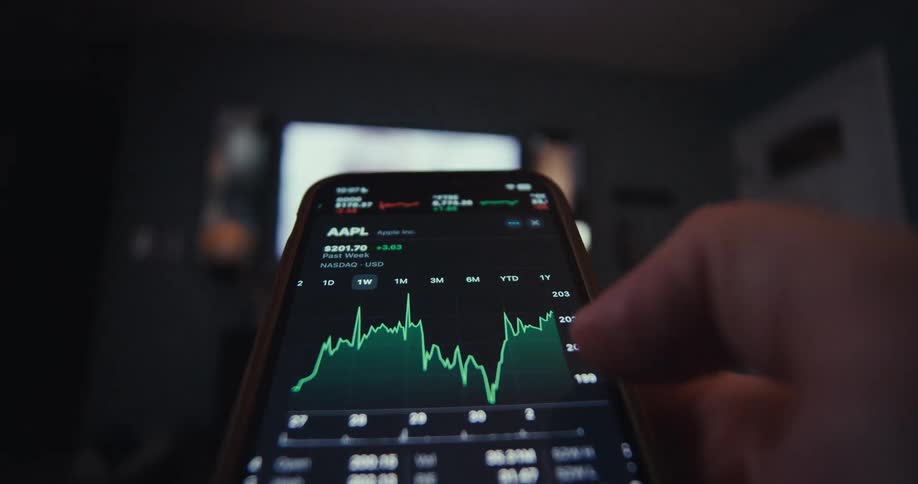
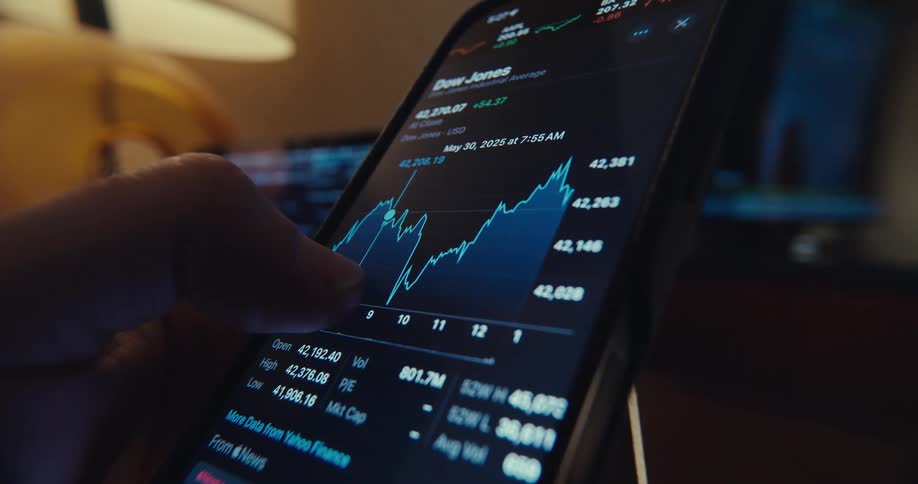
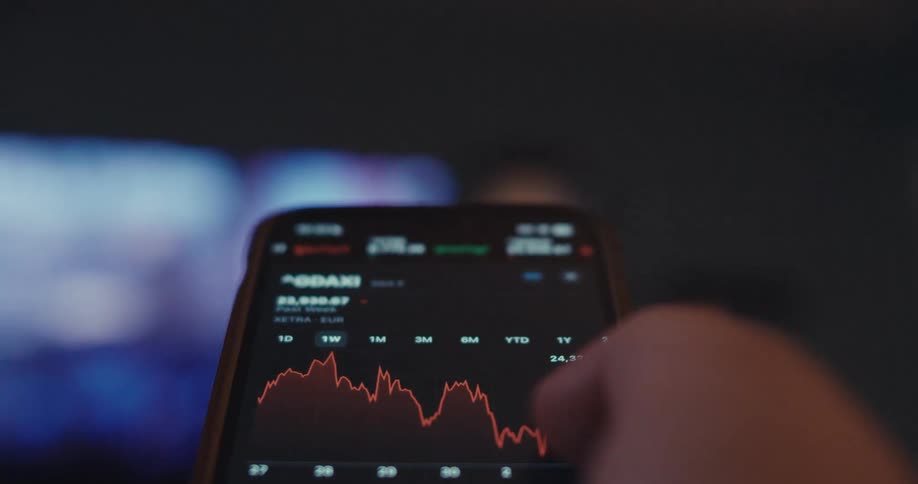
A finger scrolls through a stock market chart on a smartphone in a closeup shot
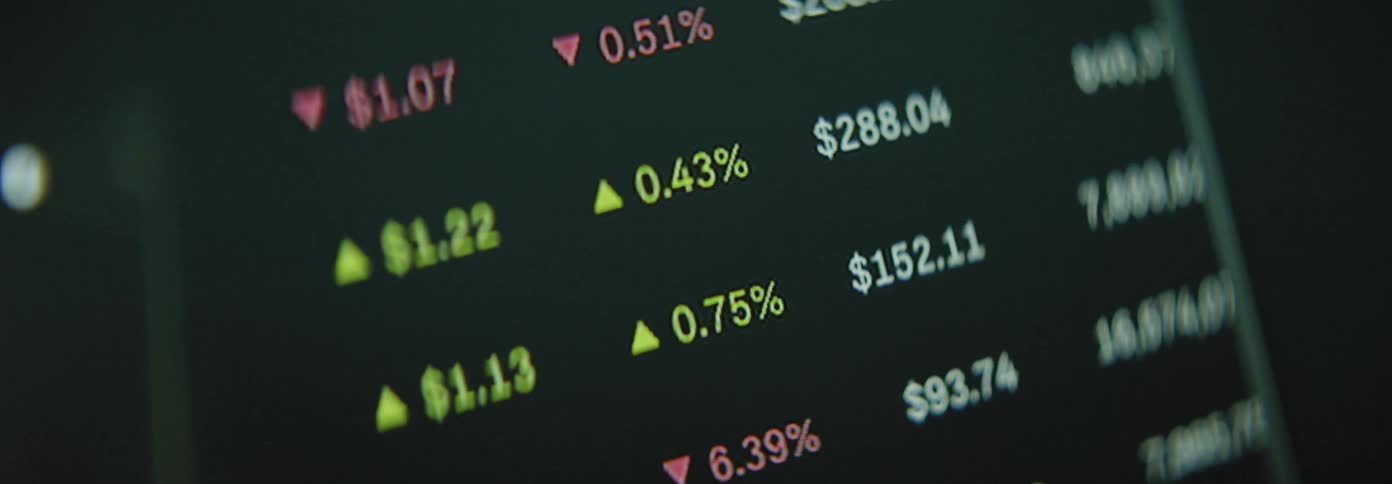
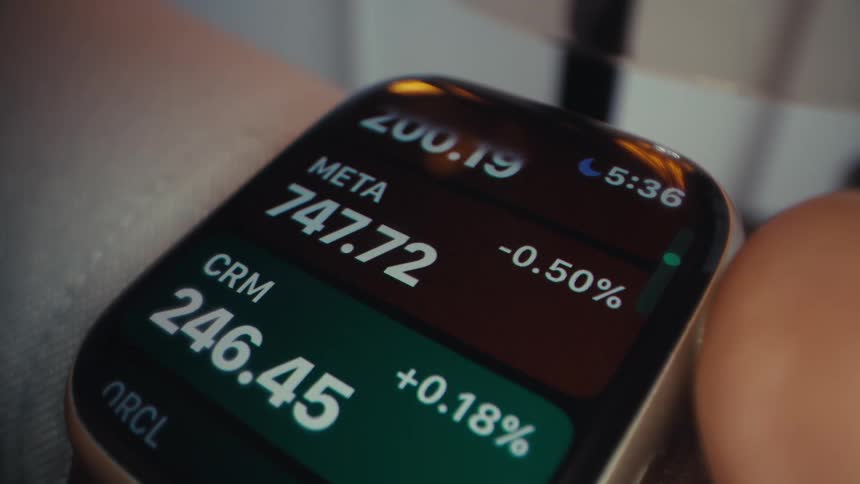
Closeup of a screen displaying numbers and percentages
A close-up of a digital candlestick chart on a screen shows financial data fluctuating in real-time
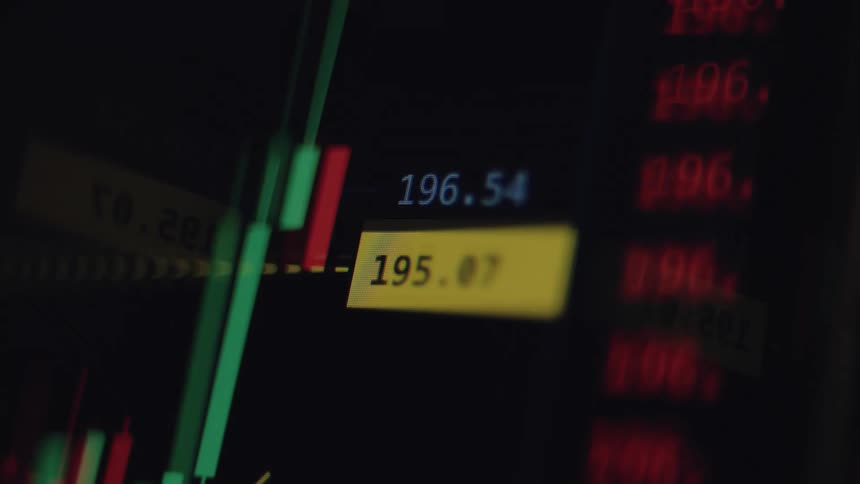
Financial market candlestick chart against a dark background
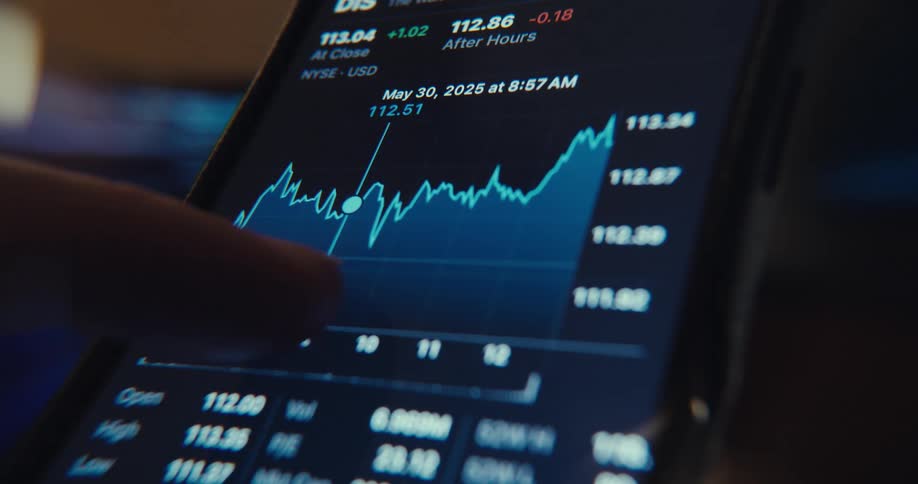
Hand using stock exchange app on a smartphone
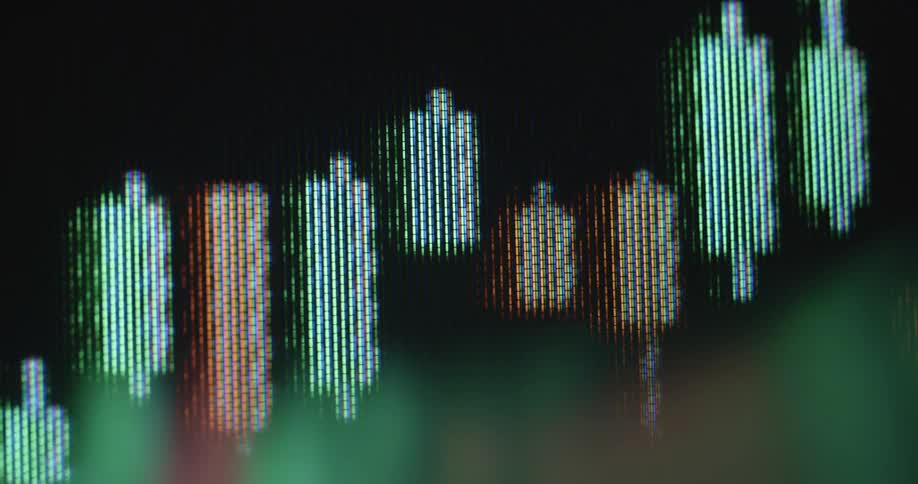
Bright neon green bars or candles of a candlestick chart pattern or financial graph on computer display screen with dark background and positive price development symbolizing successful stock trading with upward trend and handheld camera movement
A closeup digital screen displays a fluctuating stock or financial chart
The video shows a closeup shot of a wrist with a watch displaying financial information including stock prices and cryptocurrency values the numbers for various tickers like goog msft and btc can be seen changing
A finger scrolling on aglowing market chart on a screenthat shows fluctuating prices with sharp dips and recoveries
Close up of water running over the shiny engraved surface of golden bitcoin physical coins
A close up of numbers on a screen
Information is listed all over the monitor
A close-up of a digital stock market ticker shows prices rapidly changing in red during a volatile trading session
Closeup of a monitor displaying a financial market chart
Tall green candlestick bars with thin white wicks rise against a dark background their sharp tops and bottoms hinting at sudden bullish spikes and shortterm volatility
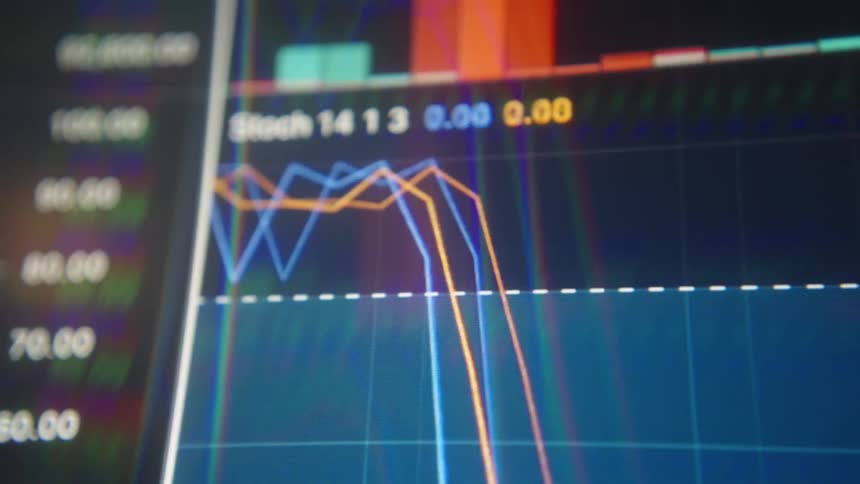
Multiple data points at different values are continuously plotted next to a candle chart of a stock or crypto currency trading graph in a finance application or app on a dark pixelated computer screen
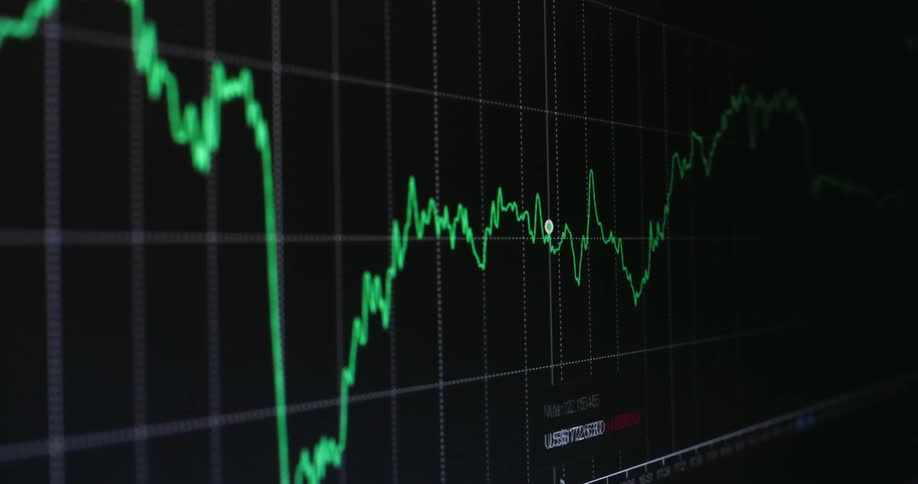
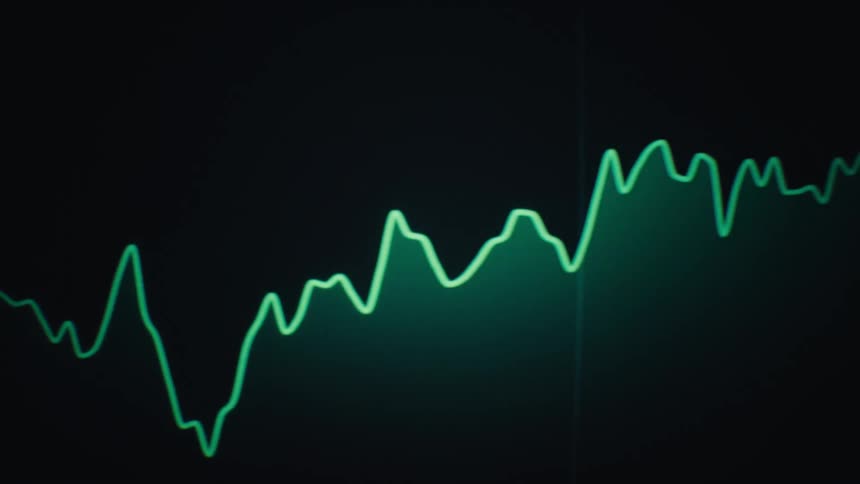
A line graph shows fluctuating stock data shifting into a rising trend against a dark background
A close up view of a digital screen displays financial market data with numbers and percentages changing
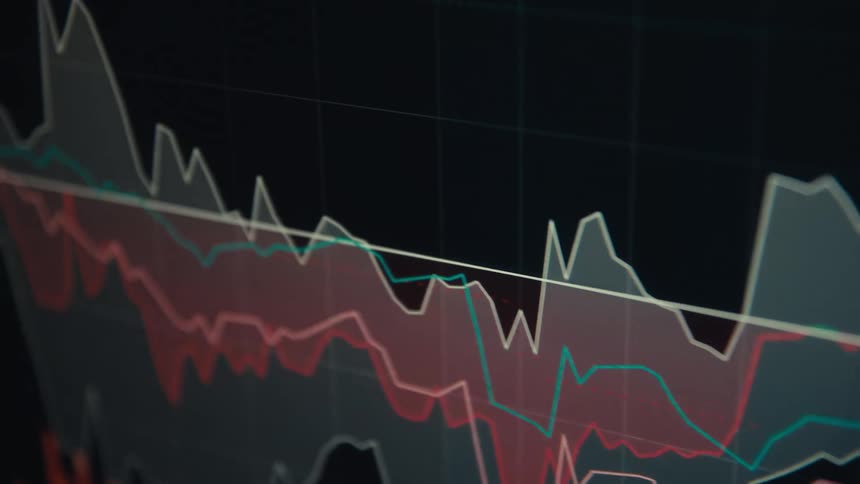
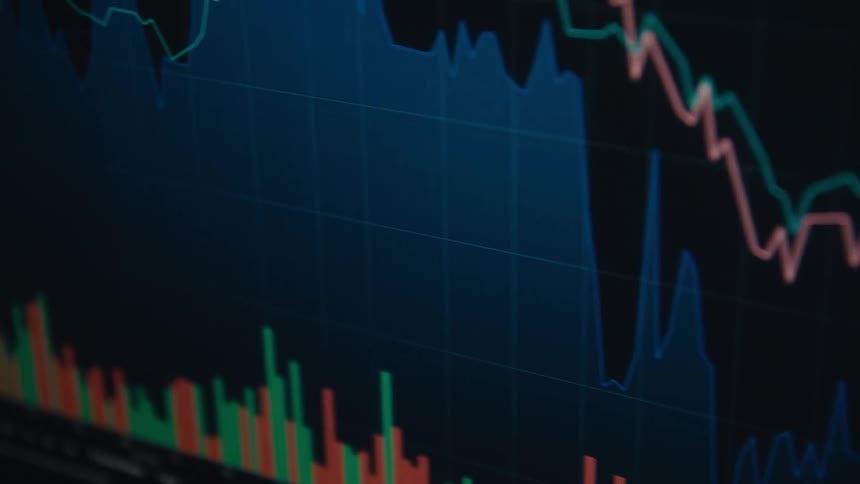
Financial chart with colored lines and areas showing market fluctuations
A close-up of a digital stock market chart on a screen shows a red notification alerting to a sharp drop in value
A closeup shot of a screen displaying fluctuating stock market graphs and numerical data
A red and green line graph depicting a sharp decline is prominently displayed on a dark background suggesting a financial downturn and loss
A close-up shot of a digital screen displaying a financial portfolio's value in US dollars
Reflection on a screen partially obscures a candlestick chart
Extreme closeup of a pixelated red chart with significant downward trend highlighted by descending line and arrow as the stock market or the global economy decline and the US dollar loses value due to negative price development
A macro close-up of a digital stock market graph showing a bearish trend with a declining arrow indicating a financial crisis
Graph of the price of a currency
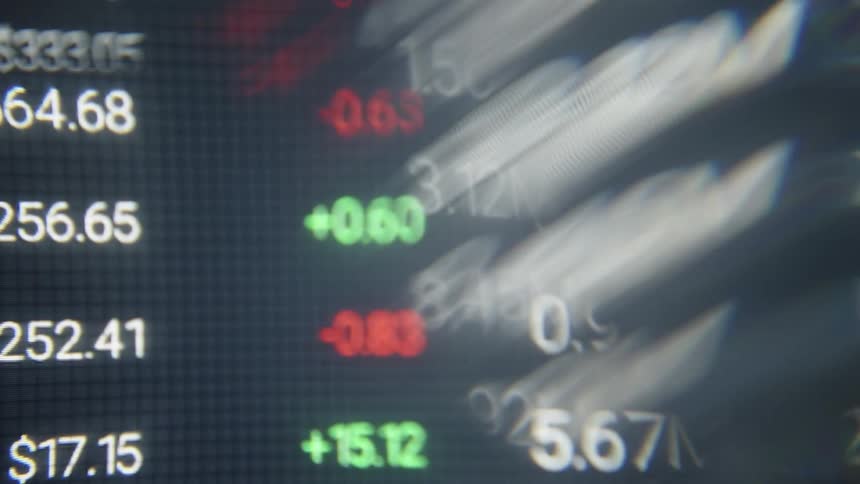
A rapid distorted pan across a financial monitor displays a flurry of stock symbols and fluctuating dollar amounts with bright green and red indicators shimmering through a heavy fisheye lens effect
Colored line graph displayed on a screen changes as the data values change
Line graphs and numbers move across the monitor
A person puts their fingers on their cellphone screen
A closeup view of a stock market ticker displaying various stock symbols prices and percentage changes
A macro shot of a digital screen reveals a rapidly changing stock market graph, with prices fluctuating and a green line trending upwards
A hand is shown pointing at a line graph on a smartphone screen displaying stock market data
A closeup of a persons hand shows their thumb touching a smartphone screen displaying a financial line graph for the stock market
Red and green candlestick chart on a pixelated screen with RGB pixels as the bearish graph breaks resistance to the downside and the market or asset value collapses causing massive losses and volatility due to an unexpected crash
A vibrant green digital graph displays fluctuating diagram consisting of lines and vertical bars with a prominent downward arrow indicating a decline of the Wall Street stock market or global economy with negative price development
A close-up of a digital stock market chart displays real-time price fluctuations with candlestick patterns on a screen
A close-up view of a stock market watchlist on a computer screen shows fluctuating green and red bars indicating gains and losses
A single shiny coin with the bitcoin logo on it stands atop a wet surface
Falling financial market chart against a background of abstract numbers
Digital quotation table showing values percentage changes and market charts
The person is scrolling through a stock feed on their cell phone
The screen is full of line graphs
The bar graph goes up and down across the entire computer screen
Close up of a candle diagram stock chart pattern on a digital RGB TV screen consisting of pixels and green and red candles as the graph rises with a positive upward tendency symbolising financial success and share trading
A computer screen with a green graph on it
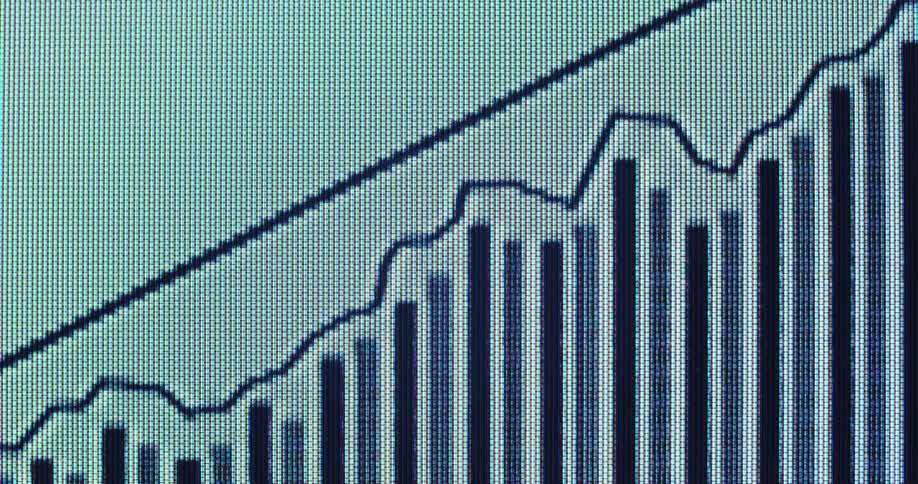
Futuristic macro close up of a retro digital CTR screen playing animated graph with a rising line chart and upward pointing arrow overlaying moving black bars representing stock market or business growth with financial success on white background
Closeup of a digital trading graph with fluctuating lines and bars on a screen
The video features a blurry fastmoving display of stock market tickers and financial data shown in red and greenfamiliar company symbols like aapl and msft flicker across the screen alongside fluctuating numbers and percentage changes
A line graph is on the computer monitor
Monetary values displayed on a dark digital financial interface
A stock market screen displays a sharp decline in a candlestick chart alongside a list of trading data
A graph of orange lines
An extreme close-up, pixelated view of a red financial graph with a downward arrow indicating a stock market crash and economic decline
Digital pixelated graph with positive trendline going up showing growth and financial strength of the global or US economy or an economical upward trend while making progress and profiting from business opportunities
A graph runs across the monitor
The numbers on the stock ticker are changing rapidly

Need help finding the
right footage?

Have it delivered to your account within 1 business day.

This is Filmsupply

Our StoryOur FilmmakersArticlesFilmsPopular SearchesAll Categories

FM

A family of brands dedicated to empowering the creative.

FILMSUPPLY

Footage licensing for productions

MUSICBED

Music licensing for filmmakers

STILLS

Image licensing for creatives

© 2026 FM LLC.

Privacy PolicyLicense TermsTerms & ConditionsCareers