Musicbed
Filmsupply
Stills
Contact Us(800) 805-6802
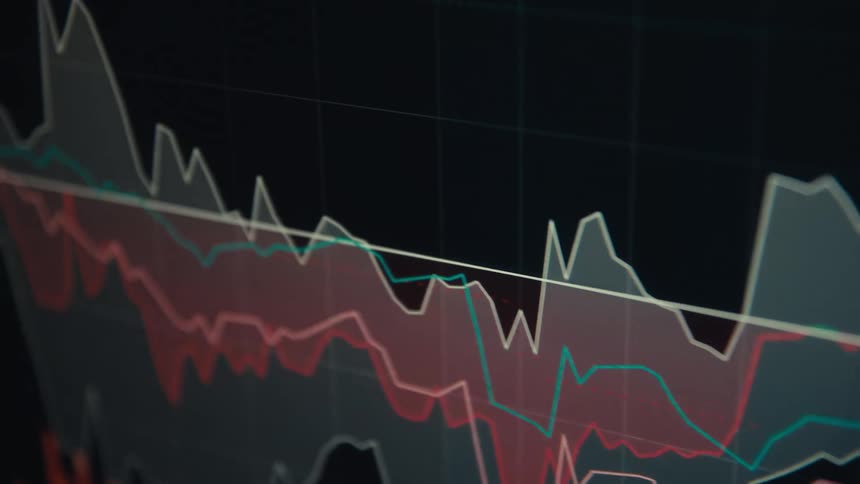
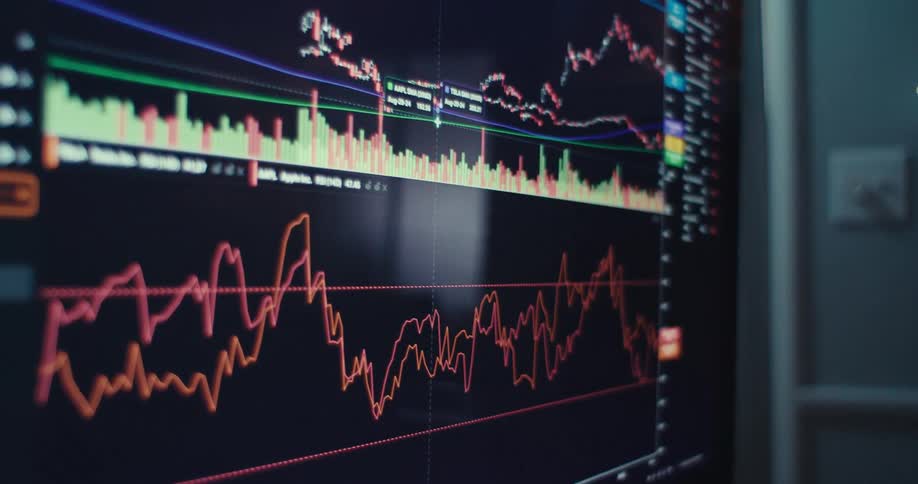
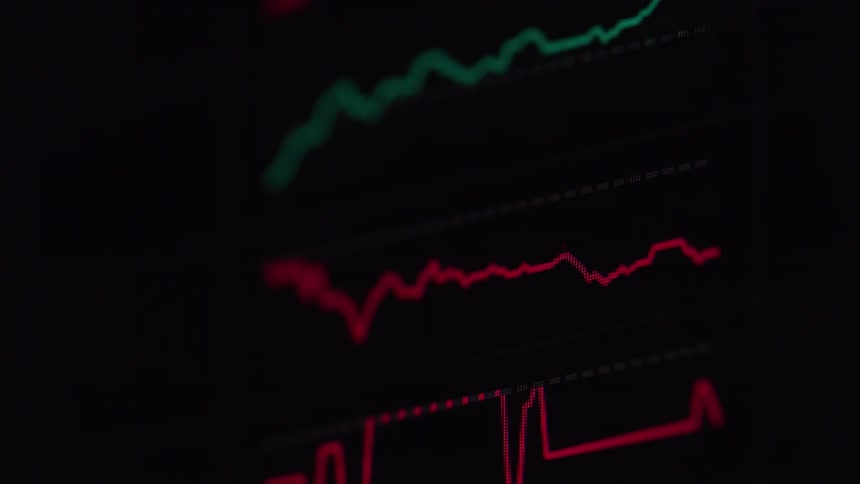
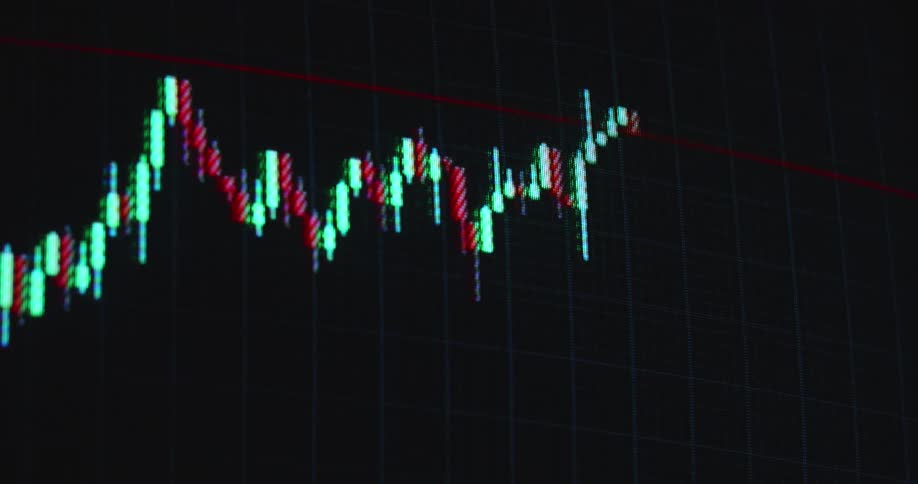
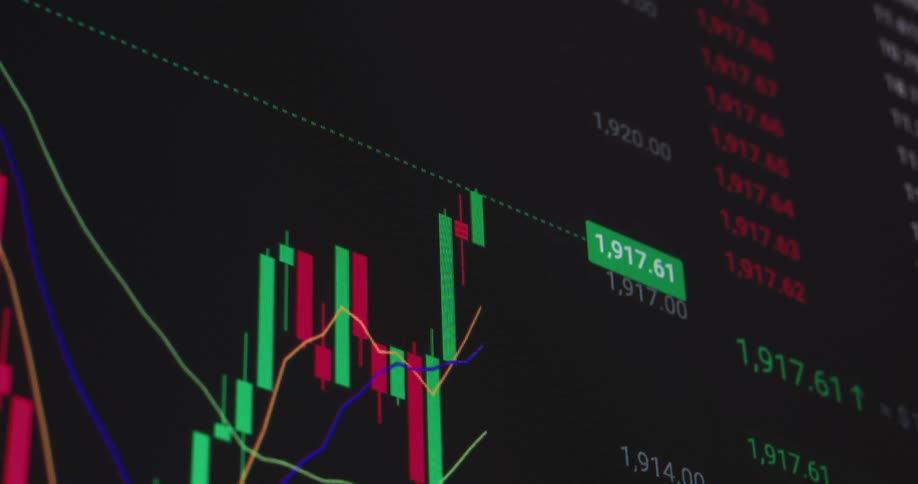
FilmmakersFather & SunFinancial data and animations screen macrosColored line graph displayed on a screen changes as the data values change
Colored line graph displayed on a screen changes as the data values change

Colored line graph displayed on a screen changes as the data values change

Filmmaker

Father & Sun

Clip ID

862725

Releases

Commercial Use, Editorial Use

00:08
 16:9

Select a license

Don’t see what you’re looking for? Just call us or email us and we can get the exact license you need.

Footage From The Same Shoot

View All

Similar Footage

A stylized, out-of-focus close-up of a digital stock market chart showing fluctuating data with glowing lines
Close up of device screen displaying a trading interface with candlesticks and indicators over a dark background
A computer screen displays fluctuating stock market charts and trading data
Stock related data is scrolled over on a screen
The financial markets get hit by a black swan event causing a massive crash or recession leading to a global economic crisis and great depression symbolized by a trading chart or graph that sharply falls into the red digits with dramatic downward movement
Numbers grow on the graph displayed
An out-of-focus close-up of a live stock market or cryptocurrency candlestick chart showing real-time price fluctuations
Screen displays pink and green graph lines on a grid
A close-up, out-of-focus animated financial chart shows fluctuating stock market data with glowing lines and candlestick patterns
An abstract, out-of-focus animation of a digital stock market chart shows fluctuating data and glowing trend lines
A blurred, close-up, and stylized animation of a digital stock market chart with glowing lines and fluctuating data
The video features a closeup cinematic shot of various financial data charts and candlestick graphs flickering across a digital screen it captures the fastpaced atmosphere of stock market trading through shifting focus and vibrant multicolored data v
Price variation chart with green and red lines showing financial values
Multiple rows of graphs and numbers quickly scroll by on a screen

Related Keywords

architecture
art
chart
computer hardware
electronics
hardware
monitor
oscilloscope
screen

Categories:

Animation & CGI Technology

Need help finding the
right footage?

Have it delivered to your account within 1 business day.

This is Filmsupply

Our StoryOur FilmmakersArticlesFilmsPopular SearchesAll Categories

FM

A family of brands dedicated to empowering the creative.

FILMSUPPLY

Footage licensing for productions

MUSICBED

Music licensing for filmmakers

STILLS

Image licensing for creatives

© 2026 FM LLC.

Privacy PolicyLicense TermsTerms & ConditionsCareers