Musicbed
Filmsupply
Stills
Contact Us(800) 805-6802
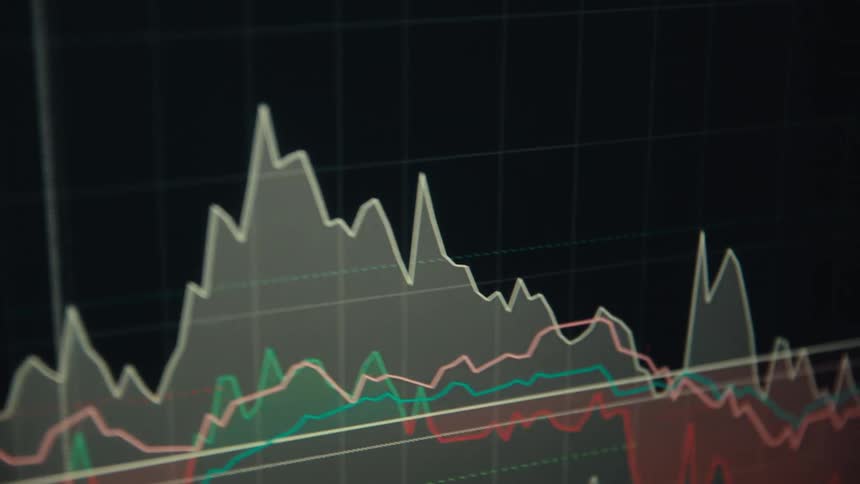
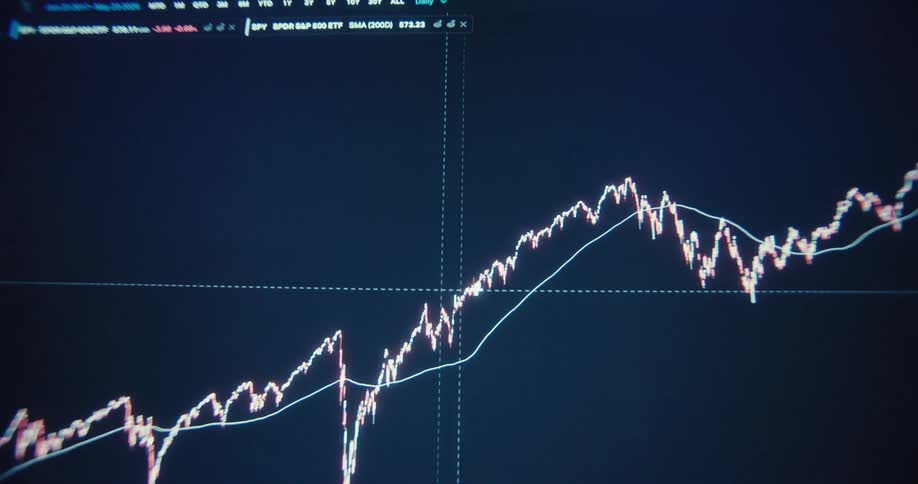
The primary visual is a dynamic jagged trend line that changes color and style throughout the clips in the initial shots it appears as a sharp white line tracing rapid price fluctuations later it shifts to a vibrant green glowing line that follows
Numbers of different colors flash on the screen
A close up of numbers and text on a scren
Dramatic macro view of data visualization or presentation showing a negative down trend with critical development as the digital graph or chart animation crashes symbolizing extreme volatility and economic decline and uncertainty
Graph of the value of a currency
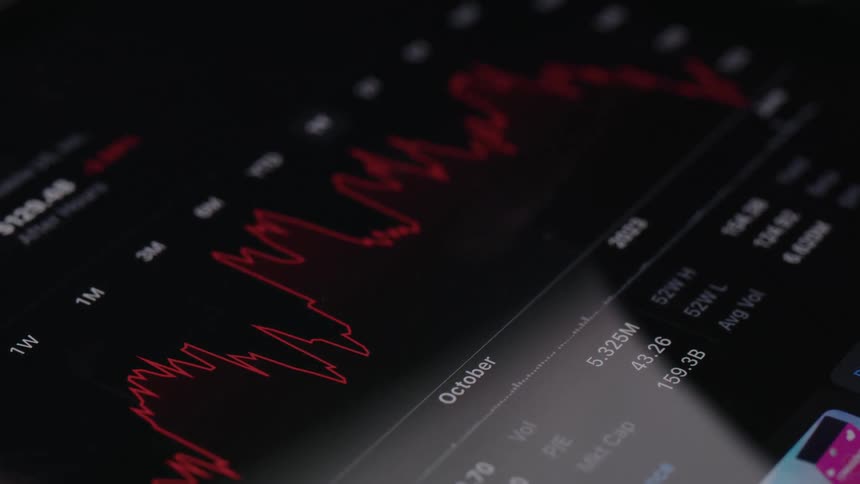
A blurry close-up of a digital financial graph shows a downward trend indicating a market crash or economic recession
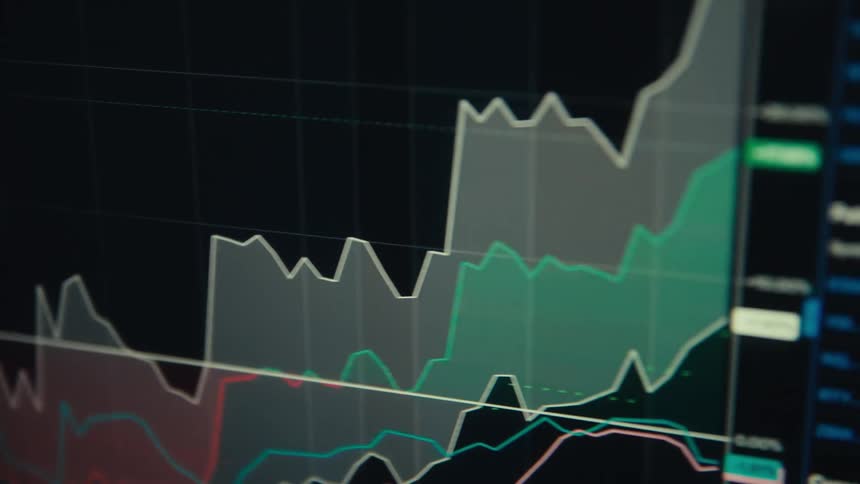
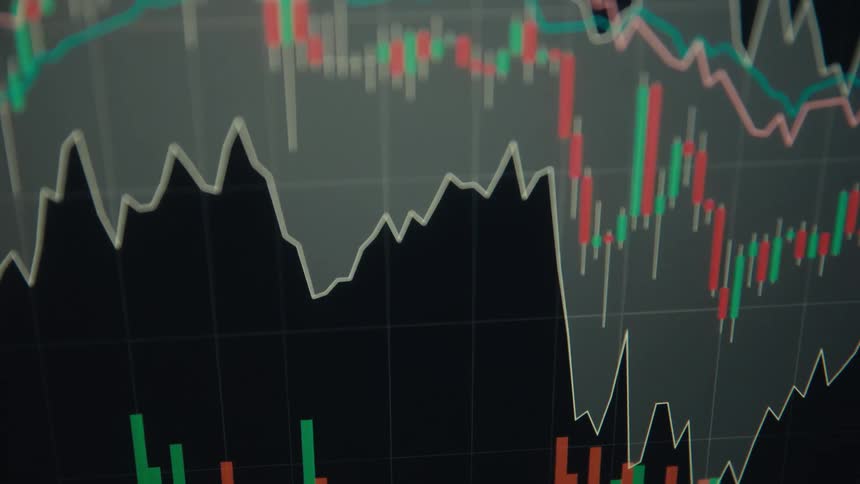
Multi line plot and a candlestick chart share a computer screen
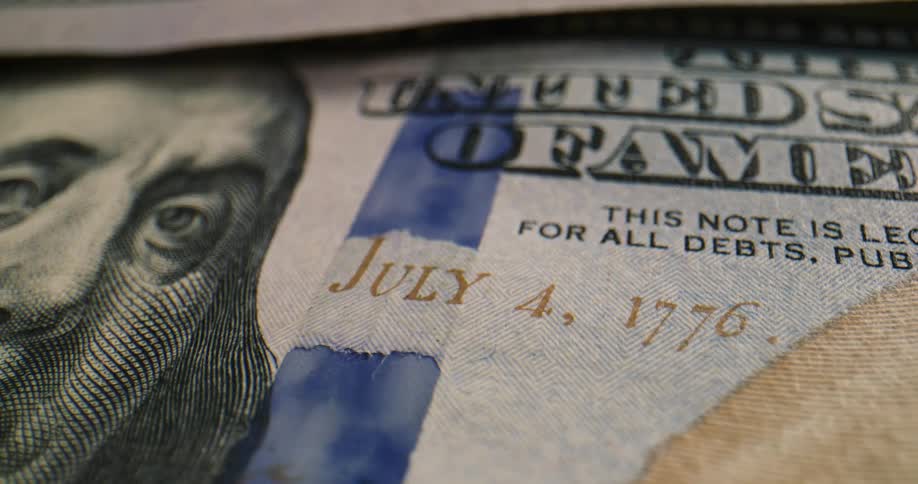
A united states one hundred dollar bill with blue security stripe and july 4th date
A blurry, abstract animation of a candlestick chart showing stock market or cryptocurrency volatility on a digital screen
The screen is covered in numbers
A person uses their tablet to check stocks
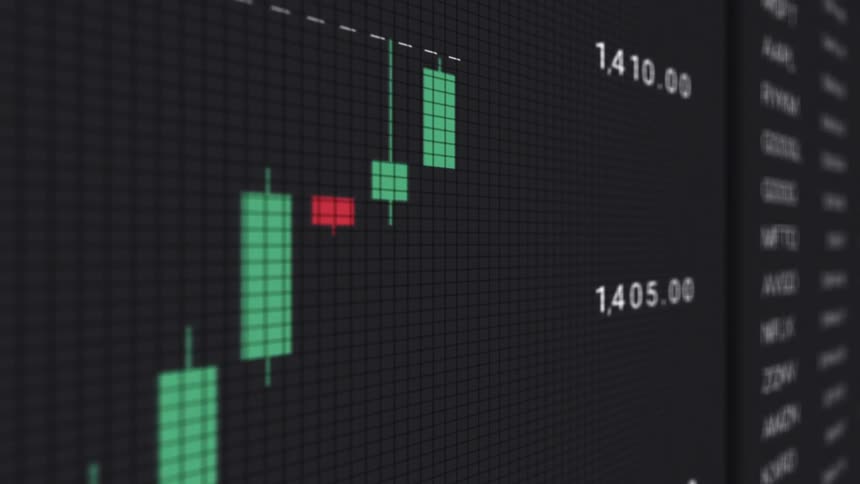
A monitor displays a stock market candlestick chart with green and red candles moving across a dark grid
Close up of device screen displaying a trading interface with candlesticks and indicators over a dark background
Extreme macro close up of green and red candles with long wicks of user interface of trading application show the price of a stock or crypto currency going down with a negative trend symbolizing volatility and price action or movement
Screen showing numbers scrolling and switching between red and green due to the stock market
A close-up of a digital stock market screen showing a 24-hour low price amidst fluctuating financial data
The screen of a computer monitor displays a scrolling list of cryptocurrency exchange rates and market data
Close up of the shiny engraved surface of golden bitcoin physical coins over a reflecting surface
An abstract, glowing line graph fluctuates over a blurred candlestick chart, visualizing the volatility of the financial stock market
A dense slightly blurred market leaderboard of tickers and redgreen figures fills the screen
A line graph is displayed on a monitor on the side of a building
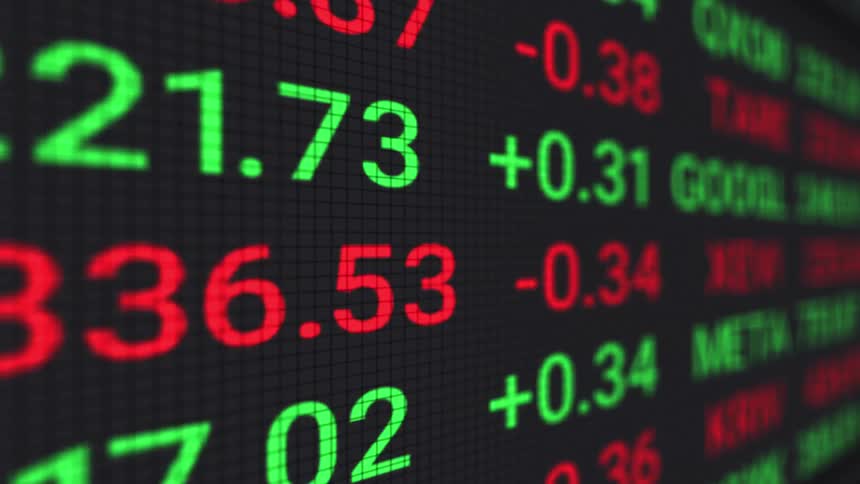
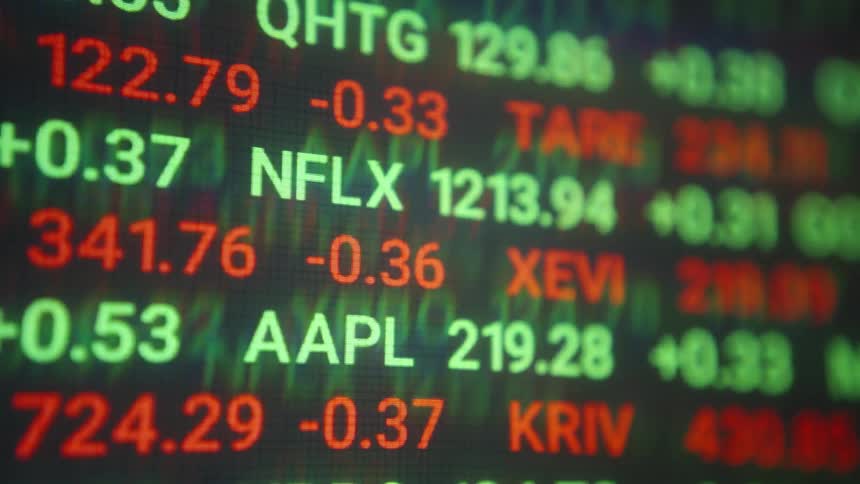
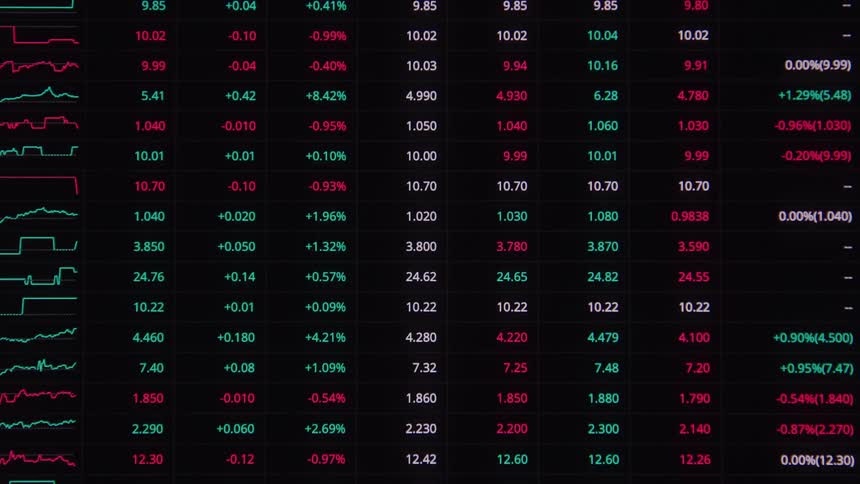
A dynamic shot of a digital stock ticker shows various company names and stock prices the tickers scroll across the screen with numbers and letters in either red or green to indicate a decrease or increase
Screen displaying green graph with numbers
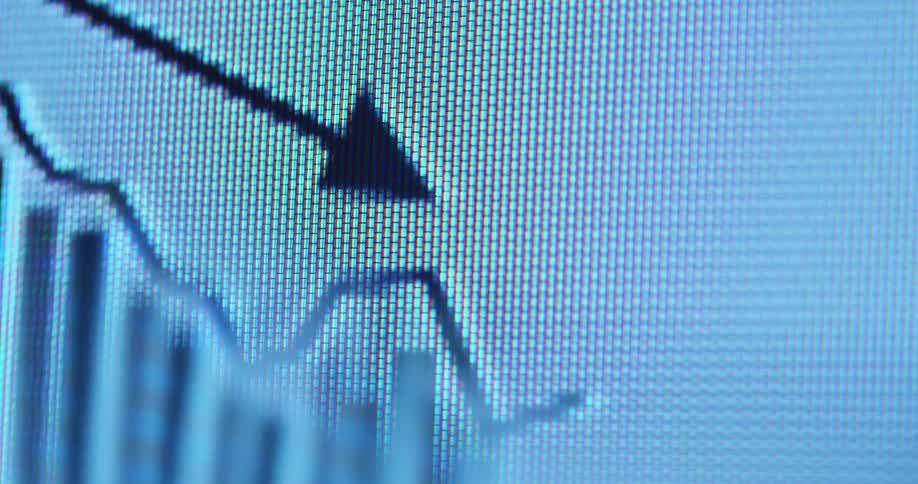
A macro view of a digital screen shows a black animated graph with a falling line chart and a downward pointing arrow overlaying vertical bar charts representing a market decline or financial loss on a white background
Computer monitor showing graphs of stocks available for trade
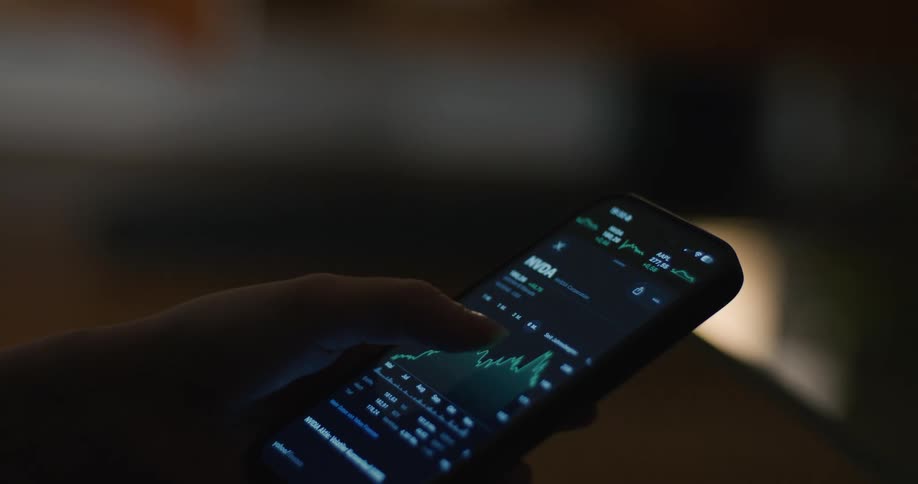
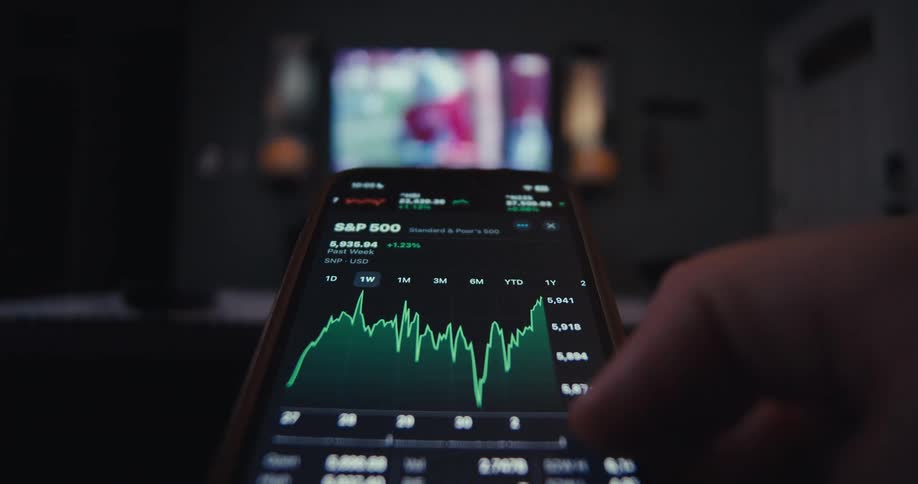
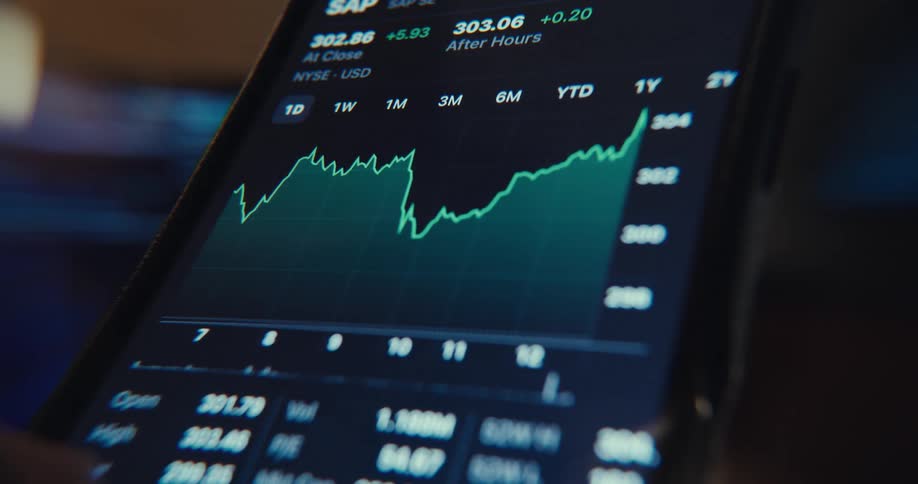
Hand holding a smartphone displaying a financial chart on a lit screen
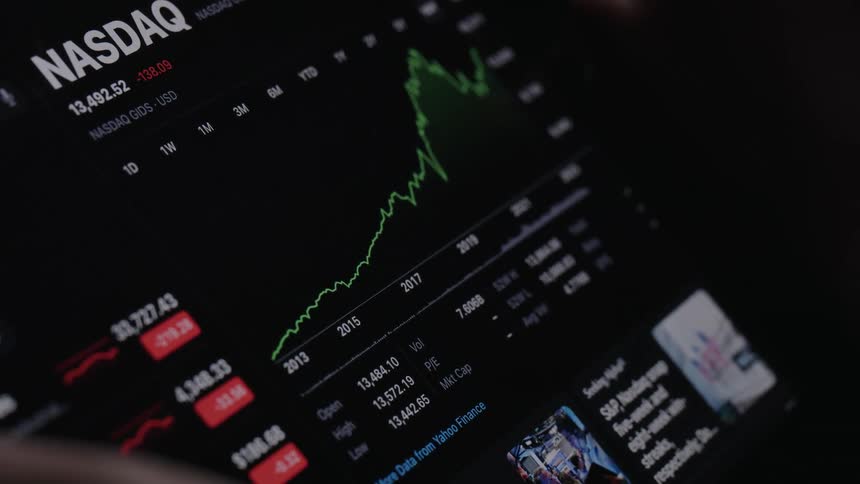
Closeup of a screen displaying a stock market chart
Closeup of a computer screen displaying realtime stock market charts and financial data
Swiping on the smartphone
Finger interacting with a smartphone screen displaying a stock market chart
A financial chart shows a volatile market trend with sharp rises and dips over time
Close up of a device screen displaying a scrolling trading interface
Stock numbers are rising and falling on the ticker
Dynamic dramatic macro footage with shaky movement of a stock trading chart or data graph animation moving upwards with a positive trend line indicating a stock market or crypto bull run and the increase in value of different assets
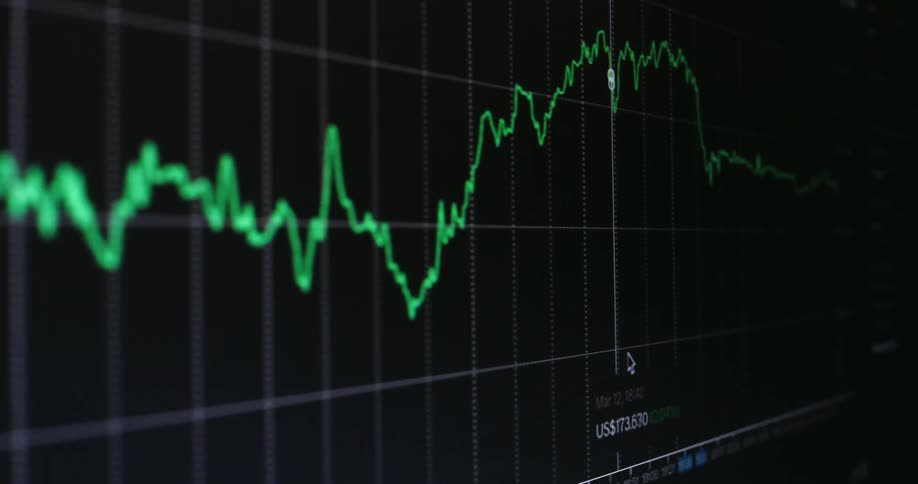
Green line displays digital information against a black background
A blurry, out-of-focus close-up of a digital stock market ticker with fluctuating numbers on a dark screen
Candlestick and line charts display variations on a financial panel
Artwork on american bank notes
Close up of an electronic device screen displaying a trading interface with live moving candlesticks
Thats a close up shot of a stock ticker or financial data display showing fluctuating numbers and possibly candlestick charts
Person working on a portable electronic device with a touch screen
Close up of a device screen as a person swipes through trading charts in a currency trading application
Falling financial market chart against a background of abstract numbers
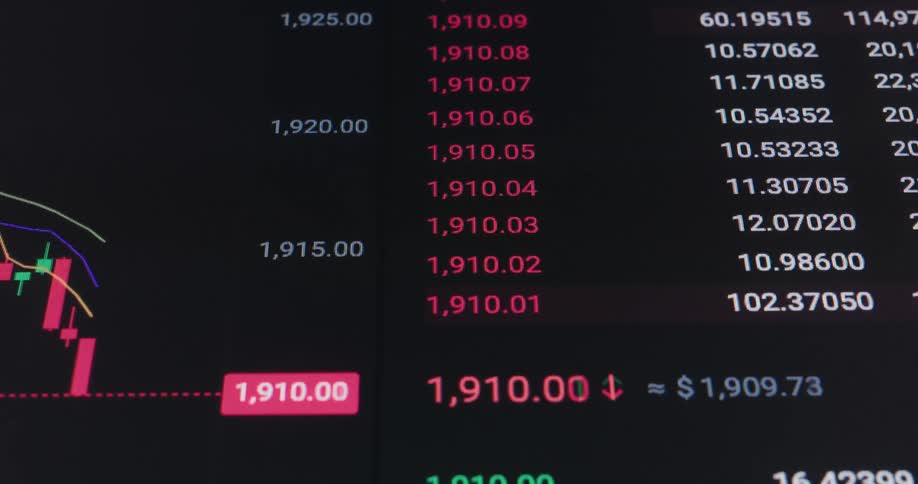
Red candlestick charts indicate sharp market downturn with fast price movement and negative development caused by stock or finance market crash and recession displayed on digital computer screen causing stress and panic while assets lose value
Numbers representing stock information change on the screen
A detailed, close-up view of a live financial candlestick chart showing market volatility with moving green and red bars
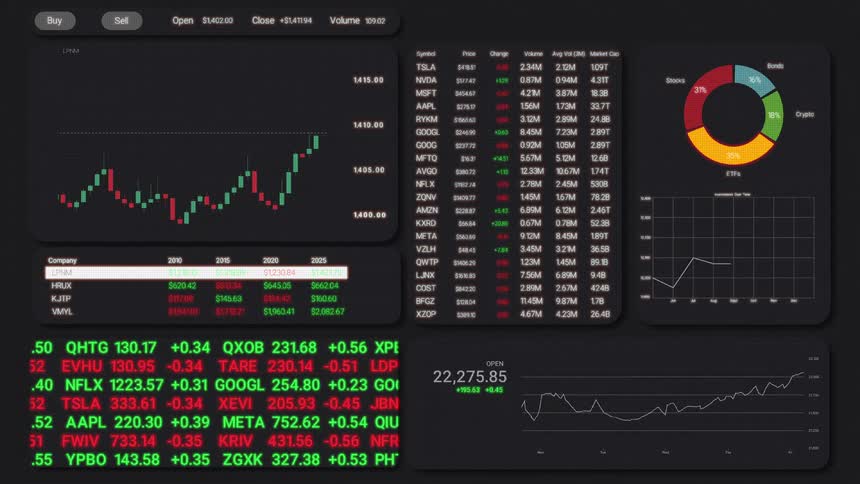
A digital dashboard displays various animated stock market tickers charts and graphs in a dark mode interface
A number of shiny coins with the bitcoin logo on them are piled on a very wet surface
An out-of-focus close-up of a live stock market or cryptocurrency candlestick chart showing real-time price fluctuations
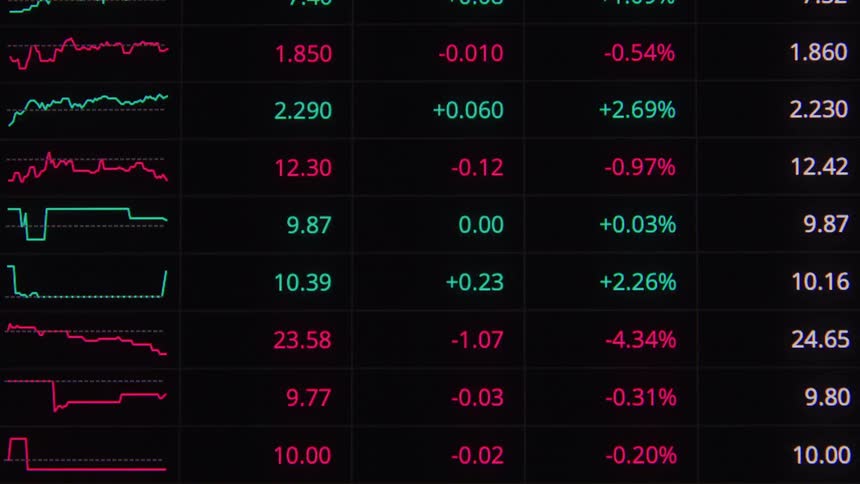
A digital screen shows rows of fluctuating stock market data
Green and orange colors of a candlestick chart contrast with the black background on a computer display
A digital display shows a continuous stream of stock market information with numbers changing in value and color
List of cryptocurrencies and dollar values displayed on a dark screen
Red falling trading chart of an online stock broker or crypto exchange in a downward trend during a bear market crash and financial crisis symbolizing failure bankruptcy insolvency and losses caused by declining international and global economy
A computer screen displaying the phrase what can i help you with as new words are being typed beneath it
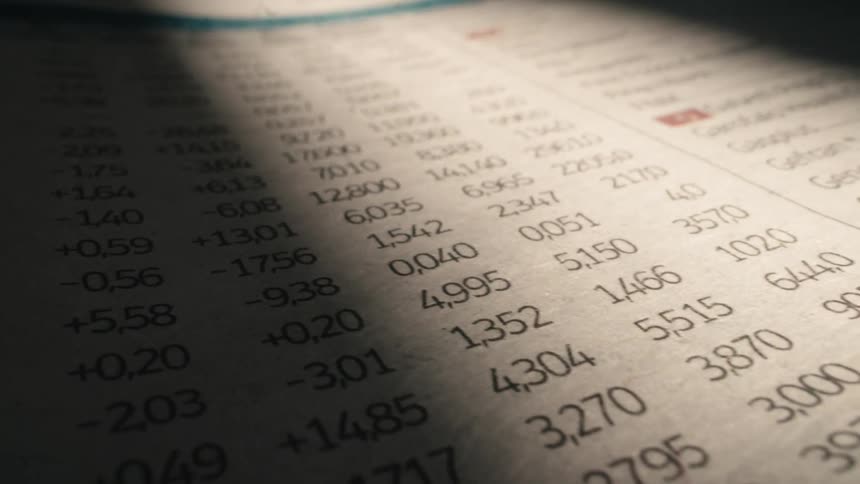
A beam of light scans across the stock market listings in a financial newspaper, highlighting the changing numbers
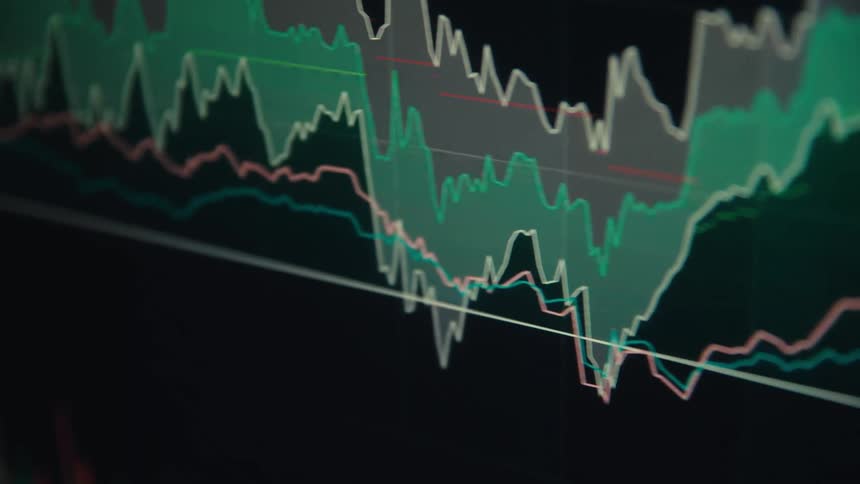
A closeup shot shows a digital screen displaying a financial graph with multiple colored lines representing different market trends the camera pans slowly from right to left revealing the volatile jagged movements of the lines as they shift up and dow
An extreme close-up of a digital display shows columns of rapidly changing financial or statistical data with visual glitches
A computer screen displays fluctuating stock market charts and trading data
A close up view of a computer screen displays fluctuating orange and red line graphs against a dark background
A close-up of a digital stock market chart shows fluctuating asset prices with candlestick patterns and changing numbers
Financial market candlestick chart displayed against a blurred background of buildings
Information is scrolling on the screen

Need help finding the
right footage?

Have it delivered to your account within 1 business day.

This is Filmsupply

Our StoryOur FilmmakersArticlesFilmsPopular SearchesAll Categories

FM

A family of brands dedicated to empowering the creative.

FILMSUPPLY

Footage licensing for productions

MUSICBED

Music licensing for filmmakers

STILLS

Image licensing for creatives

© 2026 FM LLC.

Privacy PolicyLicense TermsTerms & ConditionsCareers