Musicbed
Filmsupply
Stills
Contact Us(800) 805-6802
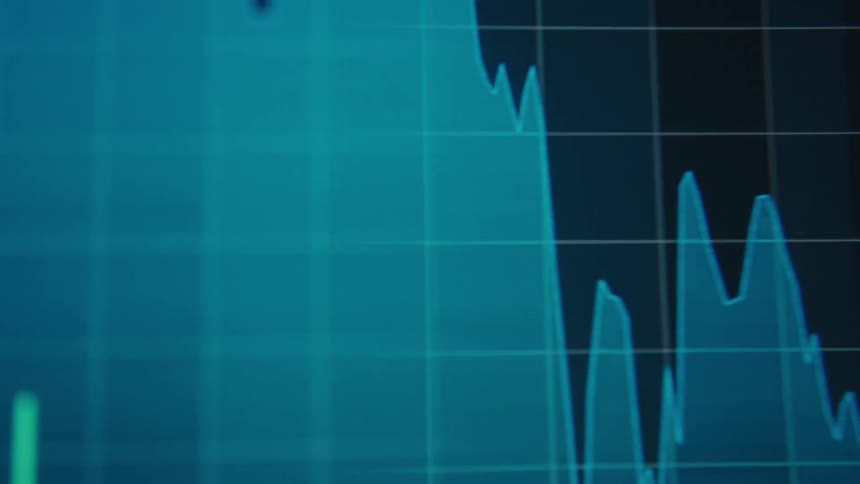
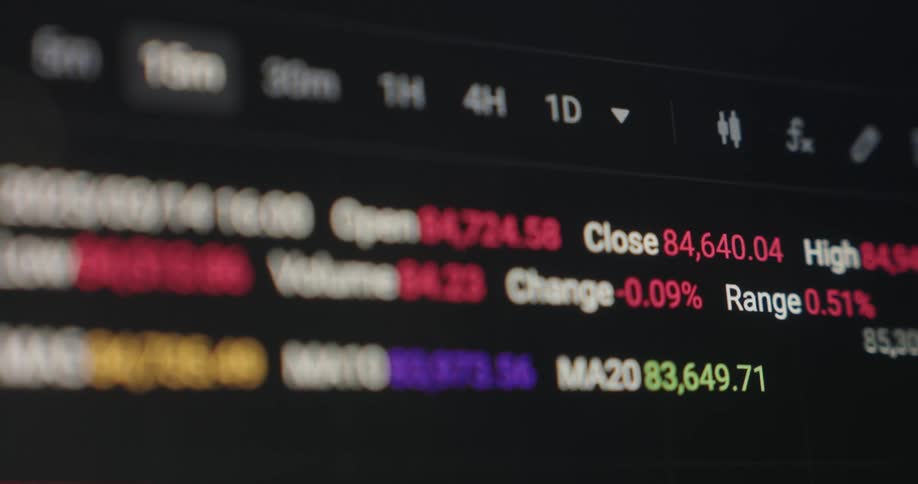
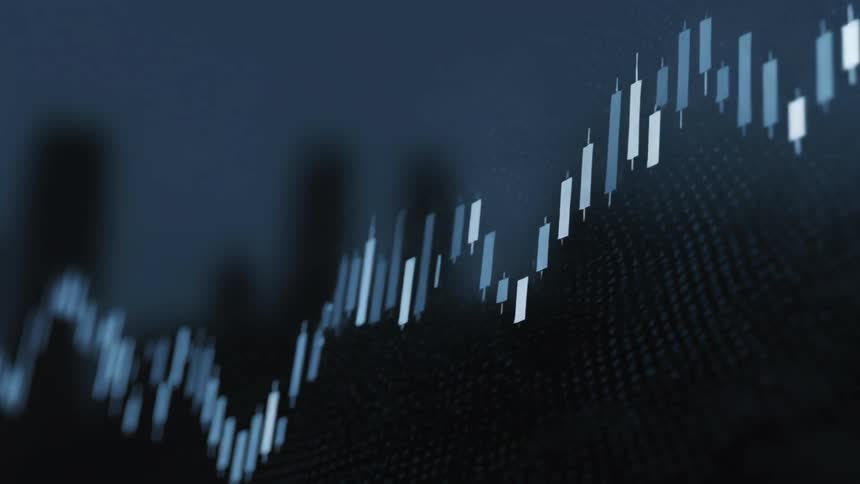
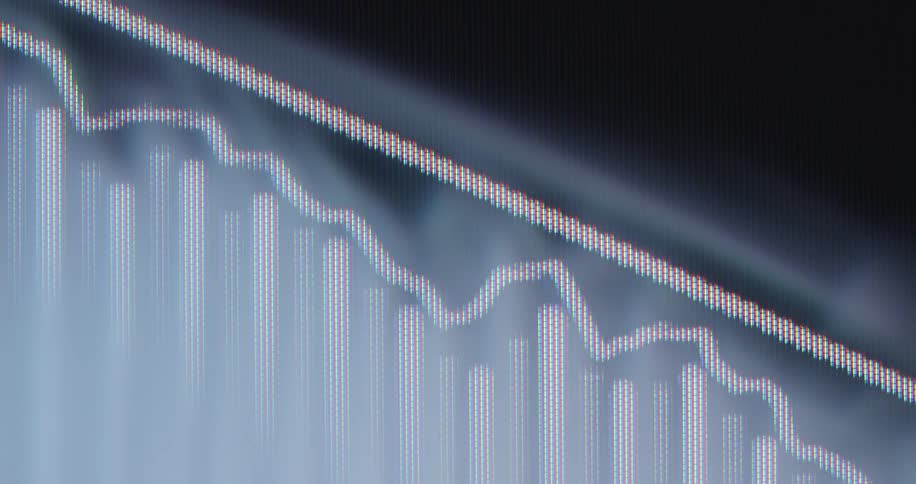
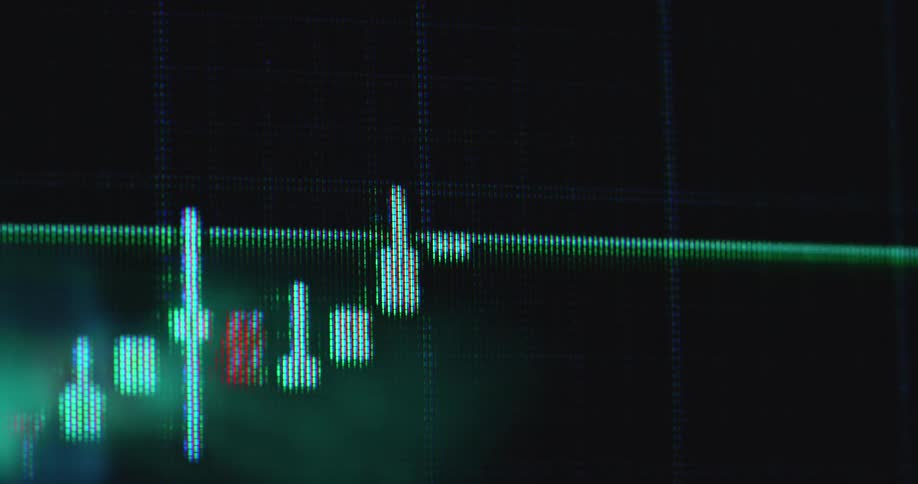
Closeup of a monitor displaying a financial market chart
Black and white shapes
A shot shows a graph on a screen with data lines moving up and down
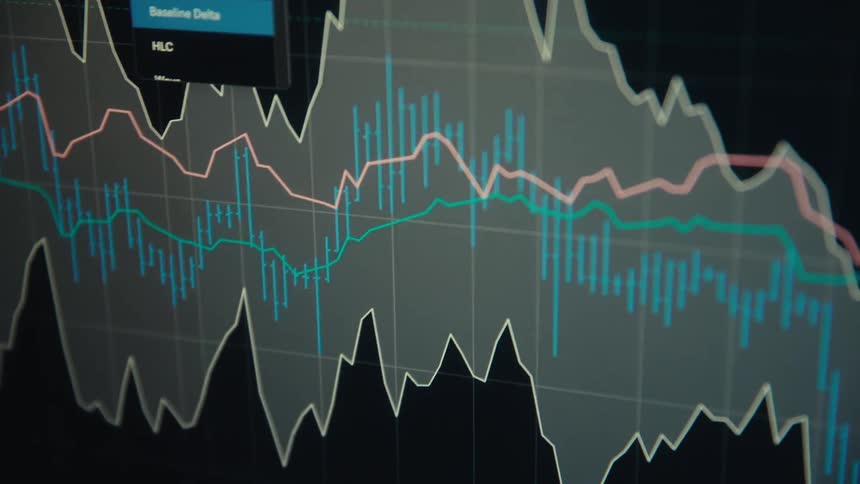
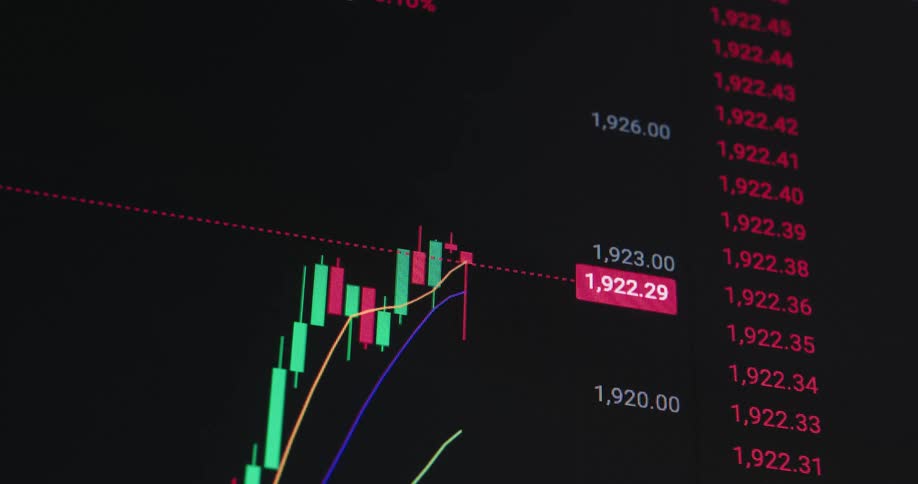
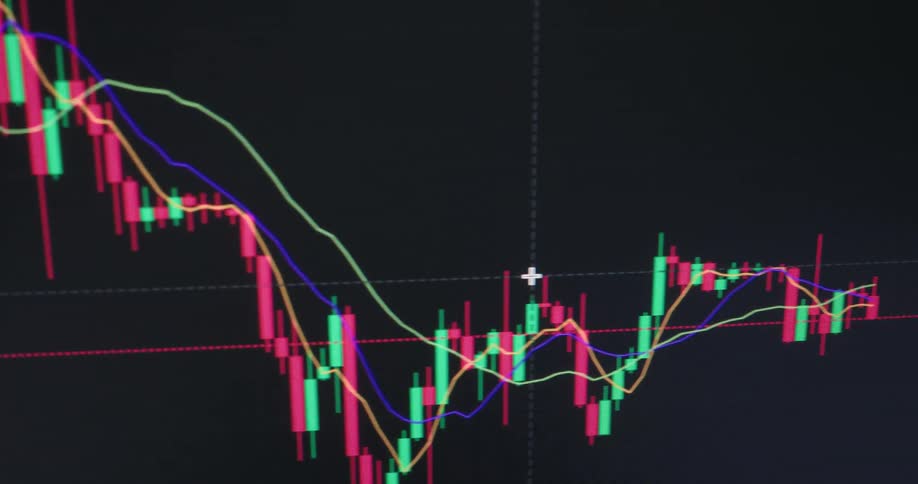
Multiple lines and a candlestick chart occupy the same graph on a digital screen as a selection is made
Candlestick chart against a gray background
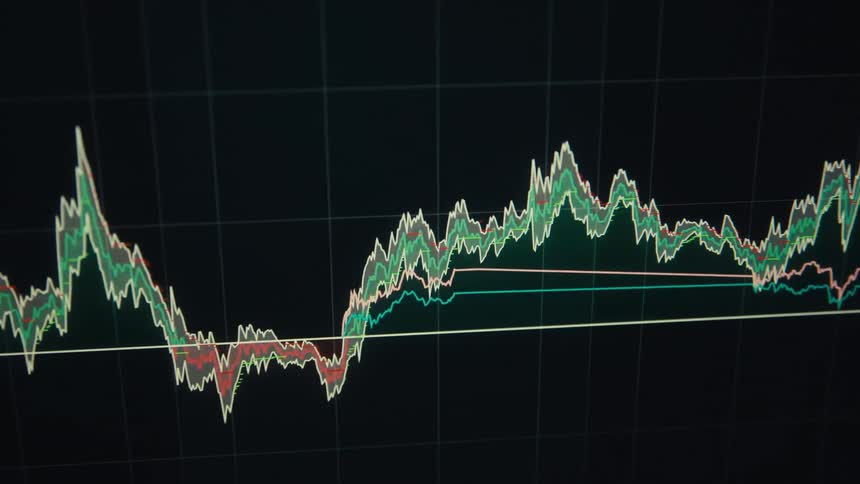
A screen shows a financial chart with green and orange bars moving up and down
Closeup shots of computer and laptop screens showing realtime stock market fluctuations
A candlestick chart or trading graph animation showing a stock price or crypto currency rising over time with exponential growth and a positive trend or development on a dark computer screen with RGB pixels as symbol for a growing shares or bond market
A footage of a trading chart screen
Red falling trading chart of an online stock broker or crypto exchange in a downward trend during a bear market crash and financial crisis symbolizing failure bankruptcy insolvency and losses caused by declining international and global economy
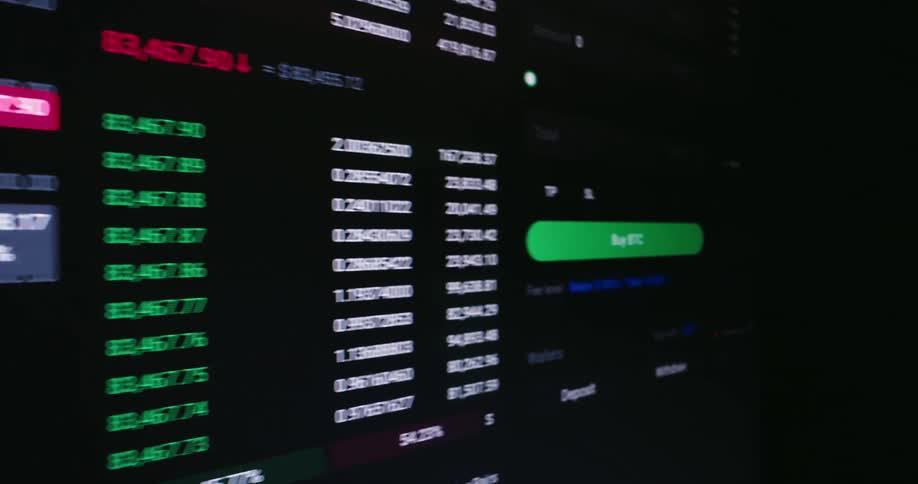
Digital table with market numbers and percentages in green and red
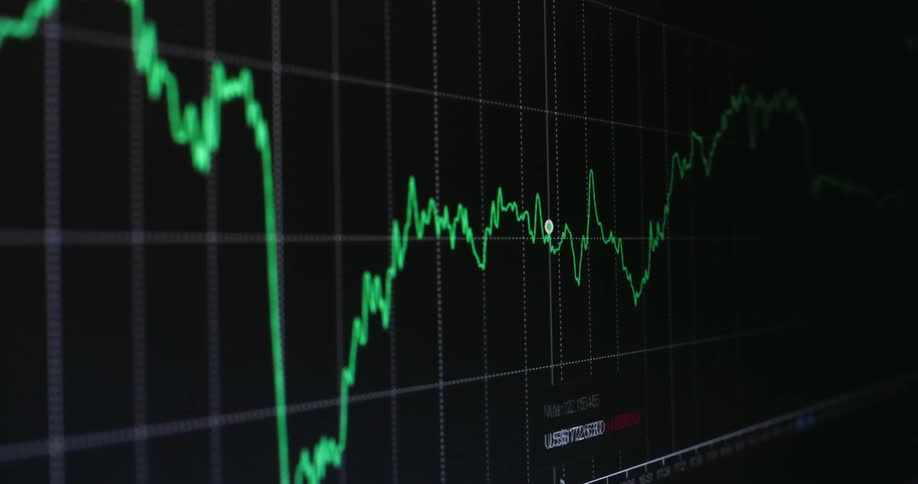
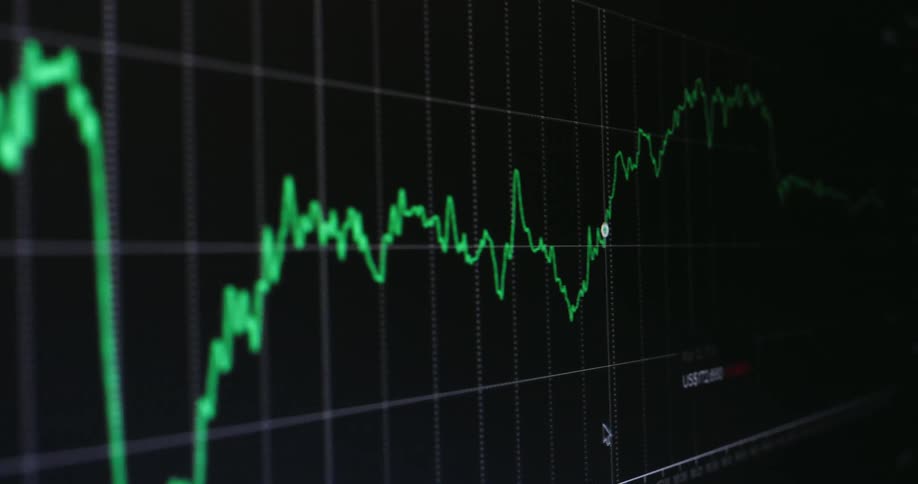
Graph of the price of a currency
A view of graphs and lines on a screen
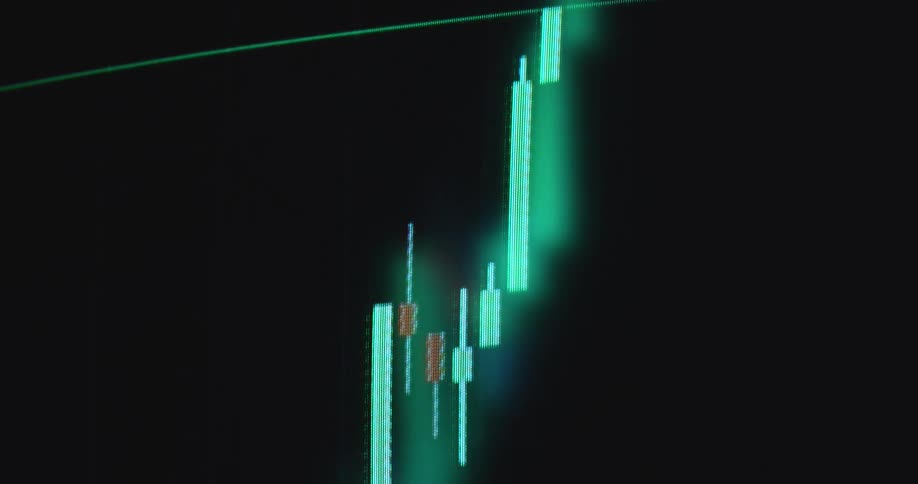
Retro Macintosh computer screen displaying financial market chart of an online trading platform or broker application for buying stocks or shares with bright neon green candles as the price goes up or increases with a positive trend
Handheld macro close-up of bullish financial market chart or candlestick trading graph on black screen displaying the UI of stock or crypto broker application or platform as the price surges and the value of the asset increases during investment bull run
Digital pixelated graph with positive trendline going up showing growth and financial strength of the global or US economy or an economical upward trend while making progress and profiting from business opportunities
The financial markets get hit by a black swan event causing a massive crash or recession leading to a global economic crisis and great depression symbolized by a trading chart or graph that sharply falls into the red digits with dramatic downward movement
Pixelated screen of a vintage 90s computer displaying a green graph with an arrow pointing upwards symbolizing the beginning of the digital financial era and the first online trading platforms for buying stocks in the internet
The numbers on the monitor change frequently
Colored line graph displayed on a screen changes as the data values change
Computer monitors are showing graphs and data
A computer monitor shows colorful graphs
Dramatic upward perspective of Bull Flag chart pattern as the green candles break resistance to the upside and the stock or crypto currency goes on price discovery with positive upward movement and trend displayed on monitor of a professional broker
Stylized financial chart with multicolored candlestick patterns
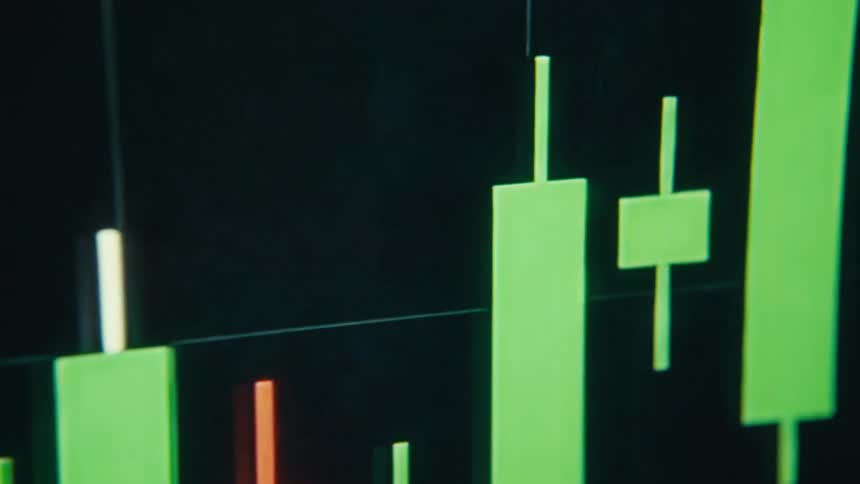
Extreme macro close up of green and red candles with long wicks of user interface of trading application show the price of a stock or crypto currency going down with a negative trend symbolizing volatility and price action or movement
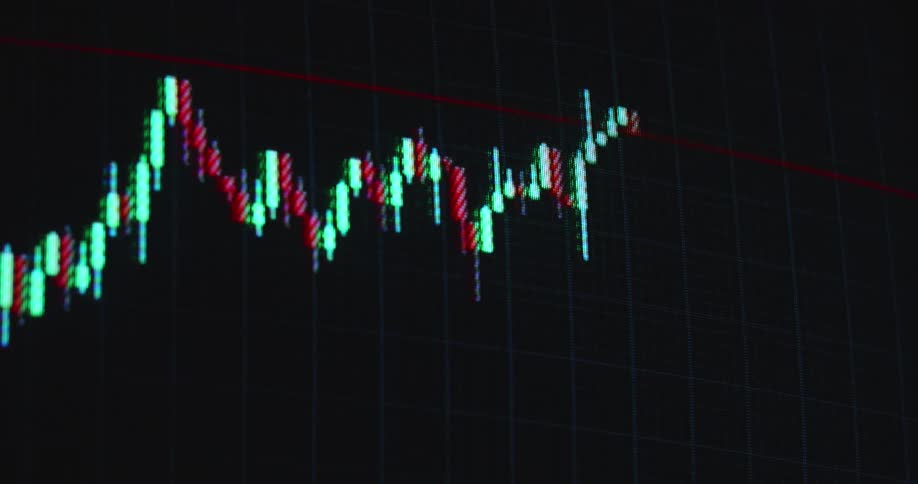
Trend line drawing red or green trading candles on monitor creating a candle stick chart pattern with upward tendency and great price development showing a successful trade with good performance and profit on black screen with grid
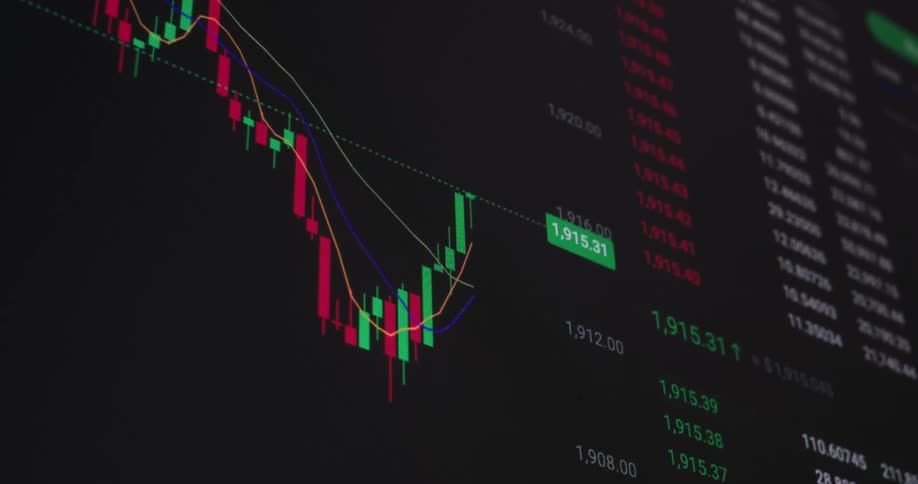
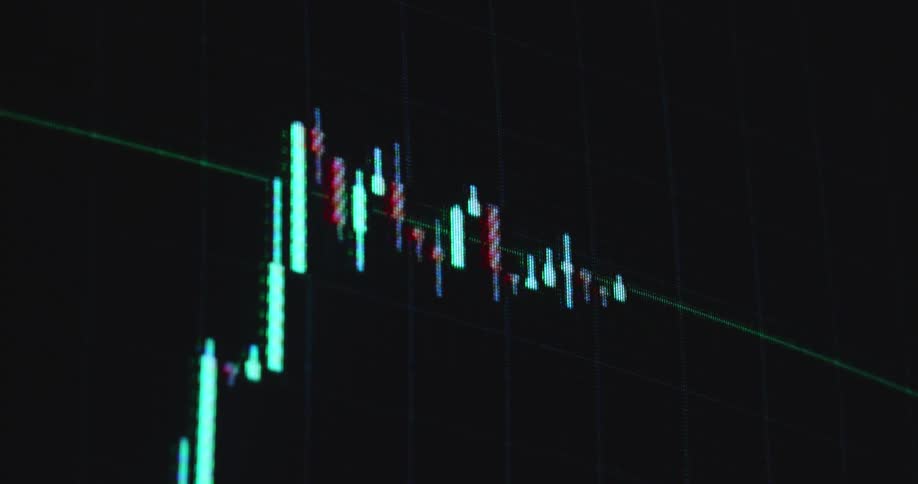
Pixelated candlestick chart on a screen or monitor panel forming a bullish flag pattern while the trading chart analysis shows that the graph is about to break resistance to the upside making the price of the stock or asset go up and increase in value
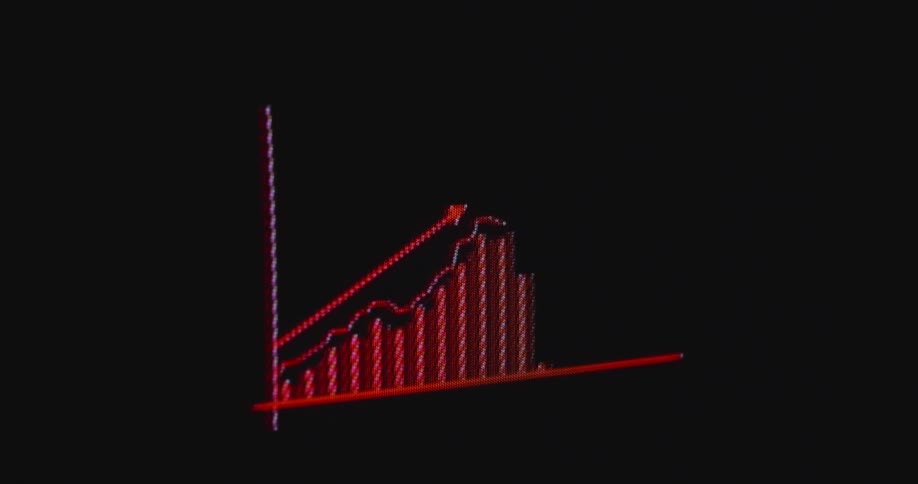
An animated red bar graph with a downward pointing arrow trends down, symbolizing economic recession
Line graph changes as the numbers in the data change on a digital screen
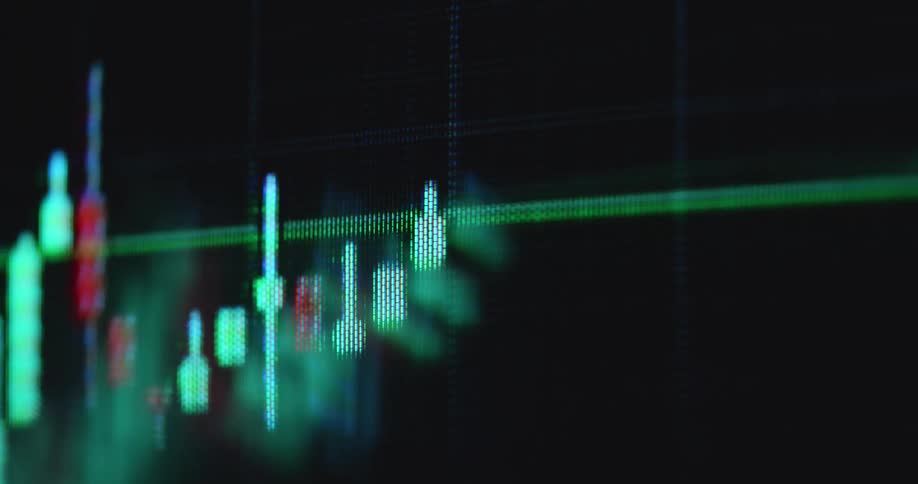
A close view of a glowing computer screen displays colorful digital stock market charts and data with motion blur and light leak effects across the frame
A bullish bull flag chart pattern is displayed on a dark monitor as the red and green candlestick candles form sideways consolidation before breaking resistance for a massive move to the upside with positive price development and profit in a bull run
Extreme close-up macro shot of a blue financial bar graph on a computer screen with a white arrow indicating a downward trend
The candlestick trading chart or graph steadily rises with a positive upward tendency and trend showing the price development of the MSCI World or S&P 500 or another ETF as a store of value and protection against inflation
Multi line plot and a candlestick chart share a computer screen
Close up of an electronic screen displaying a trading interface with blue candlesticks against a dark background
The bar graph goes up and down across the entire computer screen
Looking up onto retro computer screen or monitor displaying a trading chart candlestick animation consisting of long green candles as the price increases and the broker or trader makes a successful trade with lots of profit and the stock reaches new ATH
A digital screen showing stock market price chart
Extreme close-up of a declining financial chart on a digital screen with a downward-pointing arrow indicating a market recession
A close up of numbers and charts on a screen
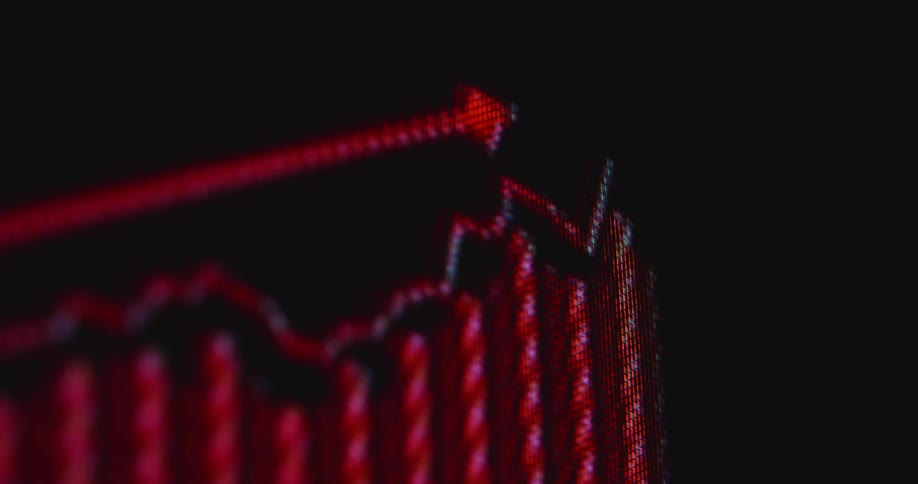
Wide angle shot of a pc screen that displays a red chart with an arrow rising from left to right while prices increase and the inflation rate keeps going up while the economy is fearing a recession as the fiat money system collapses
Graph of the value of a currency
Pixelated macro close-up of a digital screen showing the user interface of an online trading platform or finance app or broker application displaying a candlestick chart or graph with green candles as the price increases and goes up with a positive trend
Charts of currencies rising and falling
A neon green retro monitor displays a chart showing the movement of a stock price with an arrow crashing with a dramatic downward or negative tendency or direction causing investors to lose money presented by data visualization
The graphs change on the computer display
A digital chart with a downward-pointing arrow slowly pans across a screen, symbolizing economic decline
A chart showing the change in stock prices
A neon green coloured sales chart or finance trading graph showing a downward trend symbolising a financial meltdown or a market crash or collapse caused by economic uncertainties and fear of global recession
Closeup of a screen displaying a fluctuating line graph
Dynamic macro footage with shaky hand-held camera movement of green and red candles of candlestick chart pattern with upward movement on a glowing financial trading graph with positive price development on dark screen or monitor
The pixelated computer screen shows the financial market reacting to a black swan event such as 9/11 causing a global economic crisis and crash followed by recession and great depression as the stock market collapses
A macro close-up of a digital stock market graph showing a bearish trend with a declining arrow indicating a financial crisis
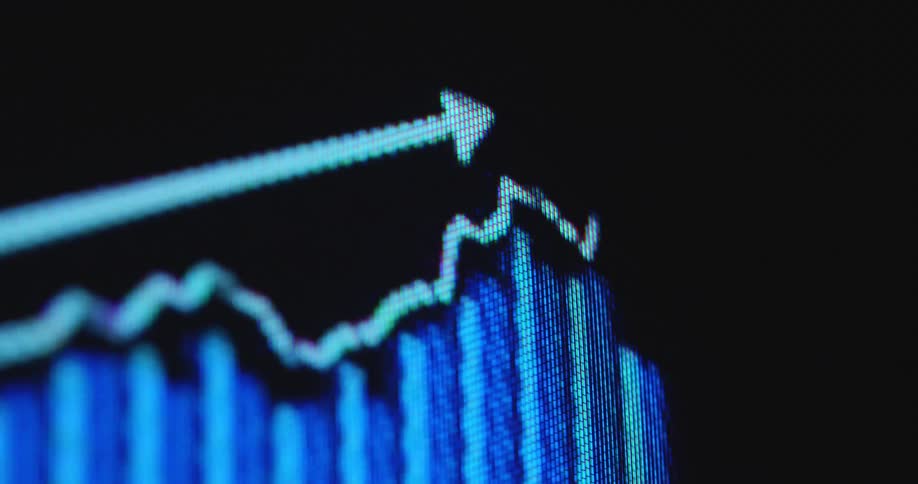
A macro shot of a blue bar graph on a computer screen with a white arrow indicating an upward trend of growth and success
A vibrant green digital graph displays fluctuating diagram consisting of lines and vertical bars with a prominent downward arrow indicating a decline of the Wall Street stock market or global economy with negative price development
Pixelated computer screen displays a red graph with statistical data showing the increasing inflation rate as prices for everyday goods and living costs in the US rise with a very high CPI or consumer price index causing financial problems
A pixelated smartphone or display device screen or monitor shows the user interface of a finance app or online broker and trading platform for buying and selling stocks and crypto currencies such as Bitcoin or ETH as the trading chart moves up
Macro close-up of a digital screen showing a declining blue bar graph with a downward pointing arrow, symbolizing a financial market crash or economic downturn
A bullish candlestick chart pattern moves on the computer monitor with visible pixels as the bull flag breaks resistance to the upside causing massive surge and gain for investors and traders trading stocks and crypto currency coins or tokens online
Handheld macro shot with dynamic camera movement of stock or crypto currency trading candlestick chart going up before crashing due to unexpected black swan event causing recession and economic depression on screen with grid and red candles
Black swan event hits global economy or financial markets causing crash crisis or meltdown and stocks and shares or other investments collapse into red digits or figures causing panic and massive losses followed by economic recession and bear market
Pixelated computer screen showing animated data in red trend line graph with negative downward movement symbolizing the stock market crash from 1987 or any other financial crisis causing a meltdown of the global economy
Dramatic macro shot of pixelated computer monitor showing a trading chart or financial graph crashing as the global economy is hit by a recession causing great depression and panic sales at the financial markets

Need help finding the
right footage?

Have it delivered to your account within 1 business day.

This is Filmsupply

Our StoryOur FilmmakersArticlesFilmsPopular SearchesAll Categories

FM

A family of brands dedicated to empowering the creative.

FILMSUPPLY

Footage licensing for productions

MUSICBED

Music licensing for filmmakers

STILLS

Image licensing for creatives

© 2026 FM LLC.

Privacy PolicyLicense TermsTerms & ConditionsCareers