Musicbed
Filmsupply
Stills
Contact Us(800) 805-6802
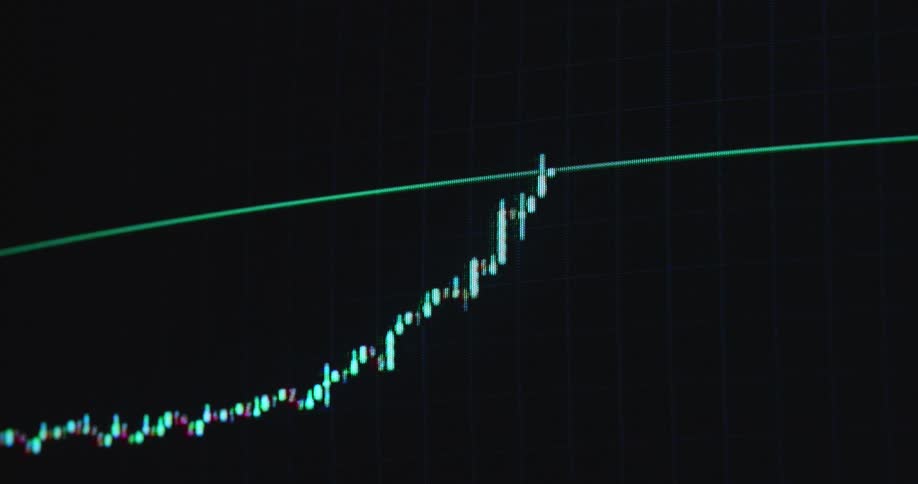
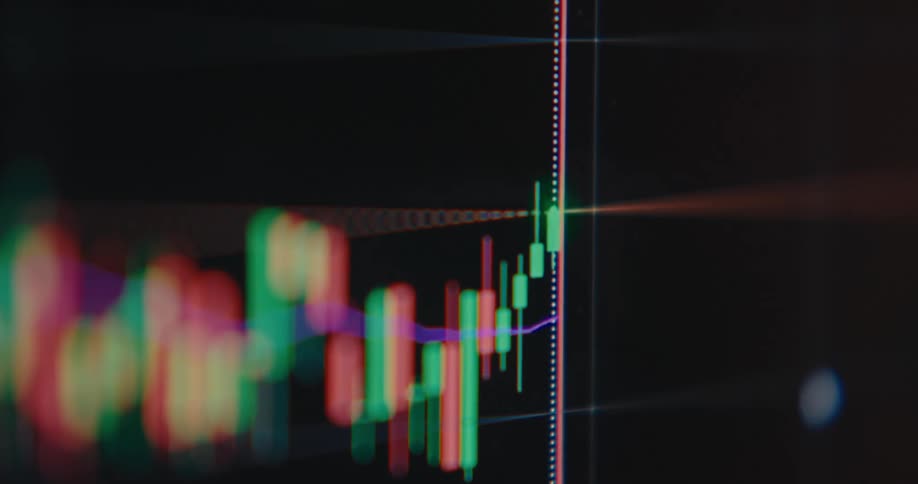
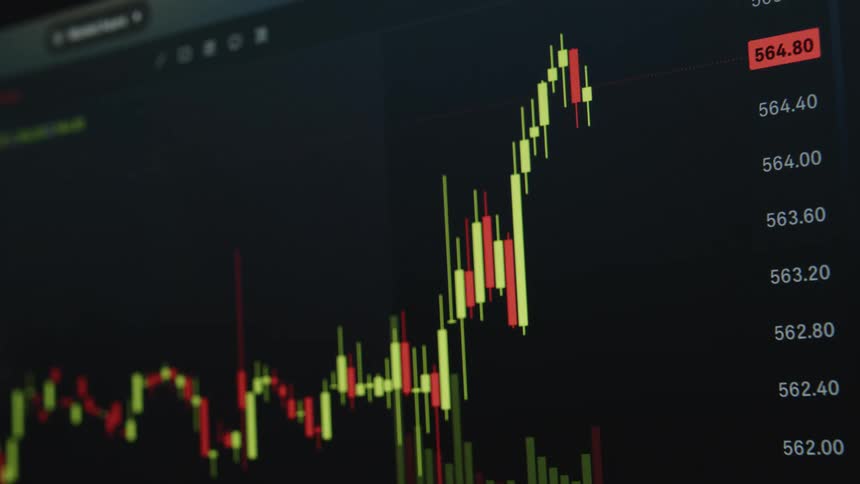
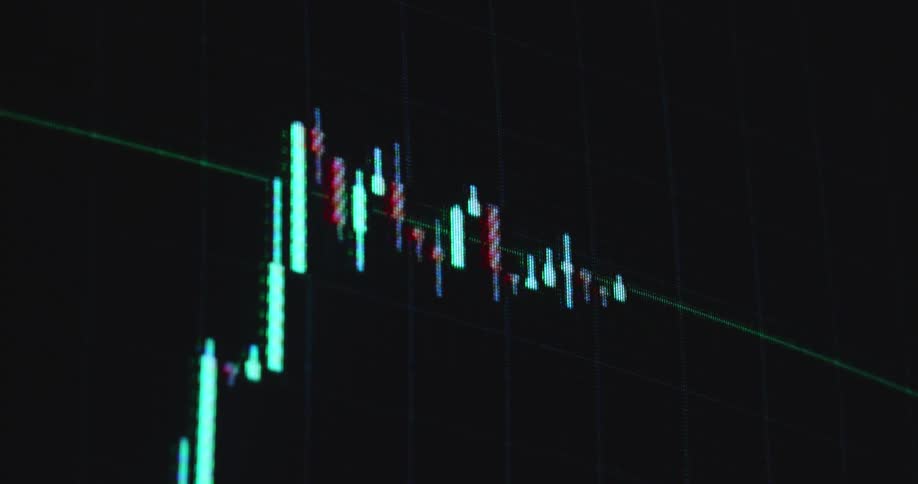
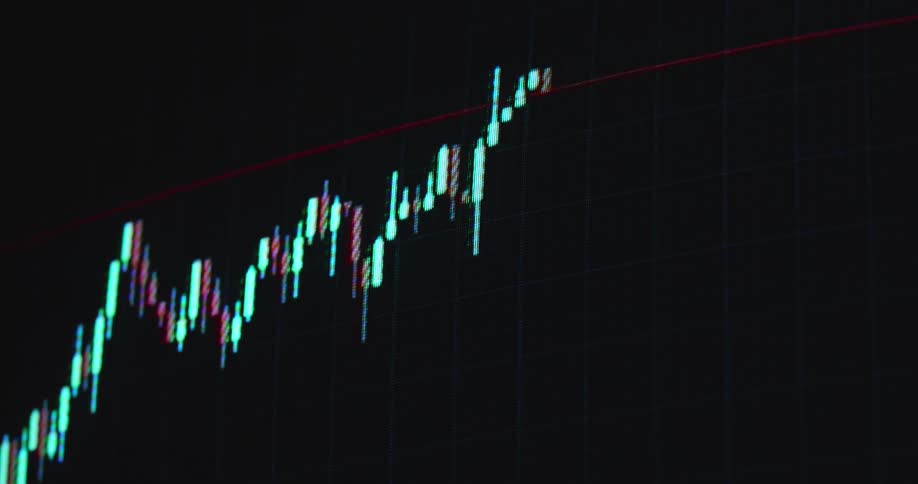
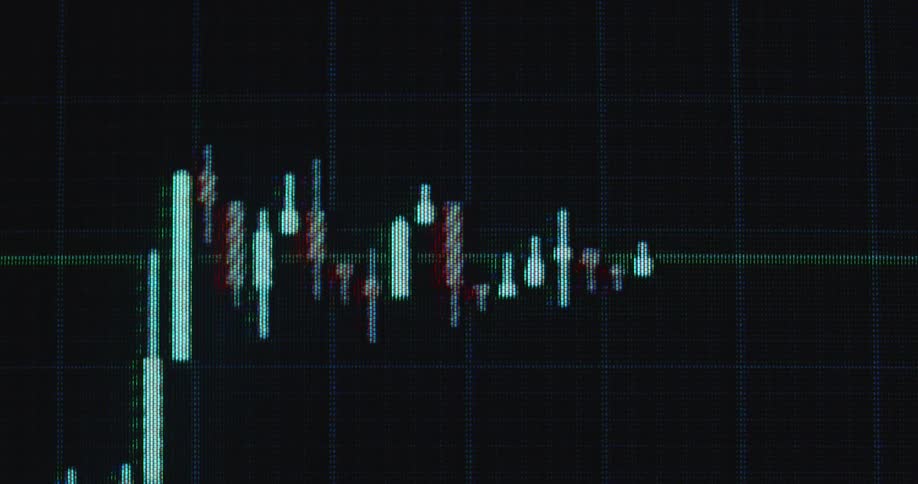
A candlestick chart or trading graph animation showing a stock price or crypto currency rising over time with exponential growth and a positive trend or development on a dark computer screen with RGB pixels as symbol for a growing shares or bond market
A cryptocurrency graph is on the monitor
Computer monitors are showing graphs and data
A number of shiny coins with the bitcoin logo on them are piled on a wet surface
An abstract digital overlay highlights the fluctuating prices of various cryptocurrencies like Bitcoin and Ethereum on a trading exchange platform
A shallow depth of field close-up captures a vibrant, fluctuating candlestick chart on a digital financial trading screen
A pile of gold coins on a reflective surface
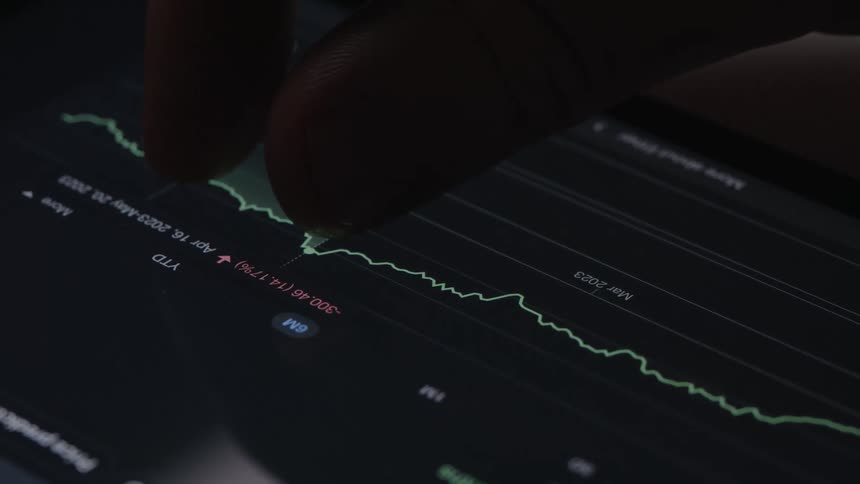
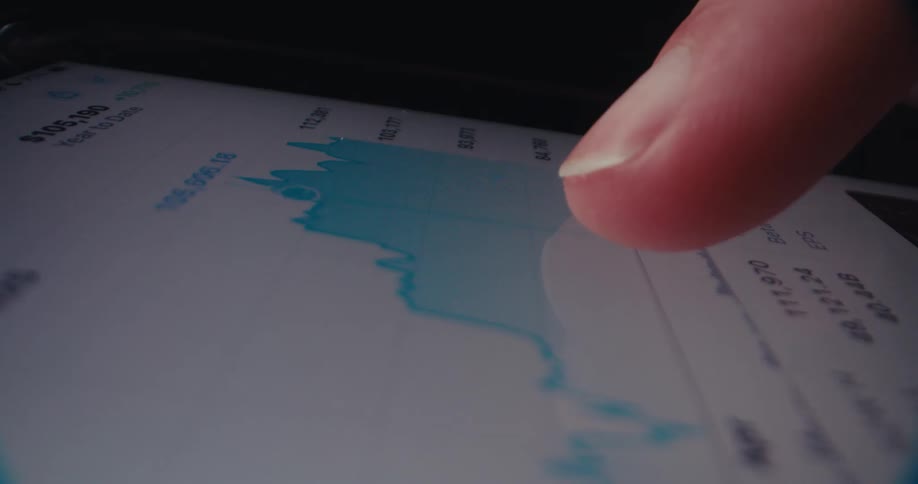
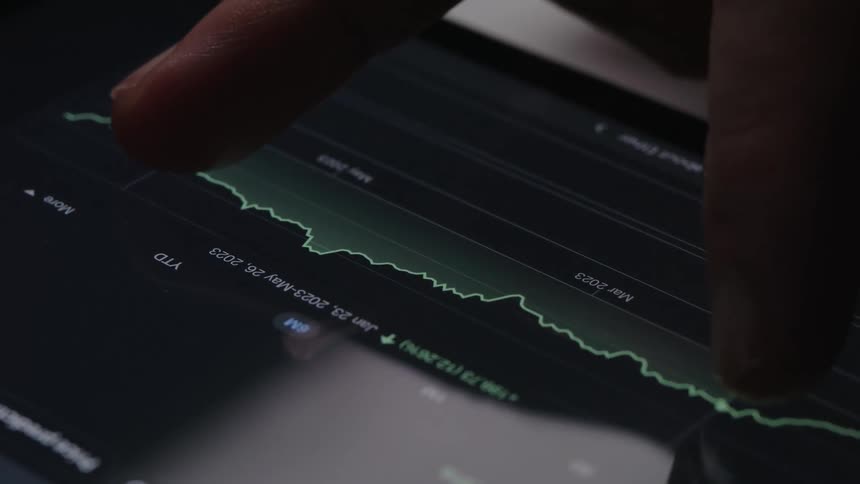
Person touching a tablet screen with their fingers to check stock prices
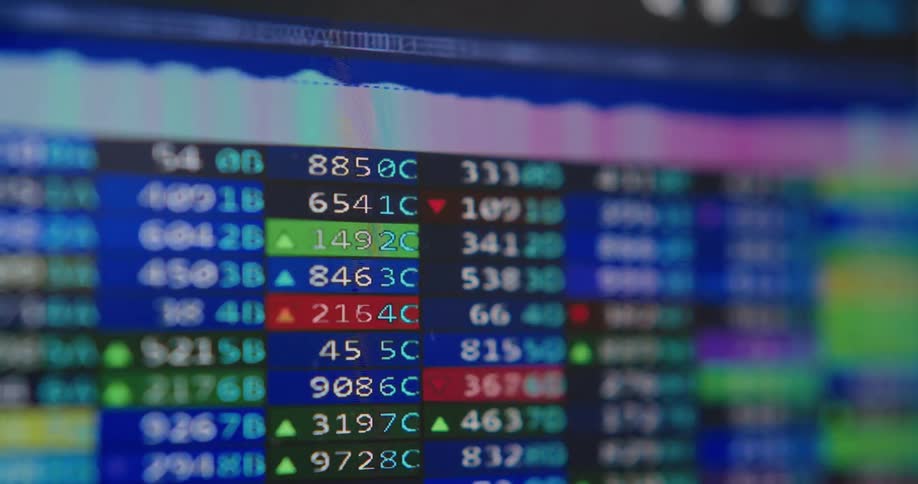
A close-up shot of a digital stock market ticker with fluctuating prices and changing colors indicating market trends
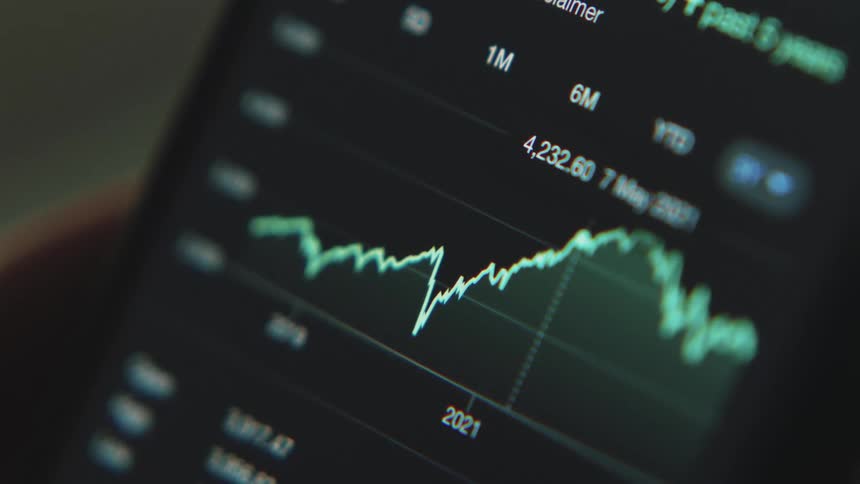
The screen is full of line graphs
A graph speeding through the evolution in price of a stock over several years
A finger moves a dot along a graph
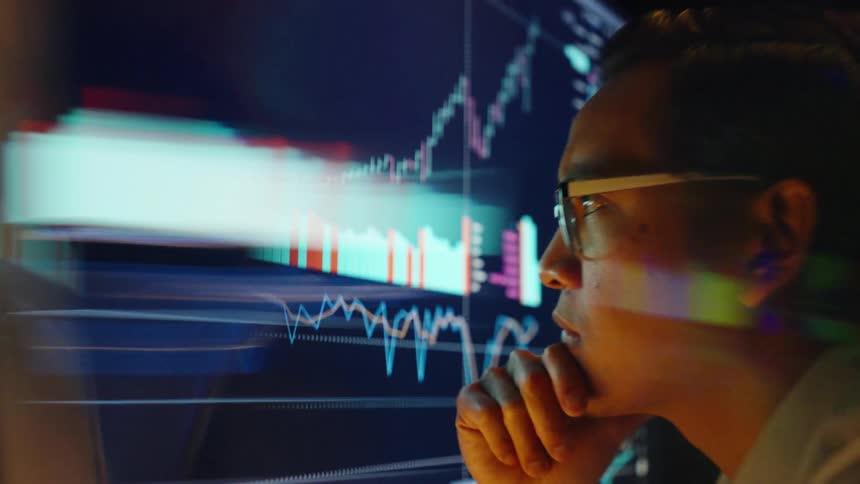
Man wearing glasses observes financial charts on a screen with his hand on his chin
A blurry, out-of-focus close-up of a digital stock market ticker with fluctuating numbers on a dark screen
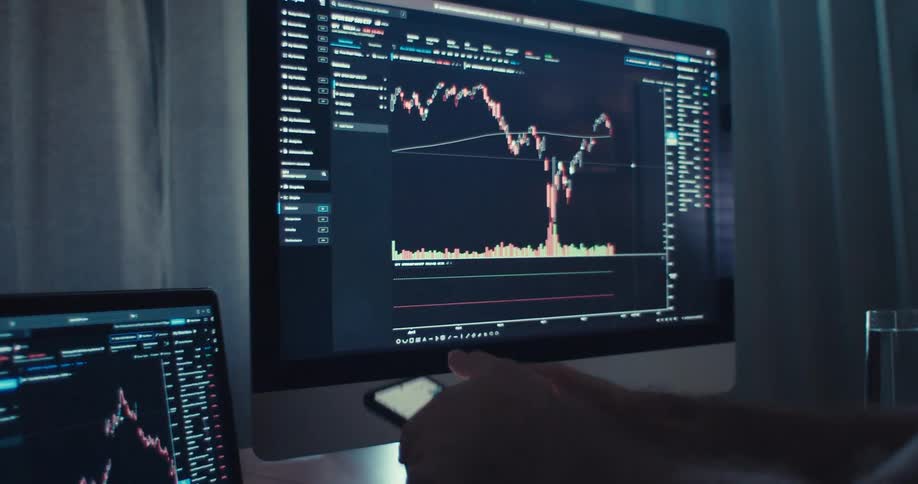
A persons hand holds a smartphone displaying financial data in front of two computer screens also showing stock charts
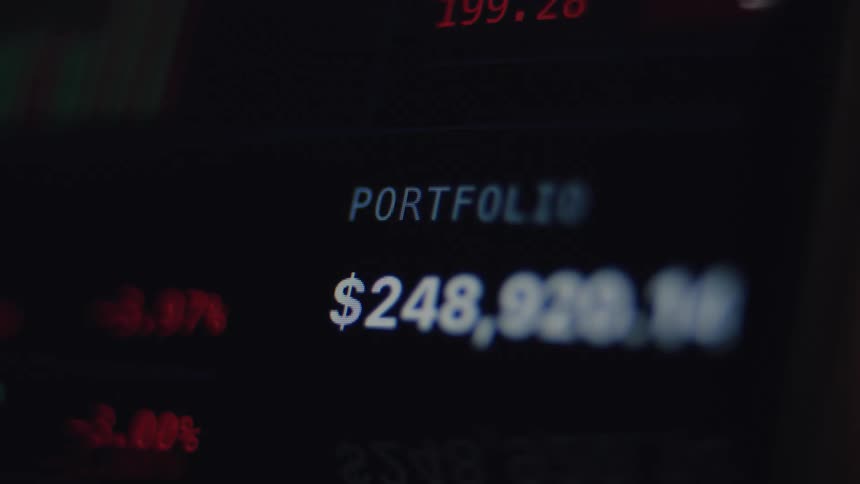
Close-up of a digital stock market screen displaying a portfolio's value with fluctuating red and green numbers
The person runs the stylus over the tablet
Blue and red candlestick chart of financial market
A person is pressing a graph on their tablet
A stock market screen displays a sharp decline in a candlestick chart alongside a list of trading data
A close view shows blurry digital graphs and stock market data with red and green bars moving quickly across a dark screen
Screen displaying bearish financial market graph as candlestick chart crashes while stock and crypto currency markets decline and assets lose their value due to drastically decreasing and falling prices causing panic sales and recession with volatility
Crypto information scrolls on the screen
Smartphone resting on a glass surface with a financial application open on the screen
A rapid closeup pan sweeps across a digital trading screen showcasing glowing teal and red bar graphs alongside fluctuating data lines that are softened by heavy motion blur and vibrant light streaks as the interface updates
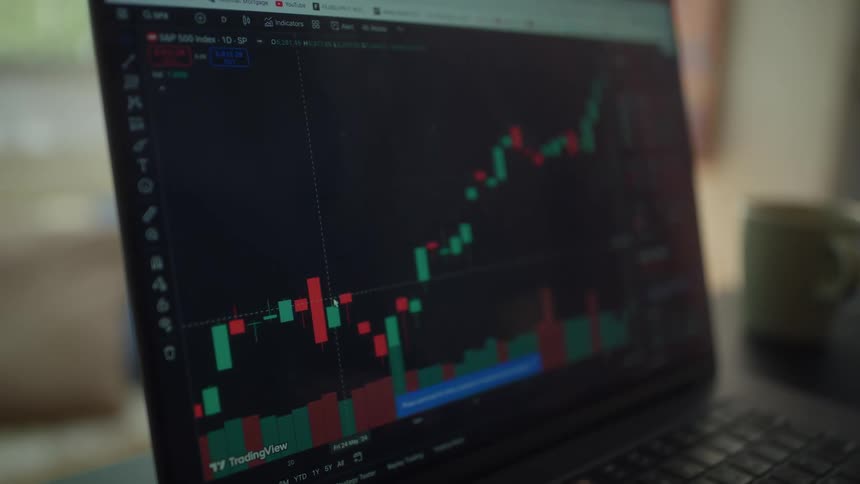
Person sits at a table at home and uses a computer displaying a graph related to trading
Screen displays pink and green graph lines on a grid
Text on a laptop screen
A binary options chart showing rising and falling movements
Bar on a graphof financial data grows and shrinks
Dramatic upward perspective of Bull Flag chart pattern as the green candles break resistance to the upside and the stock or crypto currency goes on price discovery with positive upward movement and trend displayed on monitor of a professional broker
Close up of a flickering digital screen showing a constantly updating stock market ticker with shallow depth of field
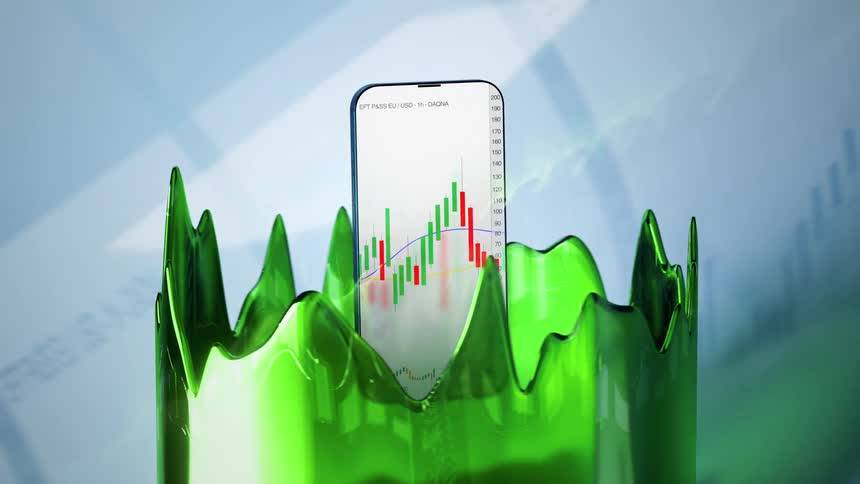
A phone stands in a wall of slime
A cinematic, out-of-focus macro shot of a real-time stock market candlestick chart on a digital screen
A blurred, close-up, and stylized animation of a digital stock market chart with glowing lines and fluctuating data
A close view of a glowing computer screen displays colorful digital stock market charts and data with motion blur and light leak effects across the frame
The graphs change on the computer display
A digital screen displays a volatile stock quickly crashing in value before the market closes
A closeup view of a trading screen highlighting bitcoin btc prices and trends
A woman sits at a desk in an office and uses an laptop
A colorful, stylized animation of a financial candlestick chart displays market volatility on a digital grid
Bright neon green bars or candles of a candlestick chart pattern or financial graph on computer display screen with dark background and positive price development symbolizing successful stock trading with upward trend and handheld camera movement
Logo with candlestick
Person working on a portable electronic device with a touch screen
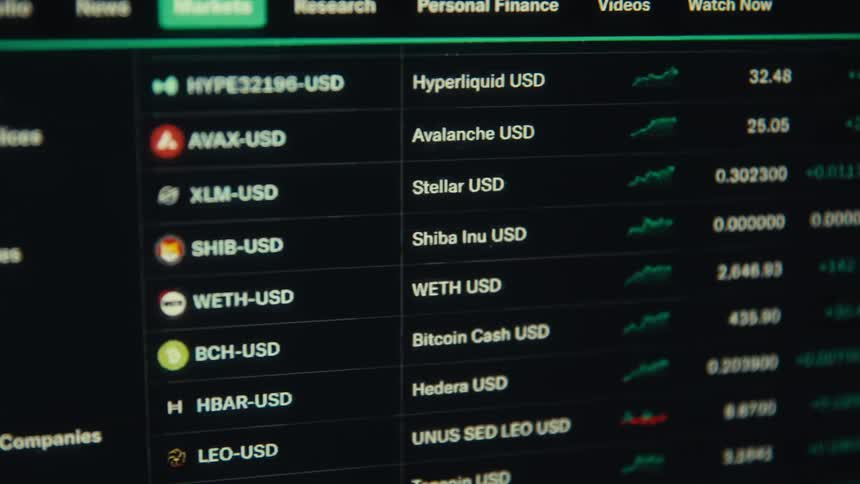
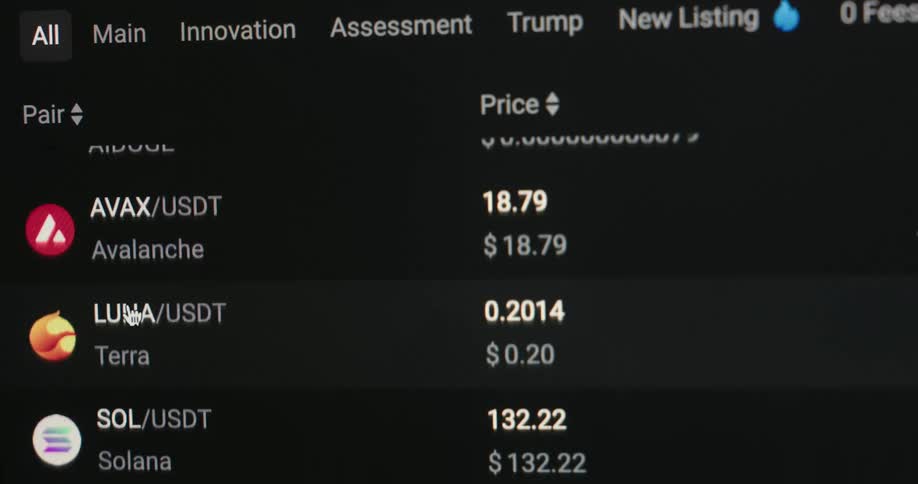
Panel showing cryptocurrency prices and symbols
Screen displays the values and the relevant plot of changing stock data
A large monitor flashes red and yellow bars that look like a chart
A person looking at graphs on a smartphone
Hands of a person holding a digital pen and sketching on the screen of their tablet with day trading charts
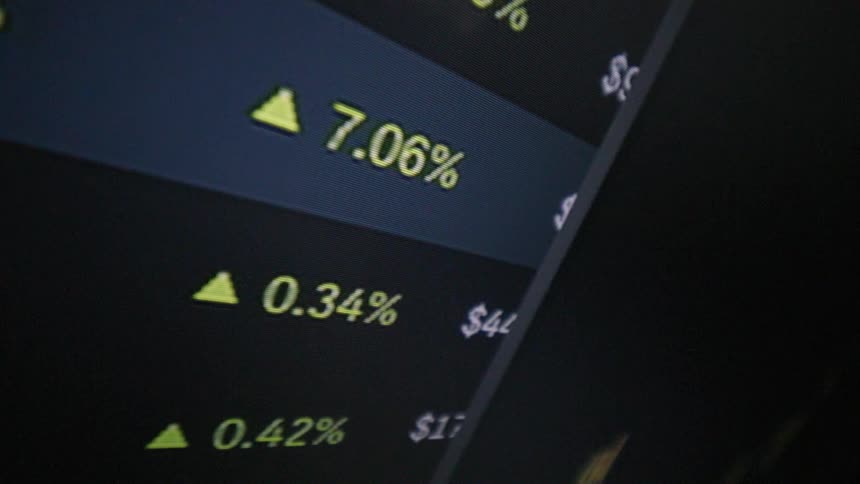
A closeup view of a stock market ticker displaying various stock symbols prices and percentage changes
Black swan event hits global economy or financial markets causing crash crisis or meltdown and stocks and shares or other investments collapse into red digits or figures causing panic and massive losses followed by economic recession and bear market
A pixelated smartphone or display device screen or monitor shows the user interface of a finance app or online broker and trading platform for buying and selling stocks and crypto currencies such as Bitcoin or ETH as the trading chart moves up
Cryptocurrency prices are displayed on the screen
A closeup view of a stock market chart with red and green candlesticks fluctuating
Macro close up of a red arrow that moves up across a pixelated screen as a financial trading graph is building beneath it symbolizing economic growth or rising stock prices or crypto currency trading as successful investment
An extreme close-up of a digital display shows columns of rapidly changing financial or statistical data with visual glitches
A list of cryptocurrencies flashes on the screen
Glowing charts and financial data move across the screen in a blur of colors
Colorful candlestick chart against a background
A macro close-up of a blue digital stock market or cryptocurrency chart on a screen showing real-time price volatility and fluctuations
Series of stock market price lists displayed on a computer screen
Pixelated candlestick chart on a screen or monitor panel forming a bullish flag pattern while the trading chart analysis shows that the graph is about to break resistance to the upside making the price of the stock or asset go up and increase in value
Screen with red waveforms and stylus interacting with biometric data

Need help finding the
right footage?

Have it delivered to your account within 1 business day.

This is Filmsupply

Our StoryOur FilmmakersArticlesFilmsPopular SearchesAll Categories

FM

A family of brands dedicated to empowering the creative.

FILMSUPPLY

Footage licensing for productions

MUSICBED

Music licensing for filmmakers

STILLS

Image licensing for creatives

© 2026 FM LLC.

Privacy PolicyLicense TermsTerms & ConditionsCareers