Musicbed
Filmsupply
Stills
Contact Us(800) 805-6802
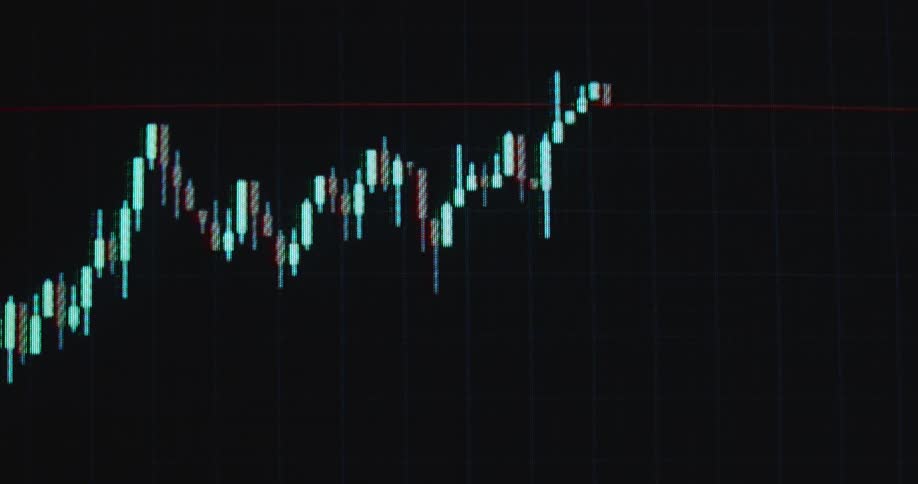
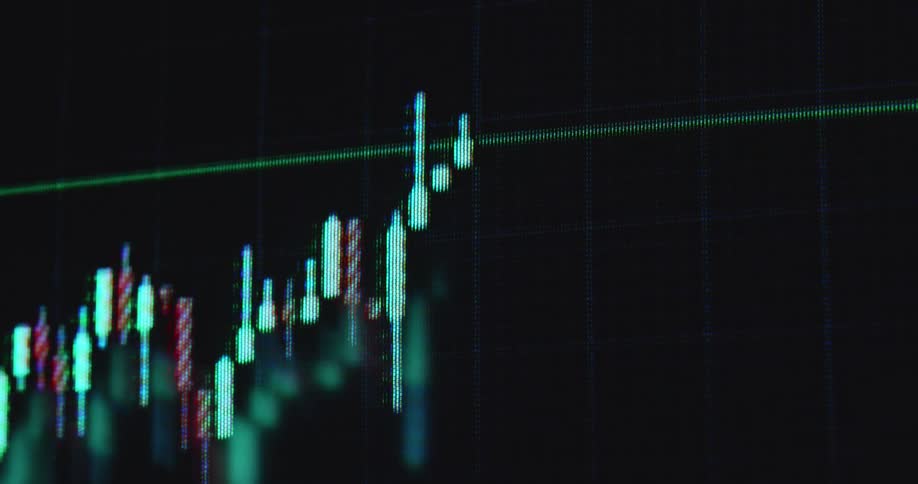
Candlestick chart of ETF or exchange-traded fund with steady growth and positive price performance over a long time span or years as the price of the asset steadily increases with an uptrend and successful value development symbolizing good investment
Financial candlestick chart on a screen indoors
Close up of a line graph on a screen under a blue light while the camera comes on and off focus
Water splashes near gold bitcoins and droplets roll off the coin
A closeup view of a stock market chart with red and green candlesticks fluctuating
Close-up of a digital analytics dashboard showing a rapidly fluctuating counter for web traffic requests on a dark screen
Financial market candle chart against abstract background
A woman is sitting at a desk and looking at a computer screen
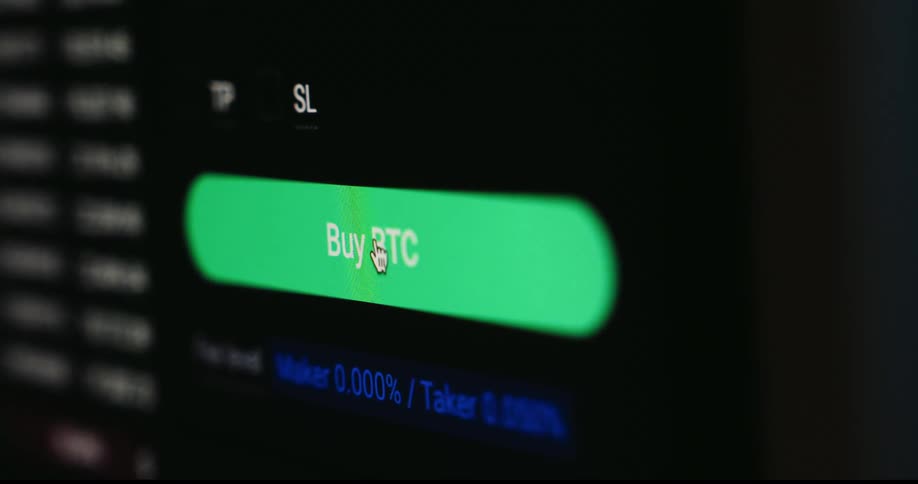
Mouse clicking the buy bitcoin button
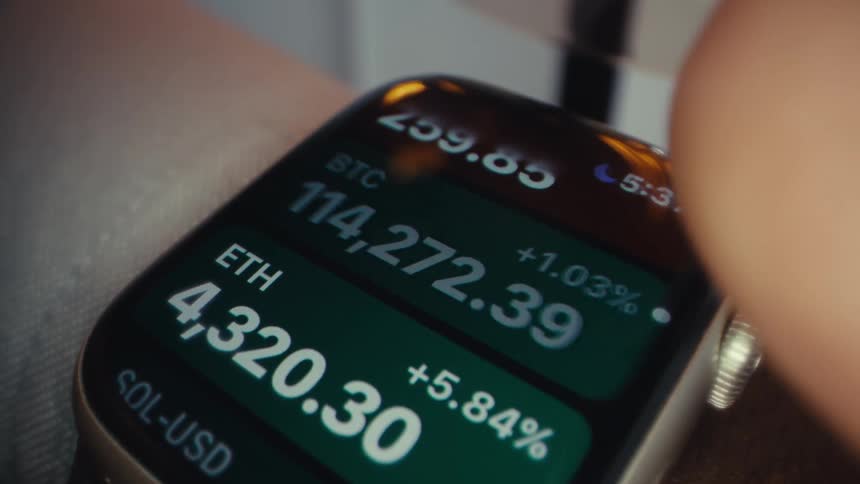
Finger interacting with a smartwatch
Man sitting at a table uses a smartphone in the cafeteria
Extreme closeup of a finger deleting an app on the iphone
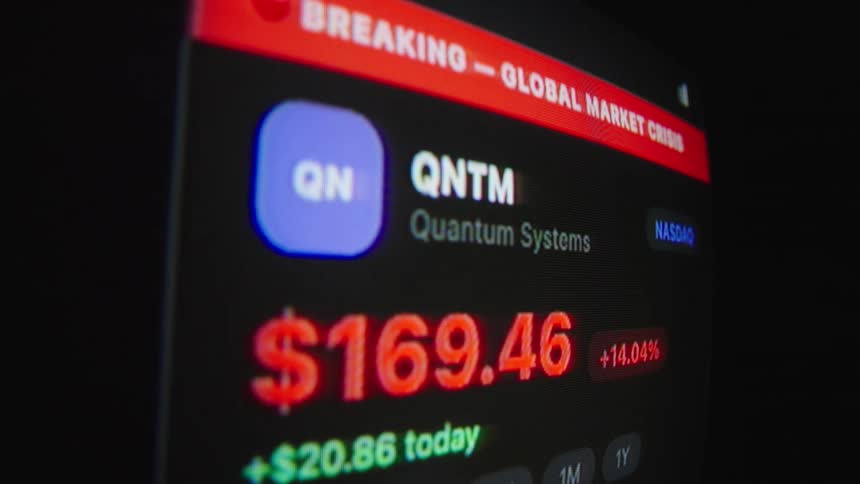
A volatile stock on a trading app rises dramatically until a 'Global Market Crisis' alert appears, causing the price to crash and the market to close
A clip of a trade chart
A person is scrolling through their phone
The pixelated computer screen shows the financial market reacting to a black swan event such as 9/11 causing a global economic crisis and crash followed by recession and great depression as the stock market collapses
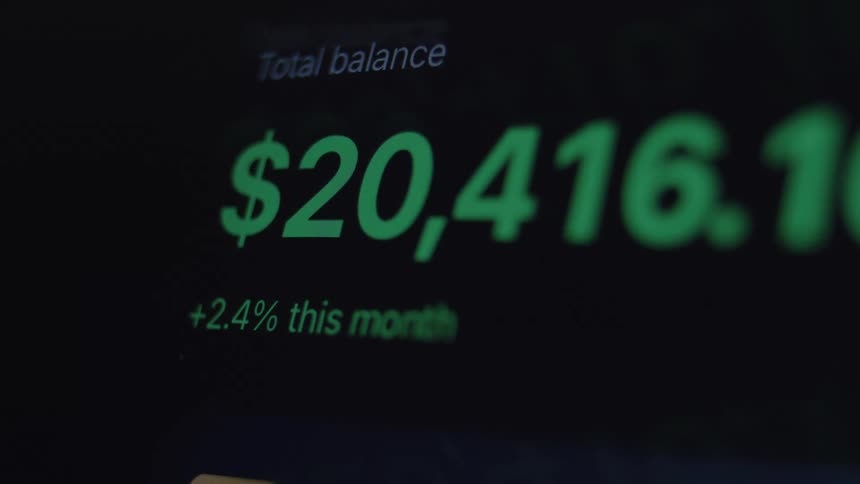
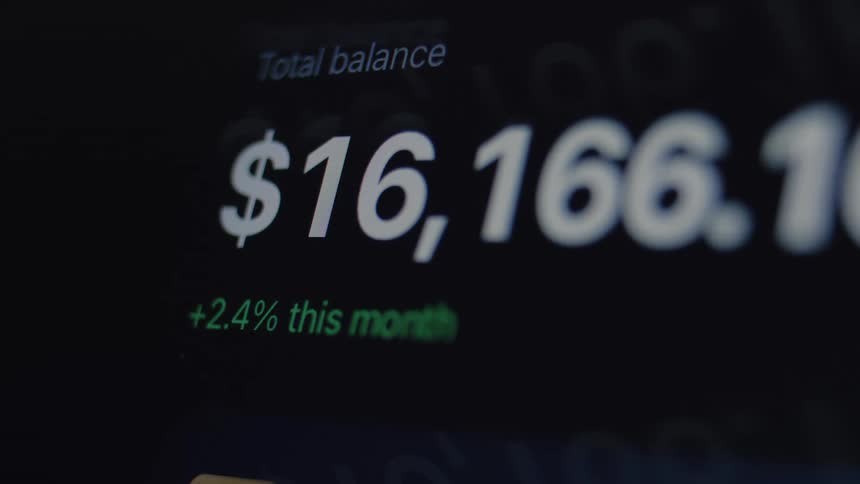
A close-up of a digital financial account showing the total balance rapidly increasing, indicating profit and wealth growth
A person scrolling through a stock market chart displaying price fluctuations
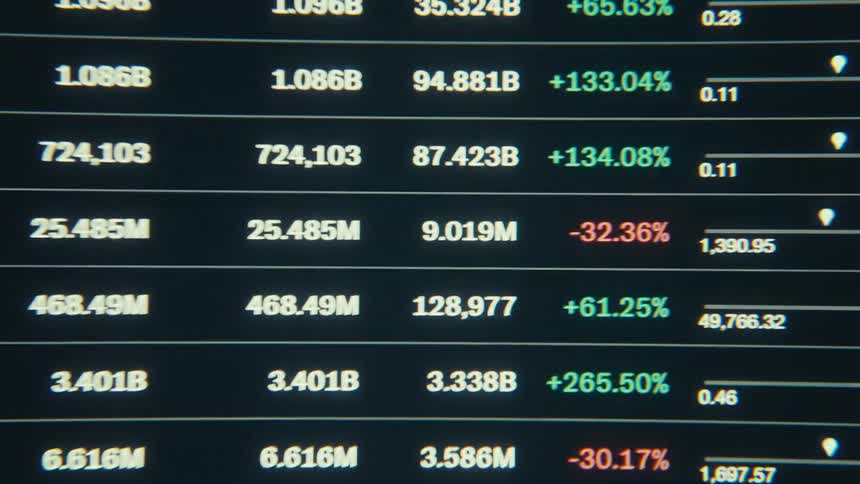
A shot shows a view of a screen with a list of companies and their financial data
A close-up of a digital stock market chart displays real-time price fluctuations with candlestick patterns on a screen
A digital chart with a downward-pointing arrow slowly pans across a screen, symbolizing economic decline
Red and green candlestick chart on a pixelated screen with RGB pixels as the bearish graph breaks resistance to the downside and the market or asset value collapses causing massive losses and volatility due to an unexpected crash
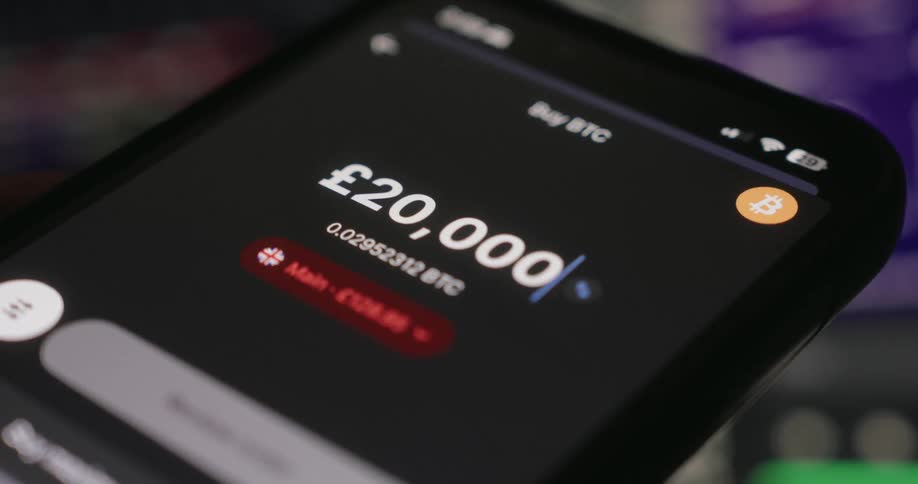
An amount of money is typed into the app on the phone
Extreme closeup of a finger pressing an iphone screen and moving apps
A line graph is displayed on a monitor on the side of a building
A finger touches an autoscrolling screen
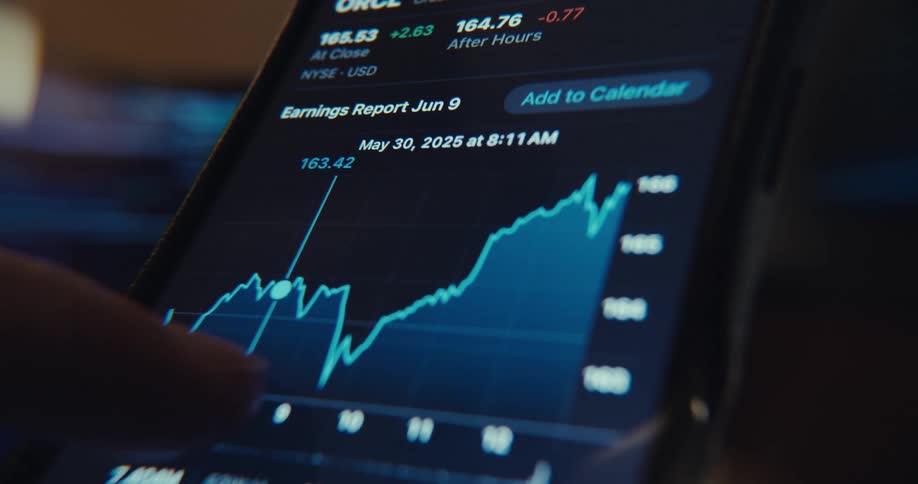
A person touches the graph on the application
A man is looking at a light graph on his monitor
Locked off macro shot with no camera movement of red and green candles creating candlestick chart of a bearish market pattern with drastic crash and recession with massive financial losses as the trading software is running on the computer
Stack of golden coins with the bitcoin logo printed on them
Close up of water running over the shiny engraved surface of golden bitcoin physical coins
A close up of a screen with numbers on it
A financial graph with an upward trend arrow and bar chart rises on a digital screen, with smoke effects adding a mysterious atmosphere
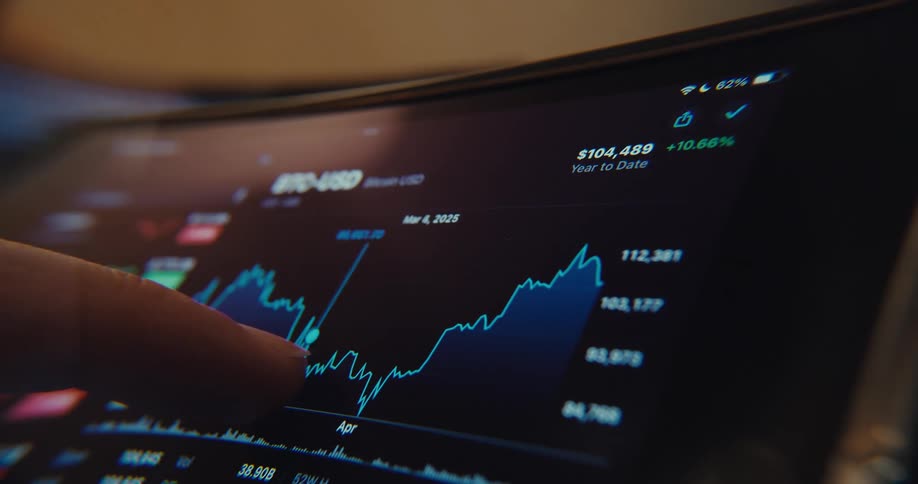
A persons finger touching a graph on a tablet screen
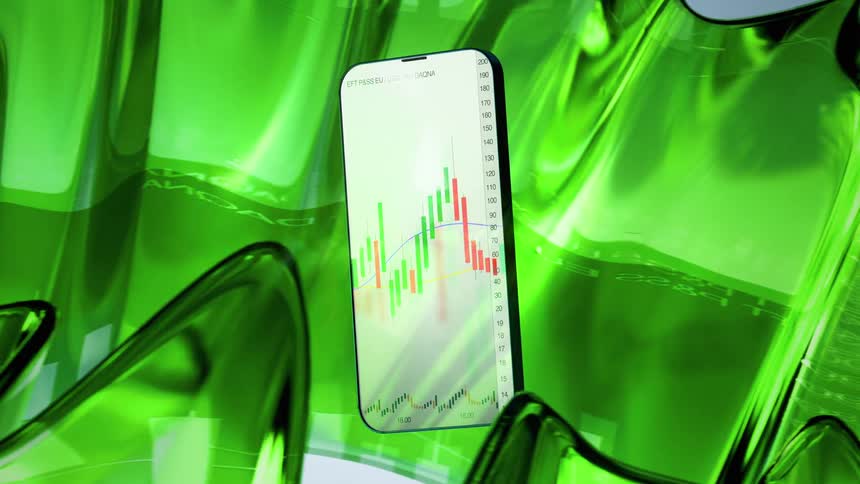
A smartphone displaying a candlestick chart floats amid abstract green and amber shapes
Digital pixelated graph with positive trendline going up showing growth and financial strength of the global or US economy or an economical upward trend while making progress and profiting from business opportunities
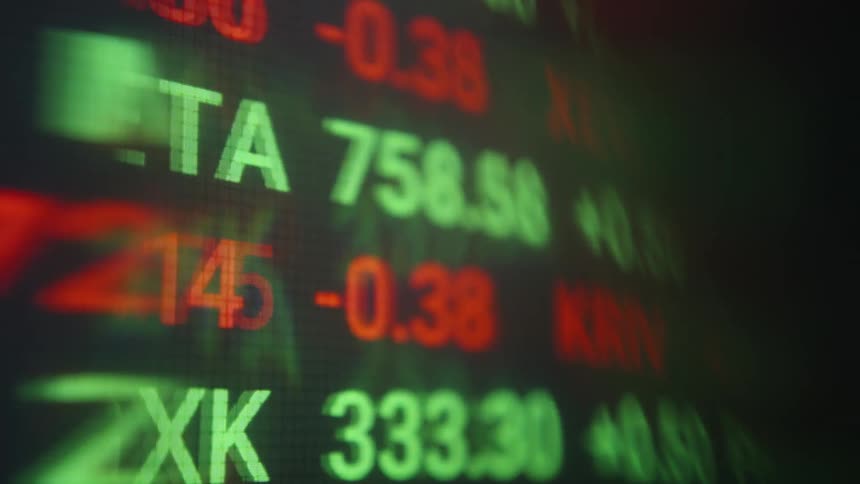
An abstract, out-of-focus digital stock market display shows red and green numbers rapidly fluctuating
A closeup view of a stock market chart with red and green candlesticks fluctuating
A fastpaced sequence of glowing candlestick charts and fluctuating stock market tickers appears through glitchy transitions and bright light leaks creating a highenergy atmosphere of digital financial trading
Red candlestick charts indicate sharp market downturn with fast price movement and negative development caused by stock or finance market crash and recession displayed on digital computer screen causing stress and panic while assets lose value
A close-up of a digital screen showing a real-time stock market chart with fluctuating numbers and candlestick patterns
Falling financial market chart against a background of abstract numbers
A close-up, shallow focus shot of a digital stock market ticker shows prices and data rapidly changing on screen
Two people point at the plot displayed on a laptop while collaborating
Informational graphs cover the computer screen
A hand is shown pointing at a line graph on a smartphone screen displaying stock market data
Man checking price graphs on a smartwatch indoors
A person scrolls through social media on their phone
Extreme macro close up of a stock chart candle diagram with red and green candles and increasing and decreasing numbers on a dark digital computer screen with pixelated image and distortion
A person is making a purchase on their cellular device
A candlestick chart of a stock option displayed on a computer screen
Values and changes in red and green displayed on a financial market board
Candlestick financial chart on a screen indoors
A close-up of a digital screen showing a financial account balance flashing red as a warning or alert
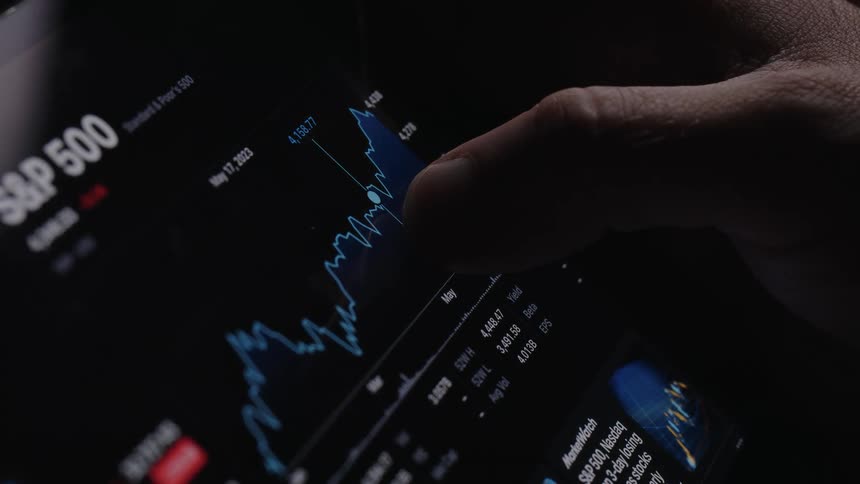
Person drags thumb across screen to view daily stats for the sp 500
Volatile candlestick chart rises and falls to bottom of screen due to dramatic market crash or collapse causing panic and global economic recession providing great trading opportunities for day-traders that view volatility as opportunity and buy the dip
Dramatic macro shot of pixelated computer monitor showing a trading chart or financial graph crashing as the global economy is hit by a recession causing great depression and panic sales at the financial markets
On a laptop a user types stocks to watch into google chrome transitioning to a search results page
A cryptocurrency amount is put into the phone
The line chart on the computer has different shades of color
A close-up shot shows a digital investment portfolio's total balance rapidly fluctuating on a dark screen
An over-the-shoulder shot captures a financial trader analyzing real-time stock market charts on a laptop
The video features a closeup cinematic shot of a digital stock market ticker displaying fluctuating financial data green and red numbers scroll across the screen highlighting various stock symbols and their realtime price changes

Need help finding the
right footage?

Have it delivered to your account within 1 business day.

This is Filmsupply

Our StoryOur FilmmakersArticlesFilmsPopular SearchesAll Categories

FM

A family of brands dedicated to empowering the creative.

FILMSUPPLY

Footage licensing for productions

MUSICBED

Music licensing for filmmakers

STILLS

Image licensing for creatives

© 2026 FM LLC.

Privacy PolicyLicense TermsTerms & ConditionsCareers