Musicbed
Filmsupply
Stills
Contact Us(800) 805-6802
The screen is covered in numbers
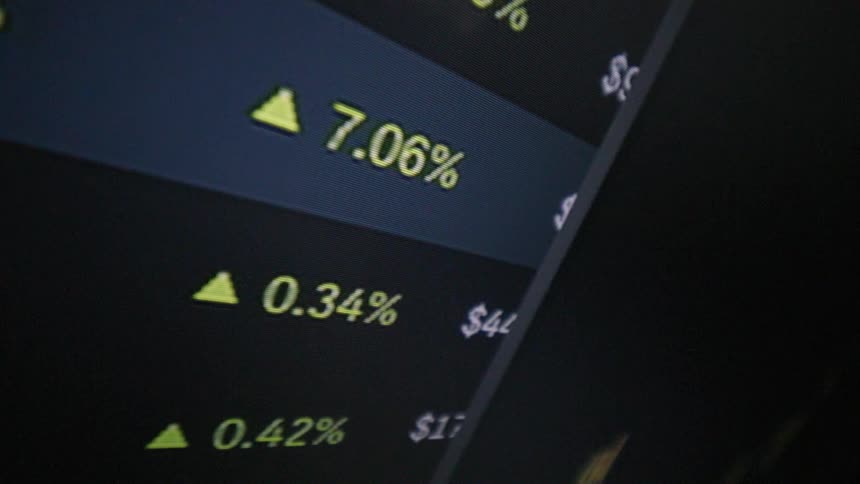
Values and changes in red and green displayed on a financial market board
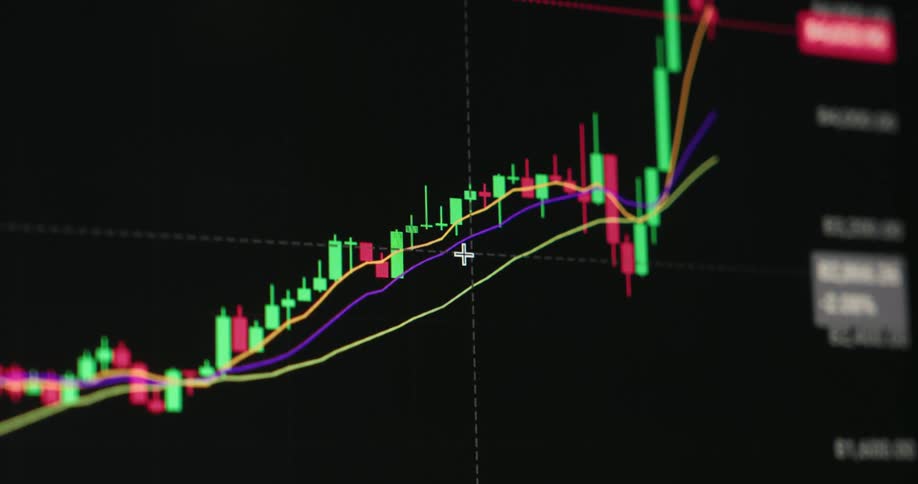
Computer screen shows financial candlestick trading chart consisting of glowing neon green and red candles with wicks as prices goes up with positive trend and little volatility while the stock asset or ETF increases in value over time as good investment
A blurred, close-up, and stylized animation of a digital stock market chart with glowing lines and fluctuating data
A financial chart with red and green bars and colored lines is displayed on a dark screen
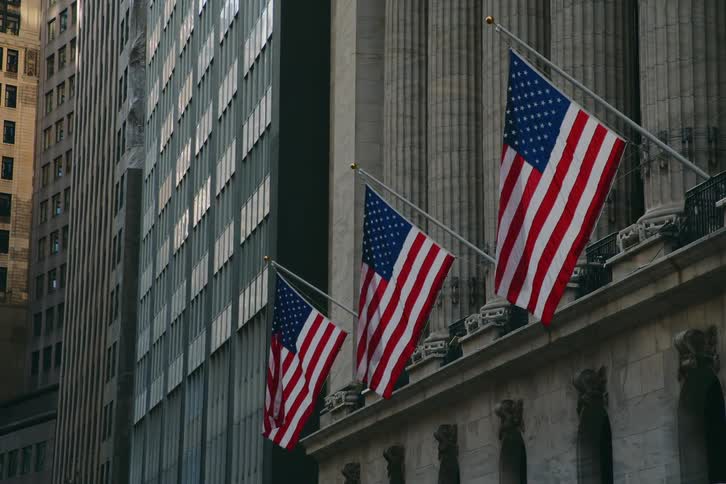
Flags hang from the building
Colorful candlestick chart against a background
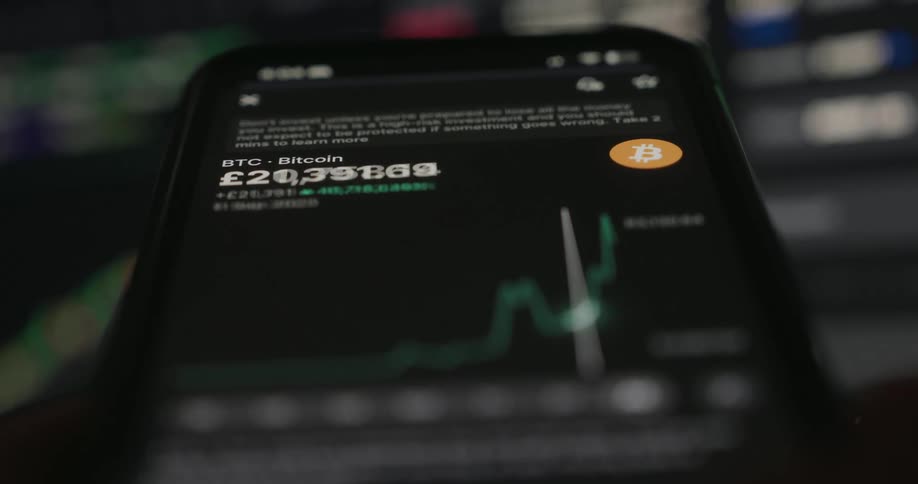
A closeup view of a trading screen highlighting bitcoin btc prices and trends
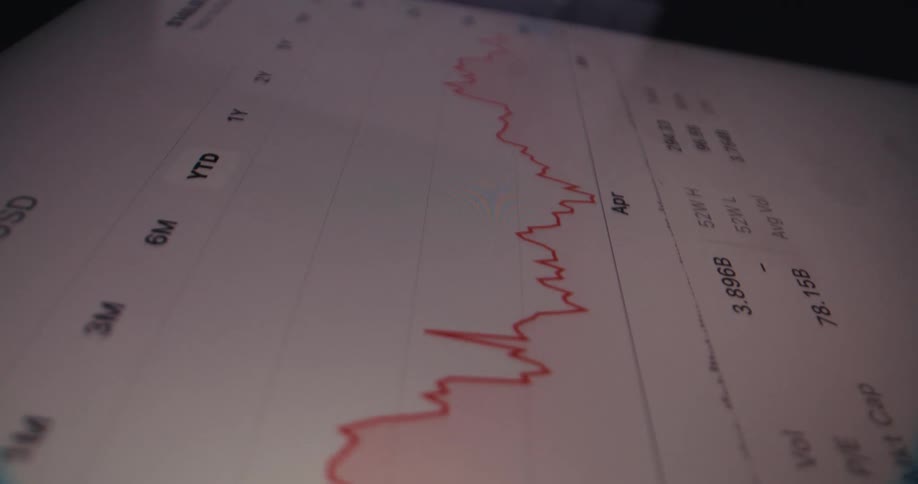
The tablet display is full of numbers
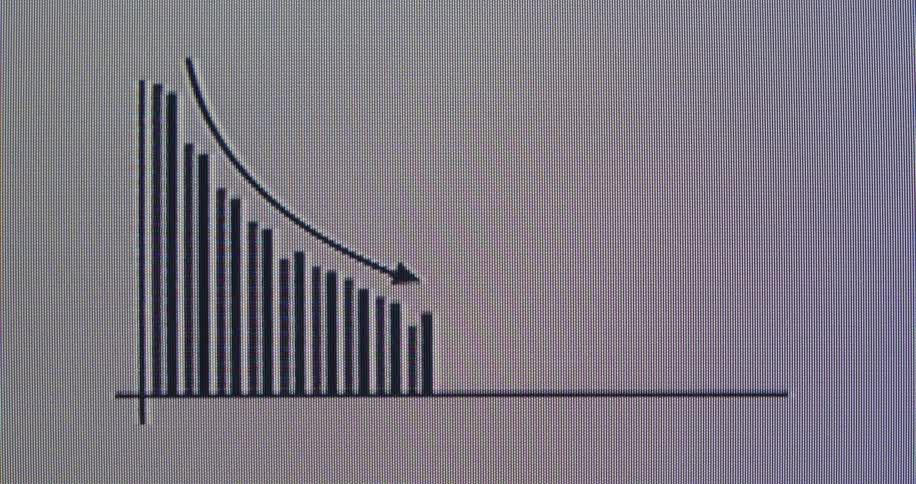
An animated red bar graph with a downward pointing arrow trends down, symbolizing economic recession
A floating phone with a graph on its screen
Gold bitcoin standing on a mound of black particles
A macro close-up of a digital screen shows an animated financial chart with a positive upward trend
Digitized trading graph crashes and falls down as the stock market collapses with a negative downward tendency into the red digits providing opportunities for new stock brokers and investment strategies in the equities or crypto currency market
A close up of digital writing and numbers
Macro view of a digital screen showing a white animated financial graph and arrow moving upwards on a black background
Stylized, soft-focus animation of a stock market or cryptocurrency trading chart with fluctuating data and glowing lines
A macro shot shows a digital server uptime metric of 99.982% on a dark computer screen
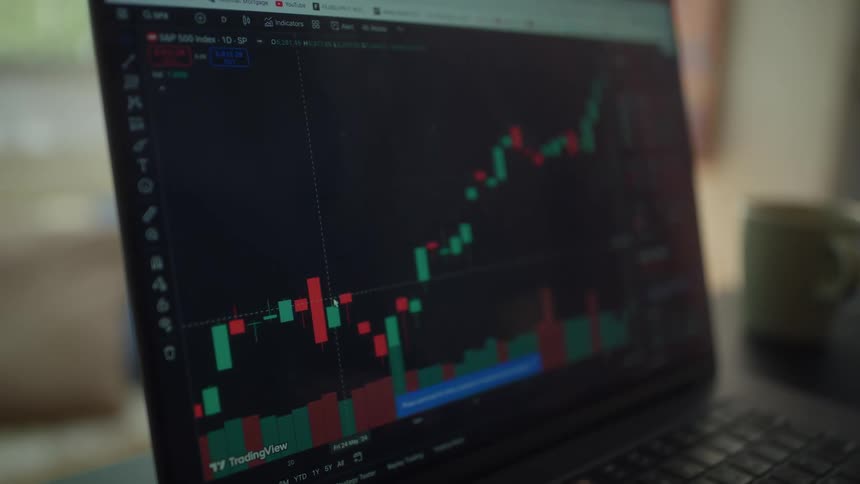
Person sits at a table at home and uses a computer displaying a graph related to trading
A close up of numbers on a screen
A close-up of an animated bar graph on a pixelated computer screen showing a declining trend
Closeup of a graph of financial data that occasionally shows spots of light
Handheld macro close-up of bullish financial market chart or candlestick trading graph on black screen displaying the UI of stock or crypto broker application or platform as the price surges and the value of the asset increases during investment bull run
Pixelated computer screen displays a red graph with statistical data showing the increasing inflation rate as prices for everyday goods and living costs in the US rise with a very high CPI or consumer price index causing financial problems
Close up view of a person looking at stocks
A shot shows a view of a screen with a list of companies and their financial data
A close-up of a volatile stock or cryptocurrency price fluctuating rapidly between green gains and red losses on a digital screen
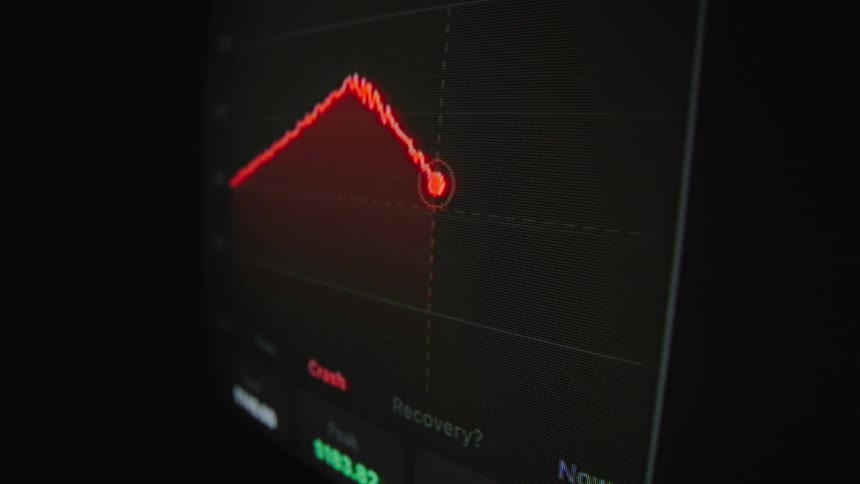
Close-up on a digital stock market chart showing a sudden and dramatic price crash after reaching its peak
An abstract, out-of-focus animation of a digital stock market chart shows fluctuating data and glowing trend lines
A cinemagraph loop shows four fighter jets flying in perfect diamond formation in super slow motion
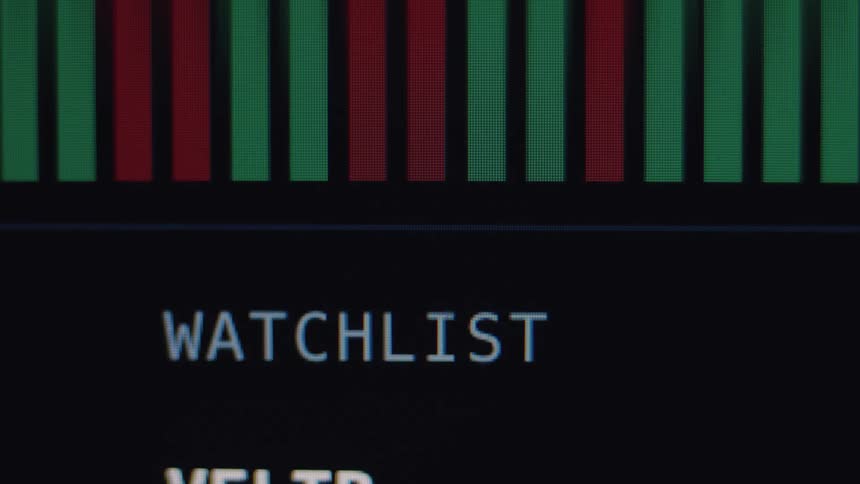
A close-up view of a stock market watchlist on a computer screen shows fluctuating green and red bars indicating gains and losses
Stack of golden coins with the bitcoin logo printed on them in front of a screen showing a financial line graph
A timelapse of a large radio telescope in a desert valley as dramatic storm clouds pass and the sun sets
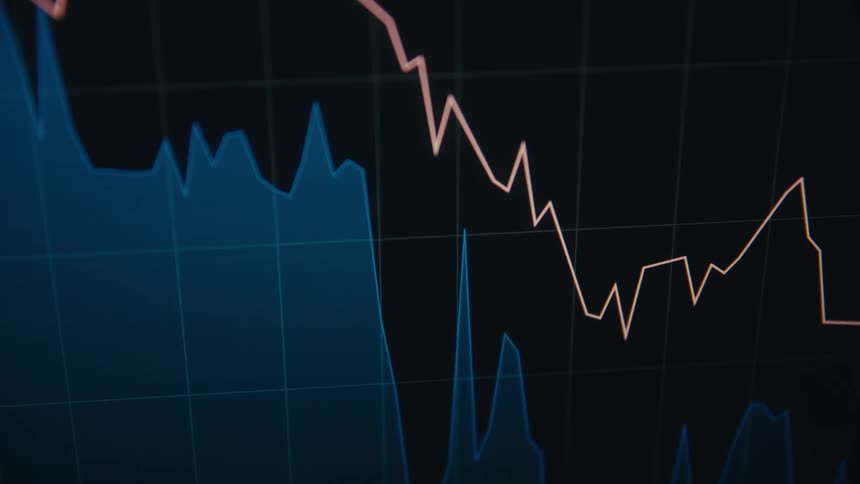
A dark video shows blue green and red stock market line graphs on a computer screen against a grid
Close up of a person swiping through various currency charts on a trading app in a tablet device
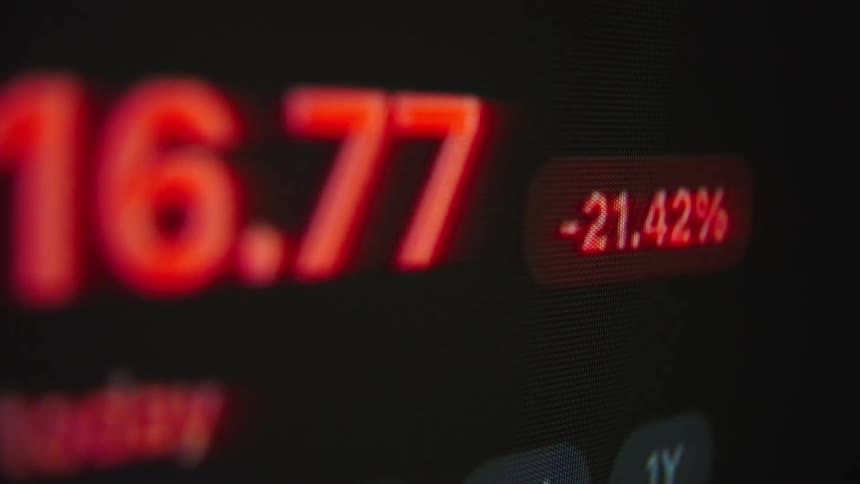
A close-up of a digital screen shows a stock price crashing as the numbers rapidly decrease, ending with the market closing
A display showing charts of a stock price
A red and green line graph depicting a sharp decline is prominently displayed on a dark background suggesting a financial downturn and loss
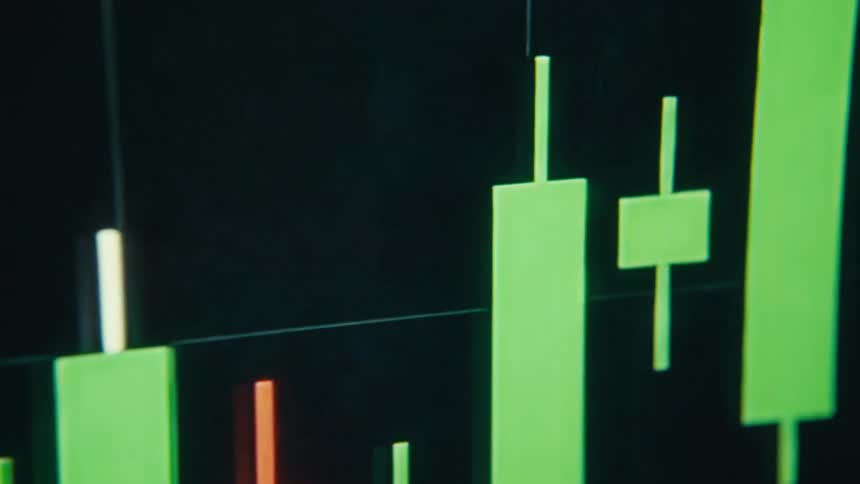
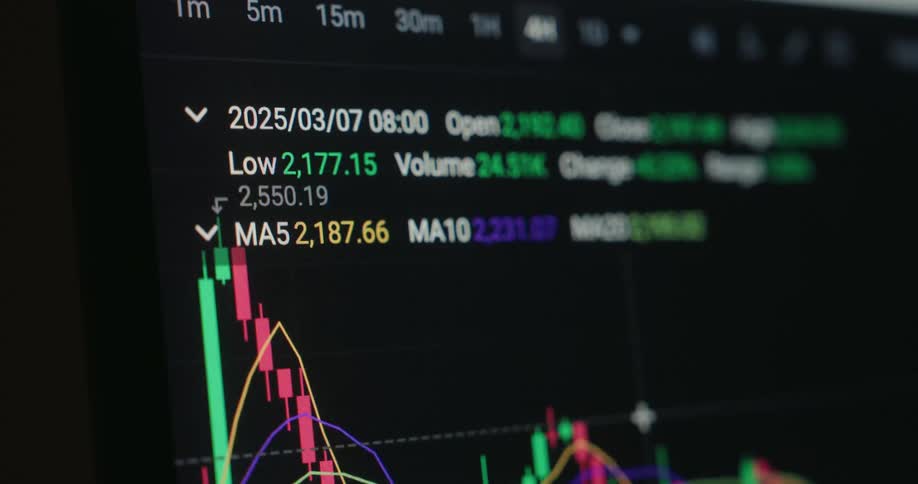
Candlestick chart of a stock market price displayed on a computer screen with green and red candles
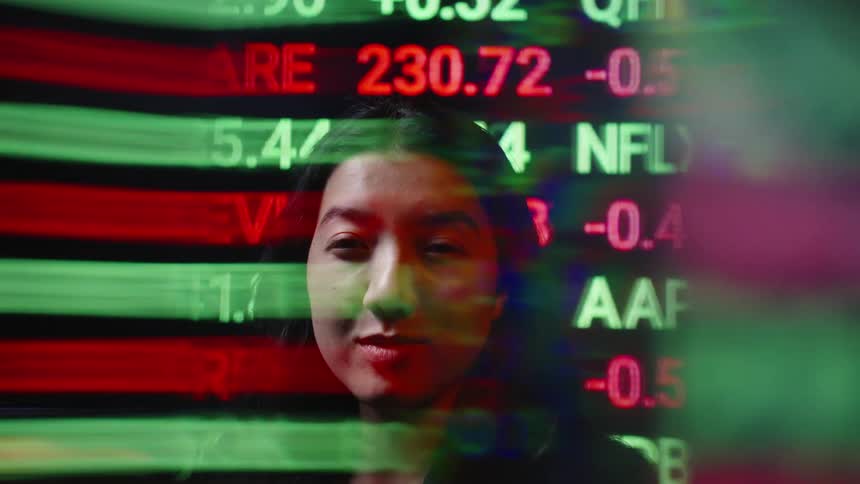
A woman with long dark hair is seen while glowing stock market tickers and financial data move across the screen
Extreme macro close-up of a pixelated candle of candlestick trading chart changing between the colors green and red as symbol for volatility and uncertainty in the financial markets while the price of the stock or cryptocurrency rises and falls
The bar graph goes up and down across the entire computer screen
The monitor is showing stock activity
A finger swipes along a tablet
A close-up of a digital screen showing a real-time stock market chart with fluctuating numbers and candlestick patterns
Line graphs and numbers move across the monitor
Series of candlestick stock prices displayed on a screen
The pile of cash is on fire
The pixelated computer screen shows the financial market reacting to a black swan event such as 9/11 causing a global economic crisis and crash followed by recession and great depression as the stock market collapses
Closeup of a screen displaying a fluctuating line graph
Stacks of golden coins with the bitcoin logo printed on them
A stack of golden colored coins have the bitcoin cryptocurrency logo on them
A digital graph on a screen shows a volatile stock price or cryptocurrency value fluctuating up and down, indicating gains and losses
A close view shows blurry digital graphs and stock market data with red and green bars moving quickly across a dark screen
Screen displays the values and the relevant plot of changing stock data
Handheld macro shot with dynamic camera movement of a data graph animation that moves upwards on a CTR pixel screen with a positive trend or rising development as symbol for increasing prices caused by high inflation
Computer monitors are showing graphs and data
The prices changes on the cryptocurrency displayed on the phone
Three american flags wave in the wind in front of a giant flag across the columns of the new york stock exchange building
The statue of liberty is brightly lit at dawn
A financial chart displaying colorful candlestick patterns indicates market trends and price movements
A computer monitor displays a candlestick chart of a stock price with the graph actively scrolling to the right
A closeup view of a trading dashboard showing live financial data

Need help finding the
right footage?

Have it delivered to your account within 1 business day.

This is Filmsupply

Our StoryOur FilmmakersArticlesFilmsPopular SearchesAll Categories

FM

A family of brands dedicated to empowering the creative.

FILMSUPPLY

Footage licensing for productions

MUSICBED

Music licensing for filmmakers

STILLS

Image licensing for creatives

© 2026 FM LLC.

Privacy PolicyLicense TermsTerms & ConditionsCareers