Musicbed
Filmsupply
Stills
Contact Us(800) 805-6802
A mouse pointer on a dark screen with some white ceilings and then a button with red writing is clicked
A person traces the graph on his tablet
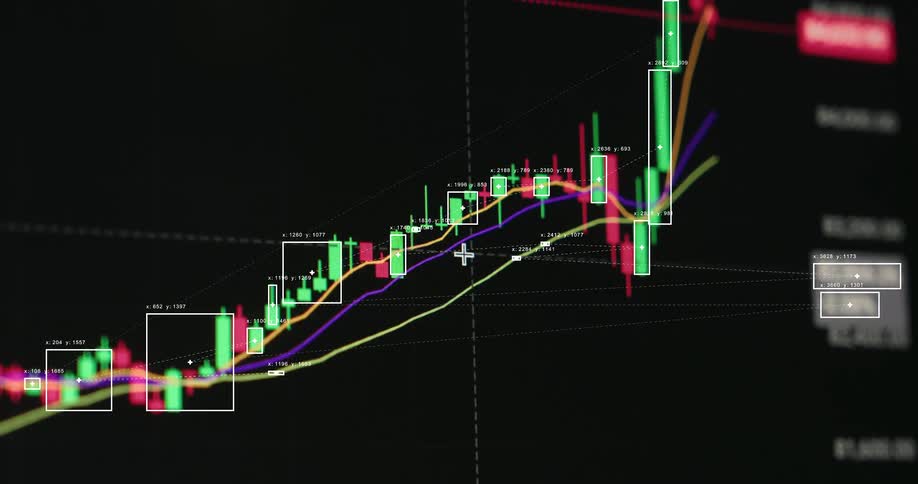
A bullish bull flag chart pattern is displayed on a dark monitor as the red and green candlestick candles form sideways consolidation before breaking resistance for a massive move to the upside with positive price development and profit in a bull run
A trading interface where mouse moves towards buy button
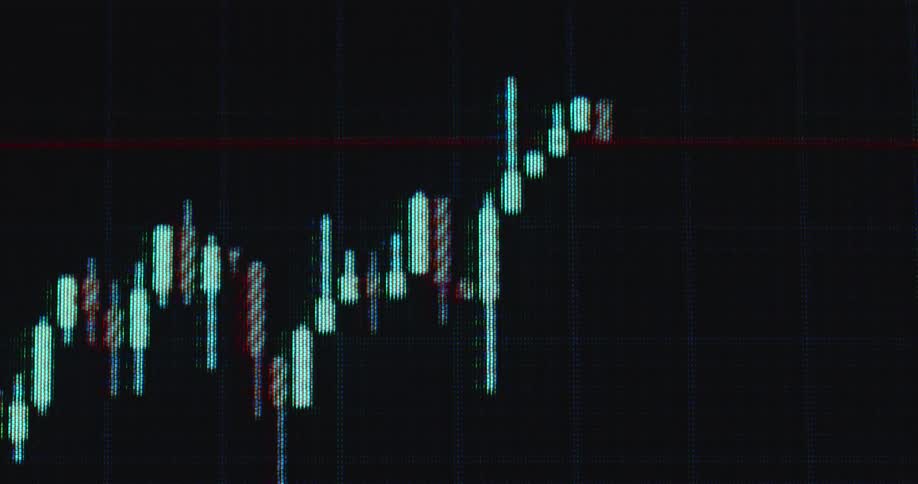
Bright neon green bars or candles of a candlestick chart pattern or financial graph on computer display screen with dark background and positive price development symbolizing successful stock trading with upward trend and handheld camera movement
Screen displaying a decreasing red graph as the international stock markets and trading exchanges are crashing and prices are falling dramatically due to global recession and economic crisis causing ETFs and the gold price to decline
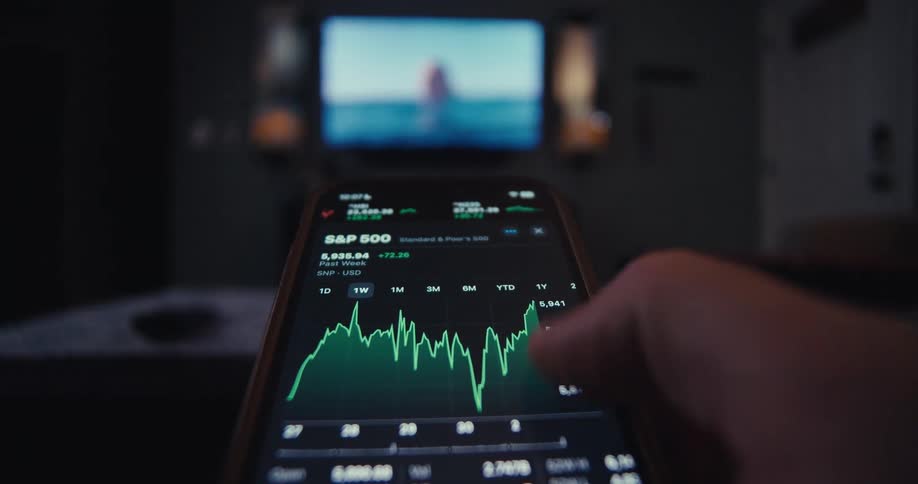
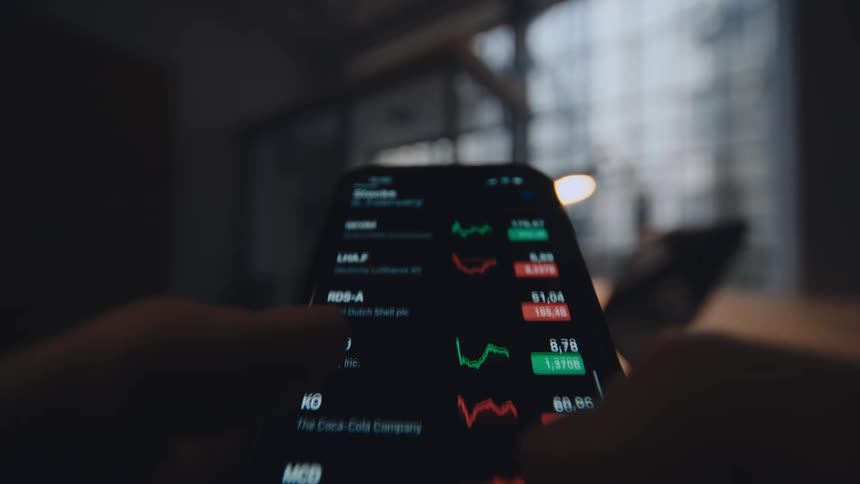
Hand interacting with smartphone in a stock exchange app
The financial markets are crashing due to a recession making stocks and shares drop and go down in price with decreasing value symbolized by a falling candlestick chart with red candles on a RGB pixel screen with black background
A close-up, shallow depth of field shot of a colorful candlestick graph displaying fluctuating financial market data on a screen
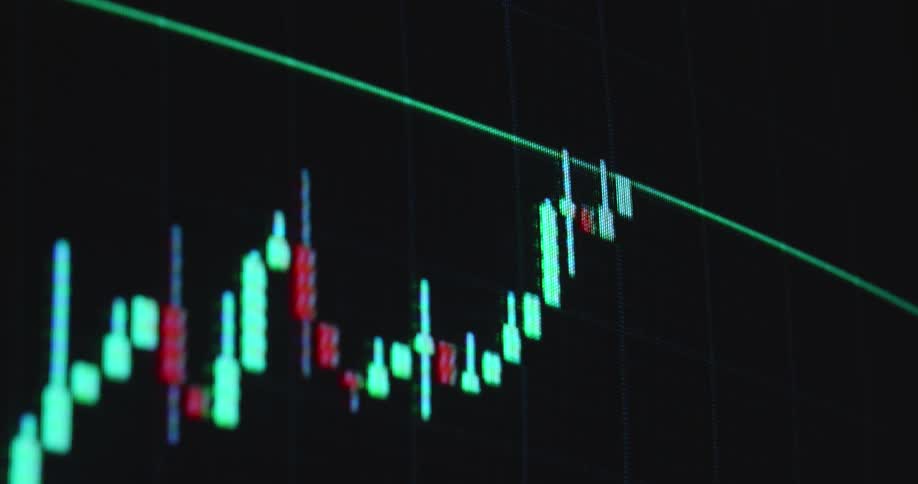
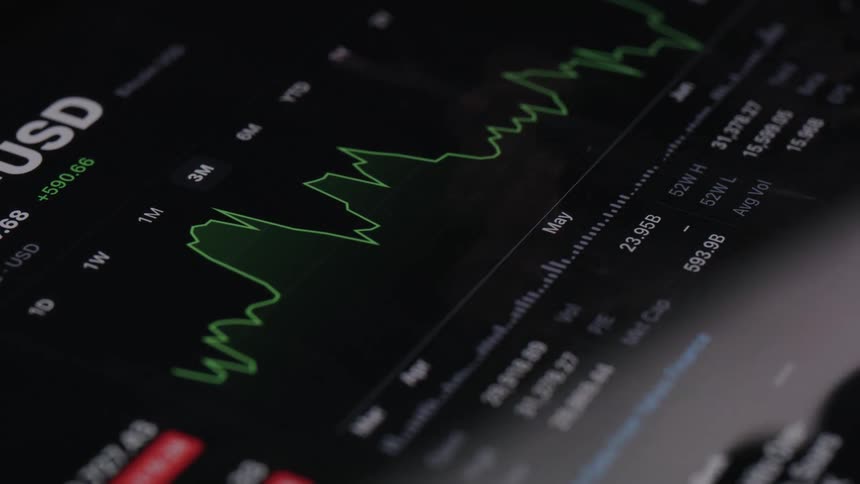
A blurry close-up of a green stock market chart on a digital screen showing fluctuating data and an upward trend
Line graphs and information are displayed on the computer screens
A finger touches an autoscrolling screen
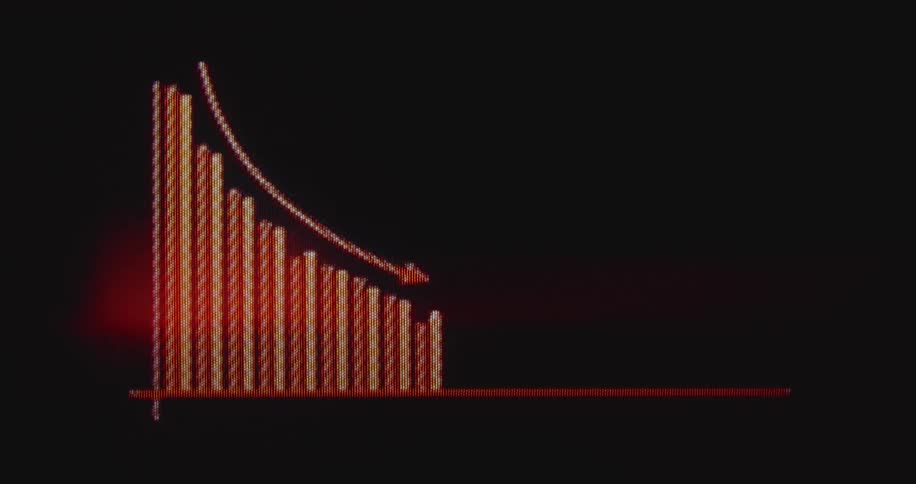
An animated bar graph with a red arrow illustrates a declining trend, symbolizing financial loss or economic downturn
Red and neon green glowing candles create a bullish candlestick chart pattern with upward movement and positive price development as symbol for a healthy commodity or equity market or profitable stock or crypto trades via online broker app
An animated candlestick chart on a digital screen displays fluctuating stock market or cryptocurrency data and analytics
Digital display shows graph and data points
A user navigates a stock trading application on a smartphone, examining various charts, analyst ratings, and company financial data
A computer screen indoors displaying a stock market price chart with a green line as a persons finger moves across it
Stacks of money on fire on the floor in a dark room
A large computer monitor shows a graph with zigzag lines and numbers
Numerous gold colored coins with an upper case b on them sit in a puddle of water
The bars on the chart rise on the screen
The video features a blurry fastmoving display of stock market tickers and financial data shown in red and greenfamiliar company symbols like aapl and msft flicker across the screen alongside fluctuating numbers and percentage changes
A gold bitcoin is standing on edge above moving water with water droplets on it
Pixelated RGB computer or display device screen presenting a candlestick trading chart with positive exponential price development as the green candles go up indicating a healthy global economy and stock market reaching new all-time highs
Screen displaying green graph with numbers
Water flowing over gold coins
A close-up of a digital stock market screen showing a 24-hour low price amidst fluctuating financial data
An animated circular Bitcoin cryptocurrency logo is displayed upon a pixelated computer screen representing crypto mining on the blockchain and the future of the global banking and financial system
A clip of a trade chart
A close-up, out-of-focus shot of a blue digital line graph fluctuating on a dark screen, representing stock market data or financial trends
Digital table with market numbers and percentages in green and red
Closeup of a newtons cradle with polished metal balls in motion in a dark studio
On a laptop a user types stocks to watch into google chrome transitioning to a search results page
Water splashes near gold bitcoins and droplets roll off the coin
A blurry, abstract animation of a candlestick chart showing stock market or cryptocurrency volatility on a digital screen
Finger points to a highlighted point on a line chart showing value variation
Graph on smartphone displays data for series of points on the plot
Letters spelling hollywood on a mountainside with a communications tower
A close-up of a digital stock market chart shows fluctuating asset prices with candlestick patterns and changing numbers
Live stock market prices for various instruments displayed on a monitor
Fearless girl statue in front of new york stock exchange
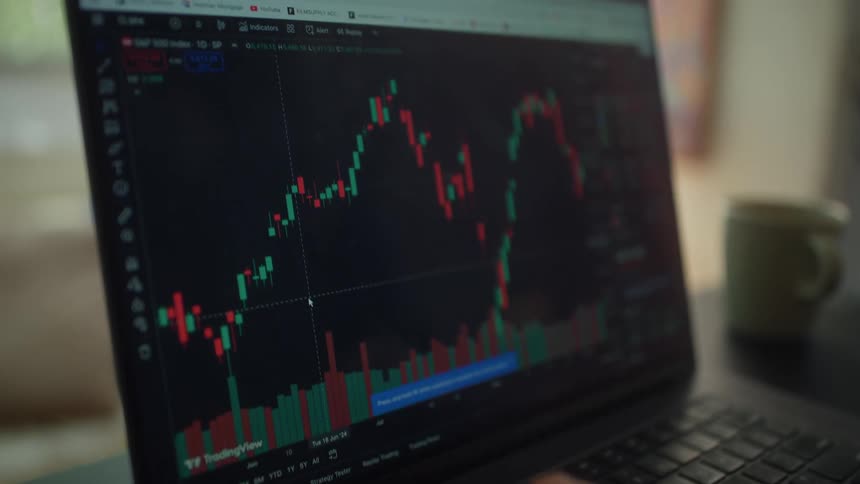
Price chart of a stock displayed on a screen
A close-up of a live stock market candlestick chart displays fluctuating financial data on a digital screen
Stacked gold bitcoins are on a mirror and a single bitcoin is tilted in front of the stacks
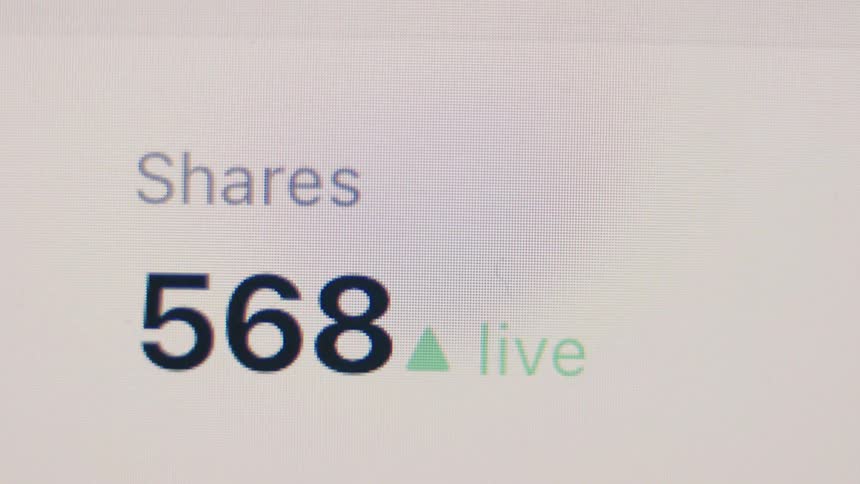
A live counter on a screen shows the number of shares rapidly increasing, symbolizing viral content and social media engagement
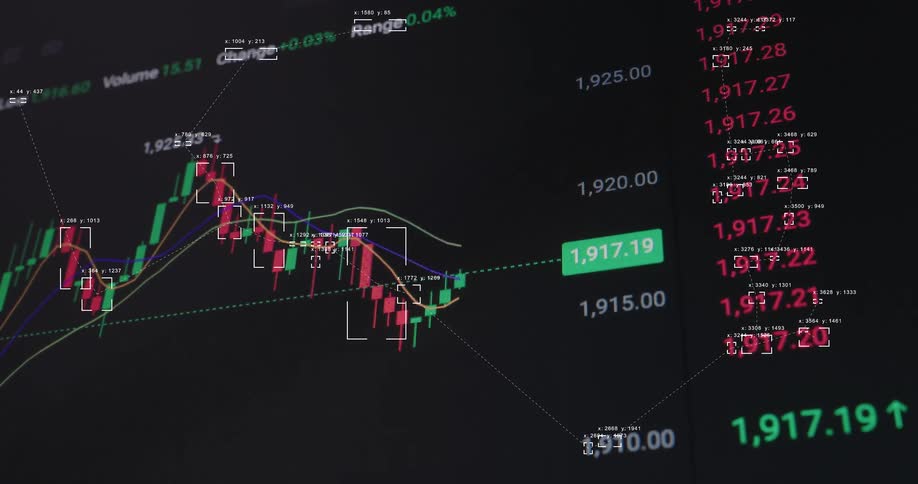
Futuristic digital display shows a dynamic candlestick chart of stock market or cryptocurrency trading with algorithmic analysis
The animated trading graph or candlestick chart is moving on the computer display as a recession hits the global finance markets and the prices crash as red candles symbolize the end of a market cycle and the beginning of a financial crisis or depression
A man is typing on his laptop
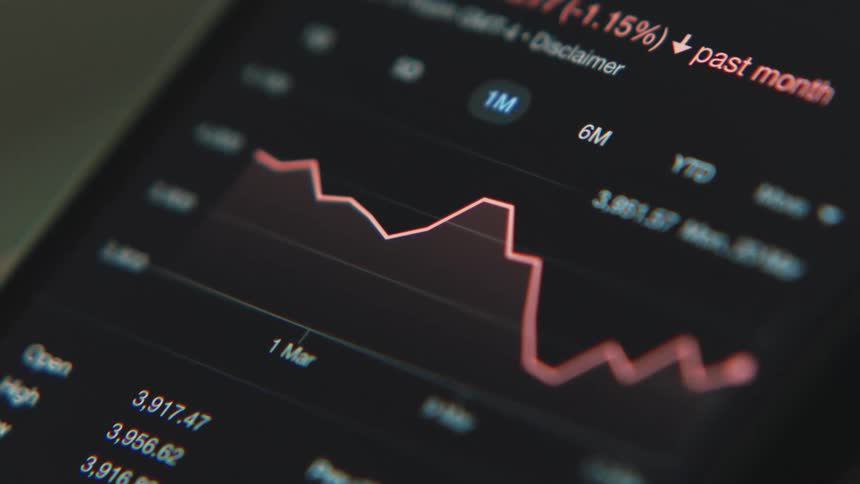
pov close up of smartphone screen while person is scrolling through stock market data
Clouds covering the golden gate bridge
A person is pressing the tablet
A close up view of financial data charts and graphs displayed on a screen with light distortions
A pile of coins on a reflective surface with lit up arrows
Partially visible hollywood sign with communication tower in the background
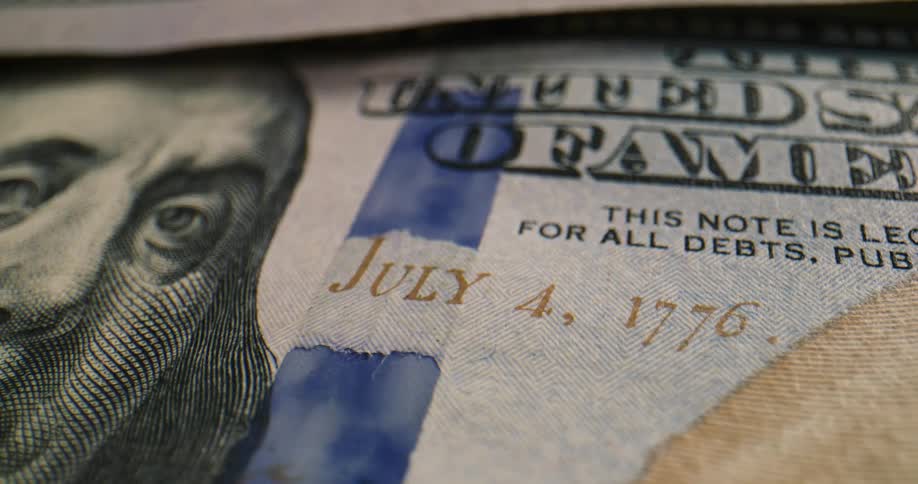
A united states one hundred dollar bill with blue security stripe and july 4th date
Red and green numbers and values displayed on a financial market screen
An enormous american flag hangs across the front of the new york stock exchange building
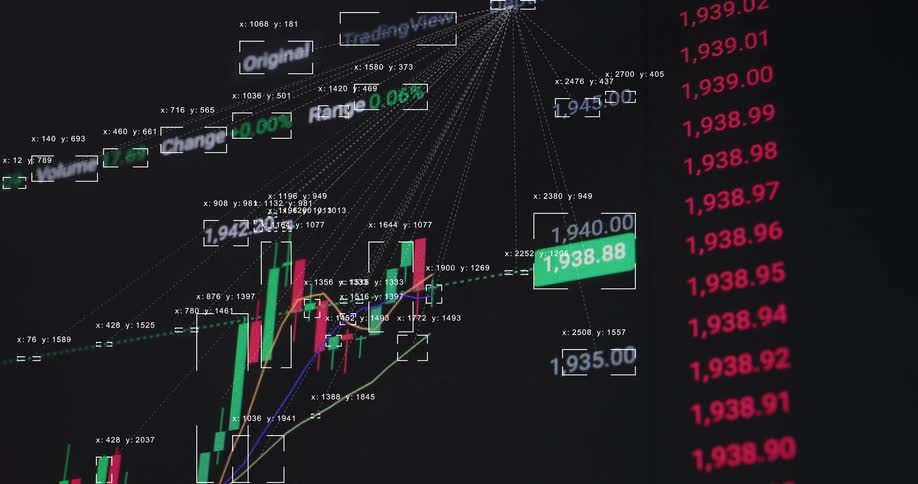
Digital candlestick chart displays rising financial market trends with animated technical analysis overlays
A digital investment graph trend line shifting between going up and down as a stock trading market prognosis or index of the finance sector affected by the global economy in the darkness on black flickering retro computer screen
The top of a tall skyscraper with the ubs logo is illuminated against the dark night sky light glows from many office windows as the camera slowly pans out to show the surrounding city lights
A dramatic black and white time-lapse shows clouds moving over the iconic Chicago skyline and the John Hancock Center
This video features a closeup blurred shot of a digital stock market ticker displaying fluctuating financial numbers and percentages the motion blur and shifting colors of red and green create a sense of fastpaced abstract data movement

Need help finding the
right footage?

Have it delivered to your account within 1 business day.

This is Filmsupply

Our StoryOur FilmmakersArticlesFilmsPopular SearchesAll Categories

FM

A family of brands dedicated to empowering the creative.

FILMSUPPLY

Footage licensing for productions

MUSICBED

Music licensing for filmmakers

STILLS

Image licensing for creatives

© 2026 FM LLC.

Privacy PolicyLicense TermsTerms & ConditionsCareers