Musicbed
Filmsupply
Stills
Contact Us(800) 805-6802
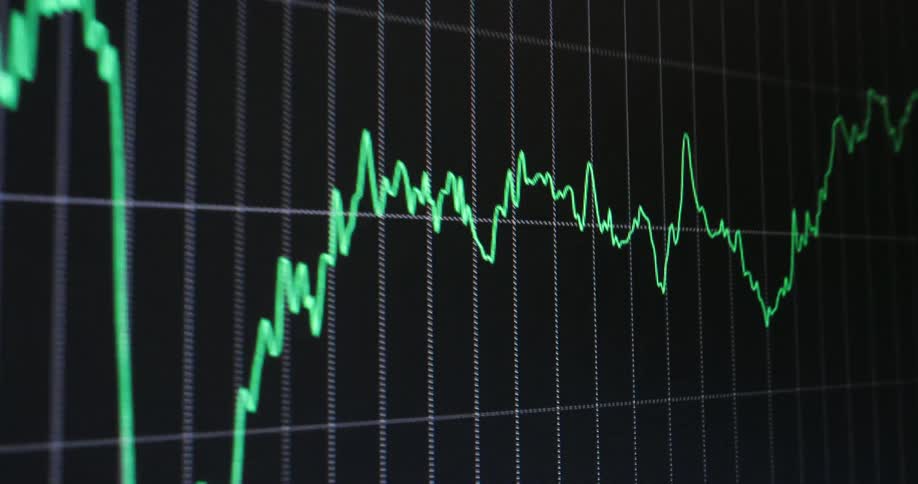
A blurry close-up of a digital financial graph shows a downward trend indicating a market crash or economic recession
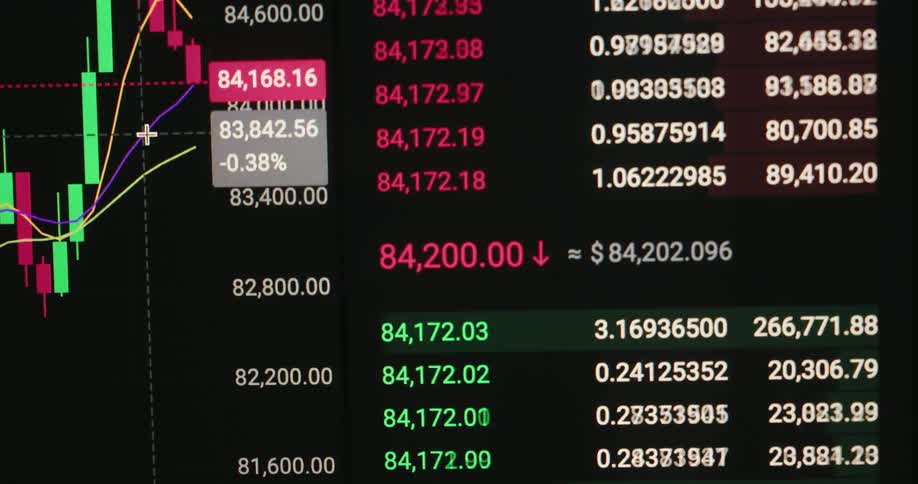
Numbers flash on the screen
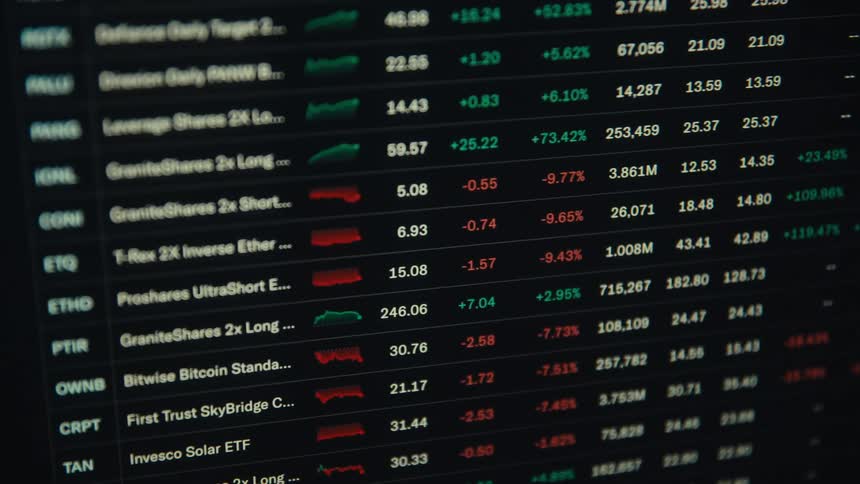
A dense slightly blurred market leaderboard of tickers and redgreen figures fills the screen
Digital candlestick charts hover over a swiftly moving surface of black streaked with blue and orange shades
Information is scrolling on the screen
A line drawing trading candles on a monitor either red or green depending on the trade before breaking resistance to the upside while the stock or crypto currency goes on price discovery making a new All-Time High or ATH with upward trend
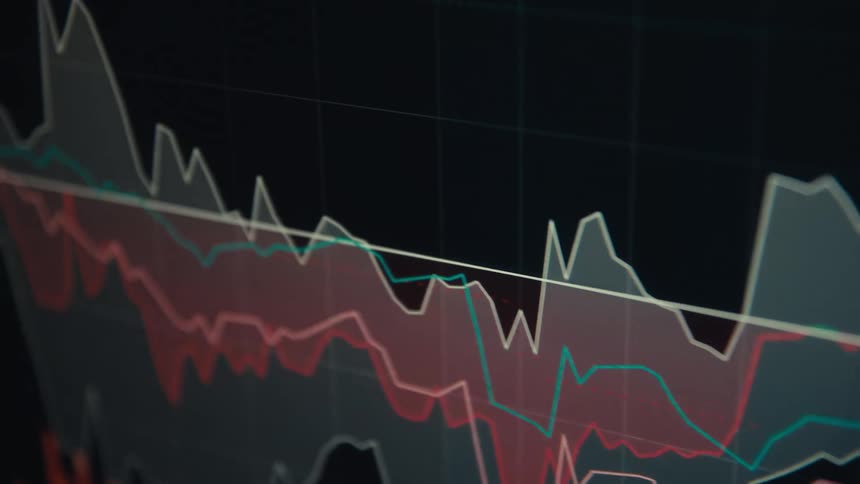
A close up of red and green lines on a graph
A clip of a screen displaying a digital trading candlesticks
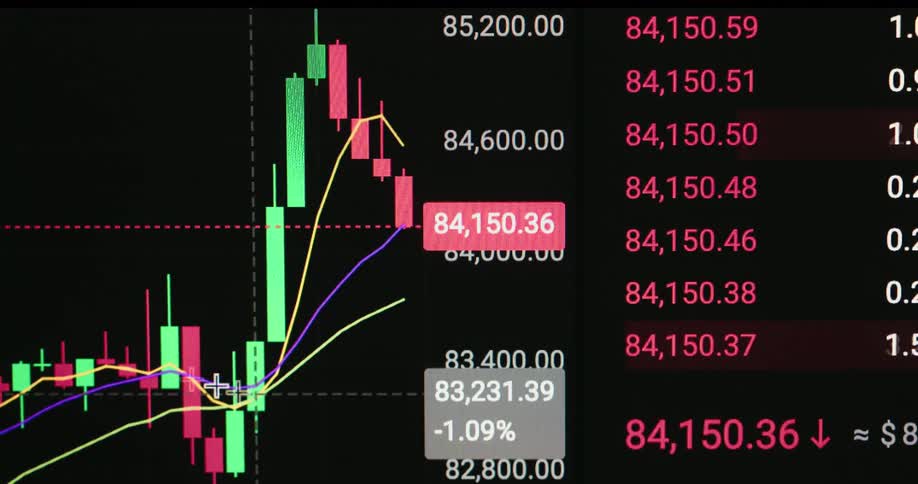
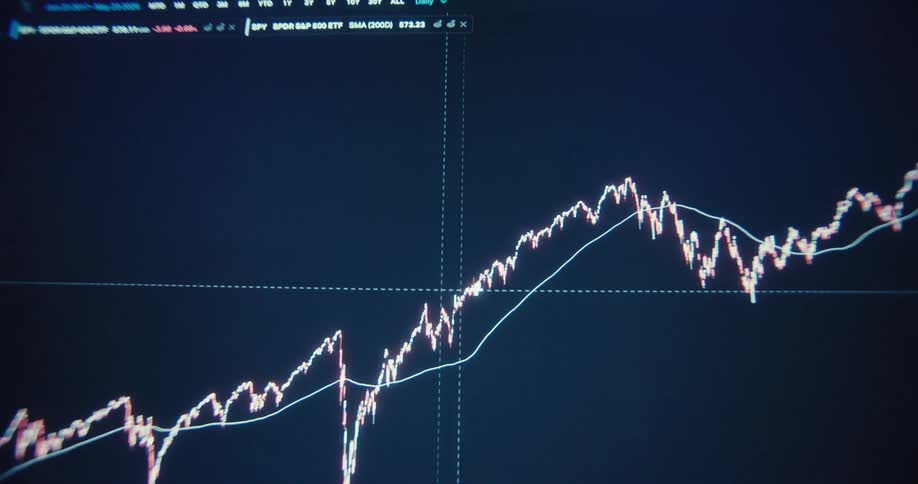
Closeup of a monitor displaying a financial market chart
A line graph is on the long monitor
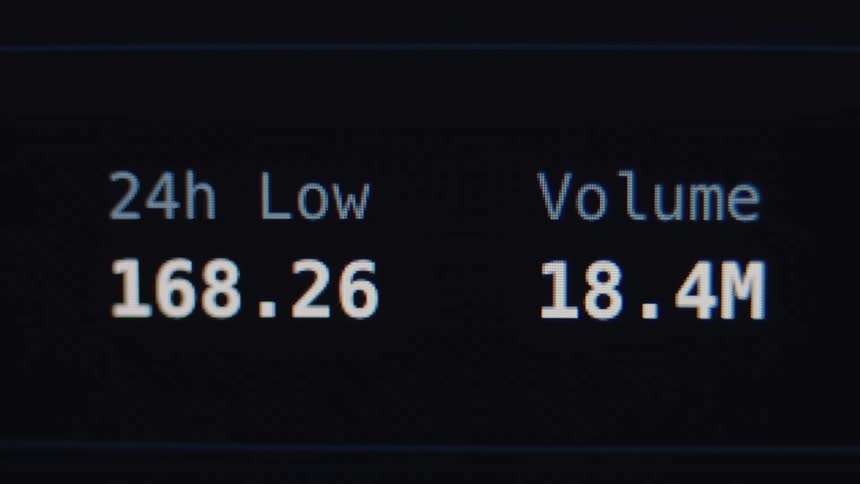
Close up of a financial trading screen displaying the 24-hour low and volume data for a stock or cryptocurrency
Screen showing numbers scrolling and switching between red and green due to the stock market
A screen shows a financial chart with lines and bars moving up and down
A smartphone screen displays various stock market charts rapidly changing between green upward trend and red downward trend graphs for different companies and indices
Screen with a cryptocurrency monitor
A digital investment graph trend line shifting between going up and down as a stock trading market prognosis or index of the finance sector affected by the global economy in the darkness on black flickering retro computer screen
Dynamic handheld macro shot of green rising trend line causing excitement and motivation to achieve financial freedom independence and success by earning money on the stock market and with crypto currency trading being displayed on a rgb pixel screen
White and blue lines
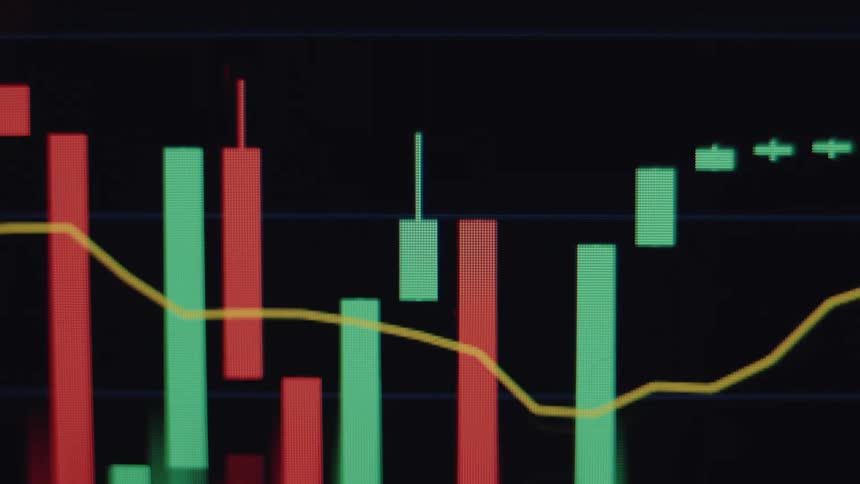
A close-up macro view of a financial candlestick chart with red and green bars fluctuating on a digital screen
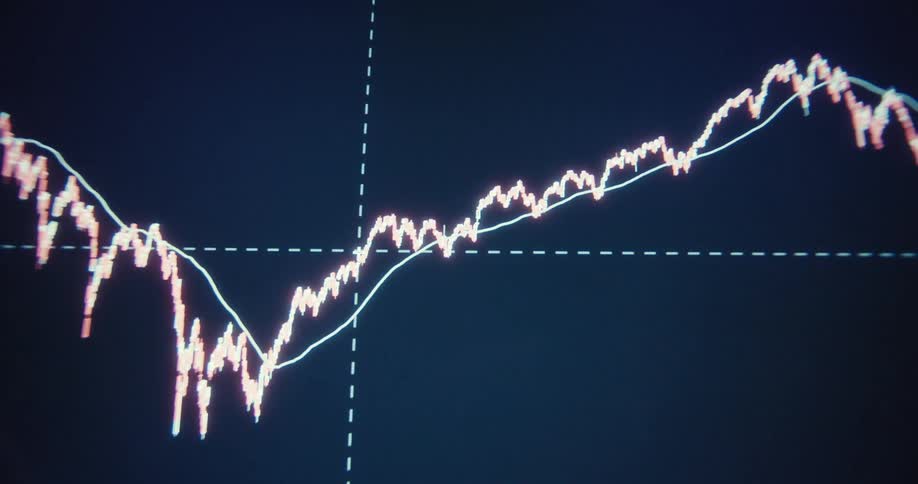
A stock price chart is displayed on a computer screen
Digital pixelated graph with positive trendline going up showing growth and financial strength of the global or US economy or an economical upward trend while making progress and profiting from business opportunities
A graph runs across the monitor
A view of graphs and lines on a screen
A close up view of financial data charts and graphs displayed on a screen with light distortions
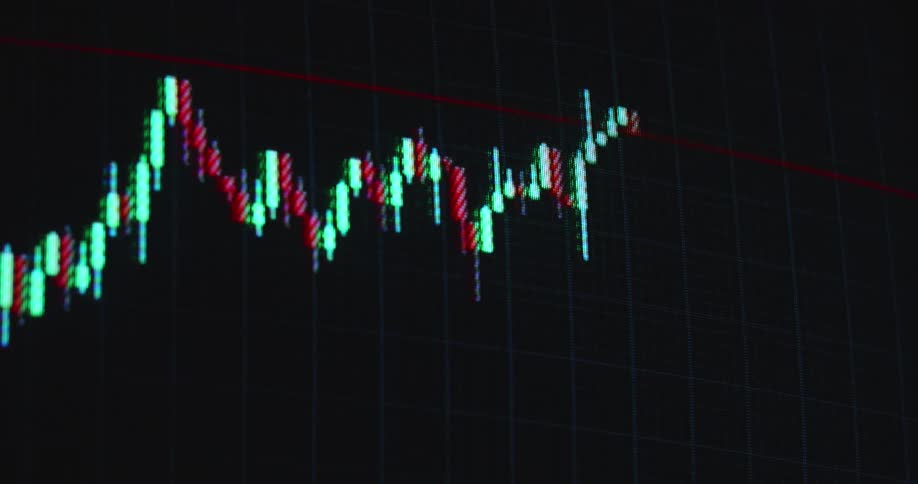
Tall green candlestick bars with thin white wicks rise against a dark background their sharp tops and bottoms hinting at sudden bullish spikes and shortterm volatility
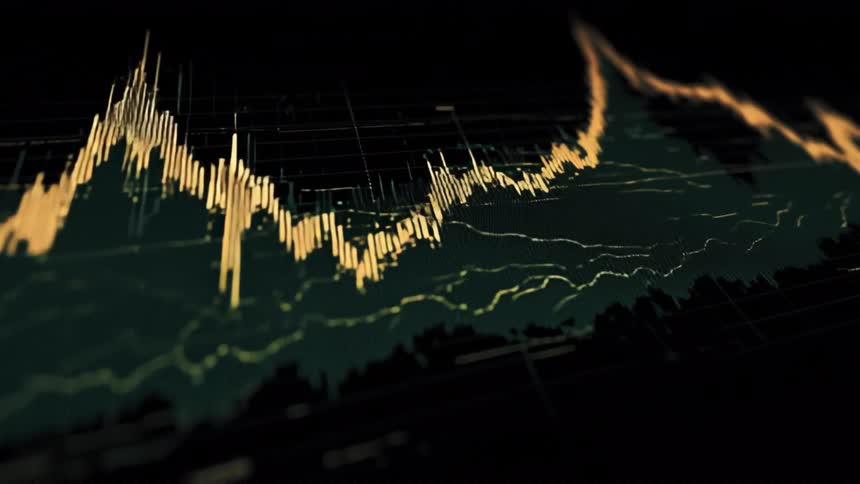
An angled closeup shot captures the dramatic peaks and valleys of a digital financial analytics chart with glowing yellow and green lines
A person is checking a graph on their phone
Colored line graph displayed on a screen changes as the data values change
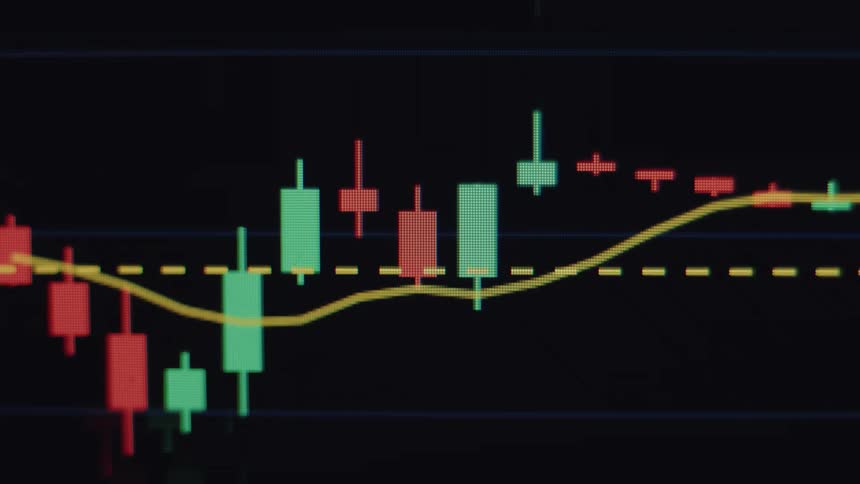
A detailed, close-up view of a live financial candlestick chart showing market volatility with moving green and red bars
A screen shows a financial chart with multiple lines and bars that fluctuate
Dynamic hand-held macro shot of pixelated screen showing stock trading chart or financial graph crashing with negative downward tendency falling into the red figures causing stress and panic with fear of economic recession
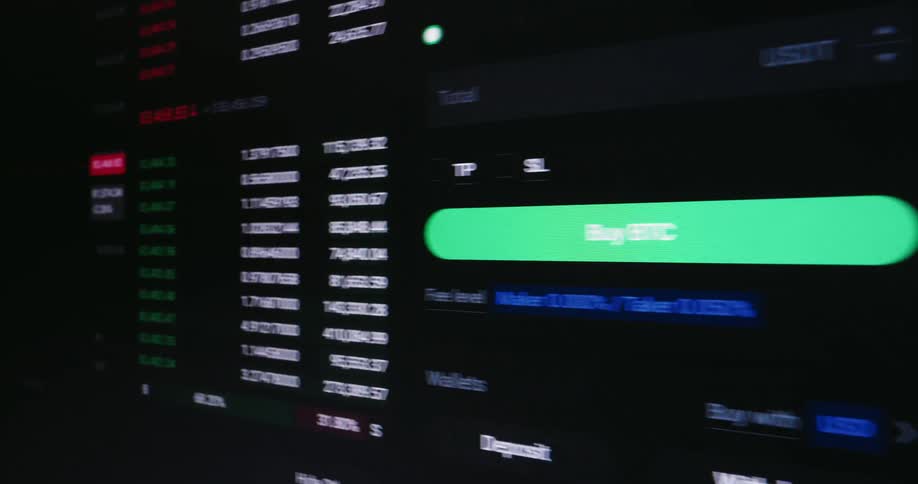
Screen scrolling left to land on the trading page for cryptocurrency
Information is listed all over the monitor
Digital financial data in background
Man wearing glasses observes financial charts on a screen with his hand on his chin
The financial markets get hit by a black swan event causing a massive crash or recession leading to a global economic crisis and great depression symbolized by a trading chart or graph that sharply falls into the red digits with dramatic downward movement
Abstract view of a glowing digital stock market chart with green and red lines moving against a dark background while purple and orange light flares streak across the screen
Pixelated screen of a vintage 90s computer displaying a green graph with an arrow pointing upwards symbolizing the beginning of the digital financial era and the first online trading platforms for buying stocks in the internet
A macro shot of a financial chart on a screen displaying a red 'Sharp drop' notification indicating a market crash
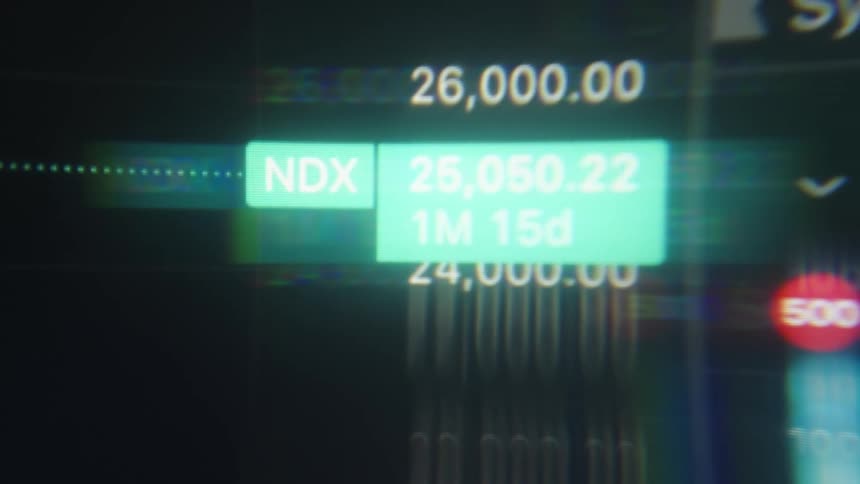
Dashboard showing ndx and spx indices with numerical values
A close up of numbers on a screen
Numbers representing stock information change on the screen
Close up of pixelated digital numbers and percentages scrolling across a screen
A cursor moves around the screen making adjustments to charts and tables
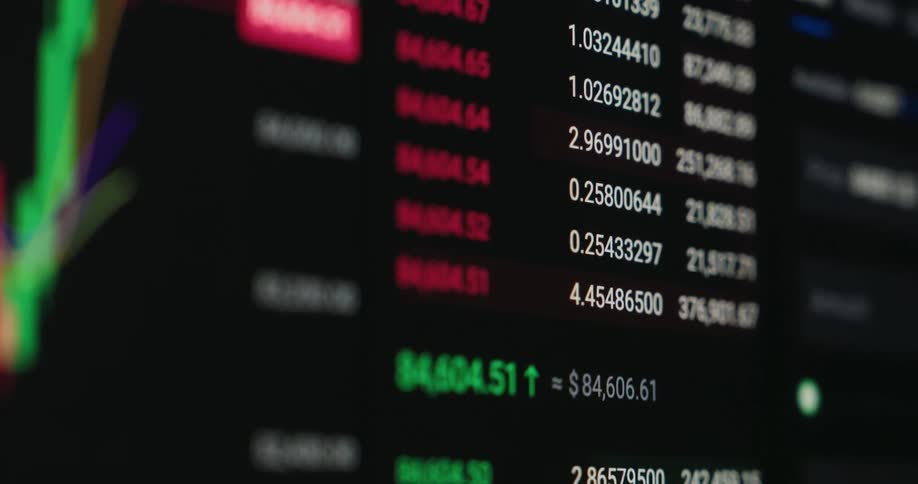
Screen showing graphs and values of cryptocurrencies
Red falling trading chart of an online stock broker or crypto exchange in a downward trend during a bear market crash and financial crisis symbolizing failure bankruptcy insolvency and losses caused by declining international and global economy
Locked off static extreme macro shot of graph that rises to infinity on vintage display device as symbol for financial success growth and freedom due to successful equity or crypto trading strategy by a stock broker of online exchange finance application
A wall made up of animated graphs
A close-up of a digital stock market ticker showing the fluctuating price of a security in green numbers
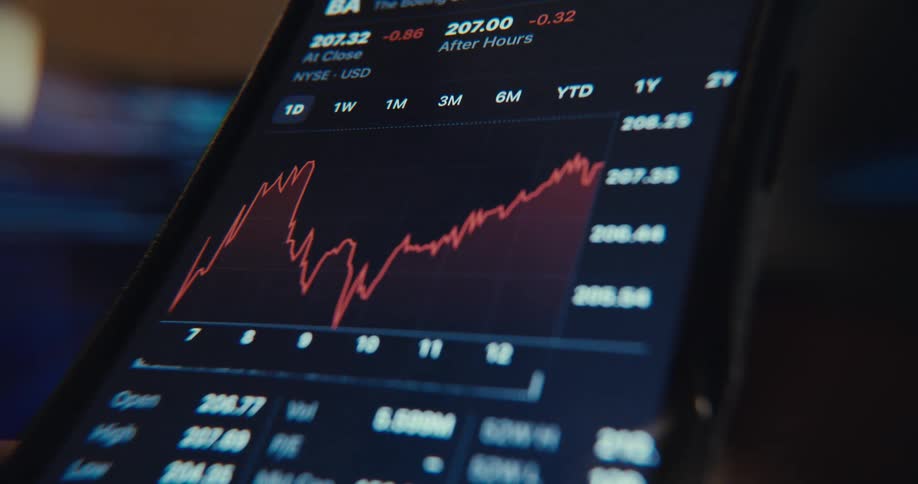
Closeup of a smartphone screen showing a fluctuating stock chart
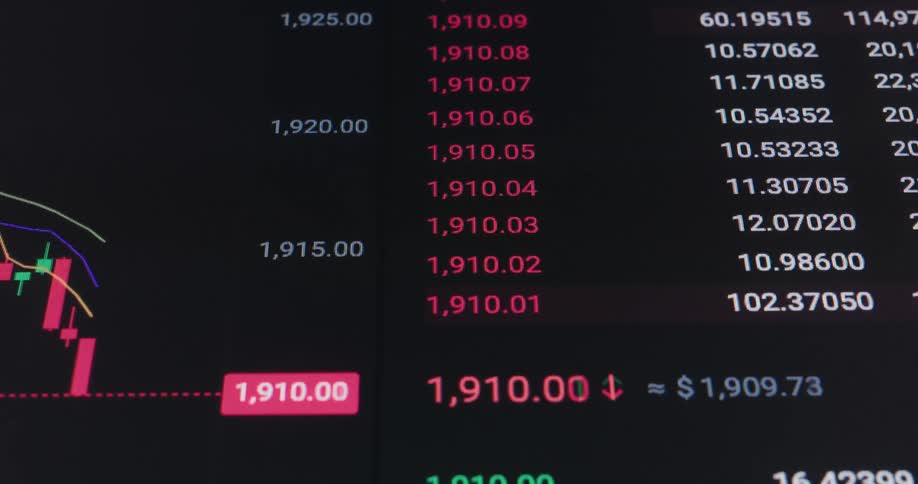
Frontal macro close up of computer monitor or screen panel displaying the user interface of a stock broker or crypto currency trading exchange as a financial investment chart or data graph is going down with a negative price development
Monetary values displayed on a dark digital financial interface
Closeup of a computer screen displaying realtime stock market charts and financial data
Financial charts with colored bars and lines displayed on a digital screen
Smartphone tracking the changes in stock price
A monitor displays a stock market candlestick chart with green and red candles moving across a dark grid
A dynamic motion graphics video shows glowing turquoise lines moving in a zig zag pattern across a dark digital grid
A closeup shot shows a digital screen displaying a financial graph with jagged lines fluctuating up and down in a rapid unpredictable pattern the camera pans along the digital chart showcasing the dynamic and complex movements of the data00
A close-up of a digital stock market screen showing a 24-hour low price amidst fluctuating financial data
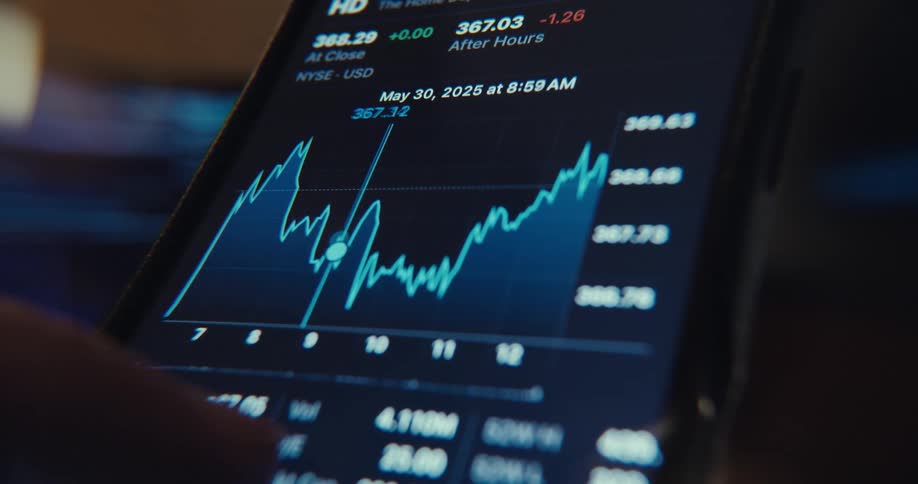
Finger points to a highlighted point on a line chart showing value variation
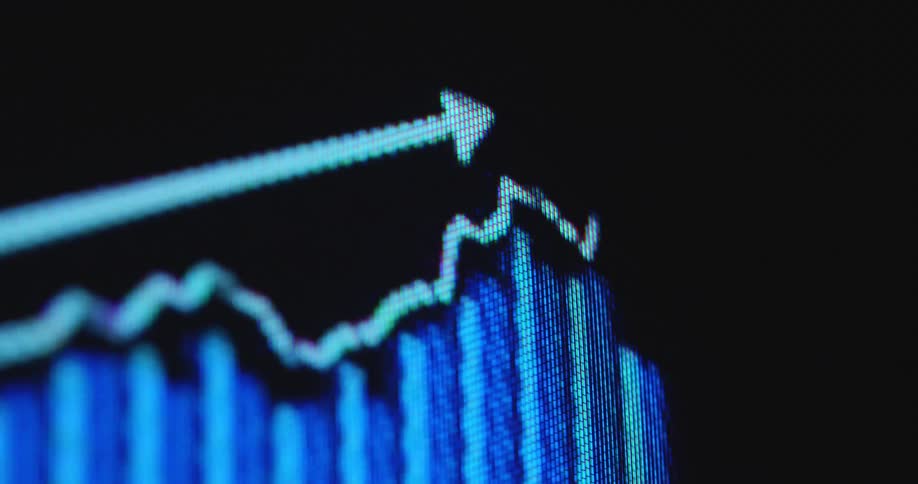
A red arrow moves upwards across the screen as a bar graph animation is forming beneath it presenting statistical data and visualizing the dramatic increase of prices and production costs
Screen displaying a chart and transaction buttons for stocks
Rows of information are on the computer screen

Need help finding the
right footage?

Have it delivered to your account within 1 business day.

This is Filmsupply

Our StoryOur FilmmakersArticlesFilmsPopular SearchesAll Categories

FM

A family of brands dedicated to empowering the creative.

FILMSUPPLY

Footage licensing for productions

MUSICBED

Music licensing for filmmakers

STILLS

Image licensing for creatives

© 2026 FM LLC.

Privacy PolicyLicense TermsTerms & ConditionsCareers