Musicbed
Filmsupply
Stills
Contact Us(800) 805-6802
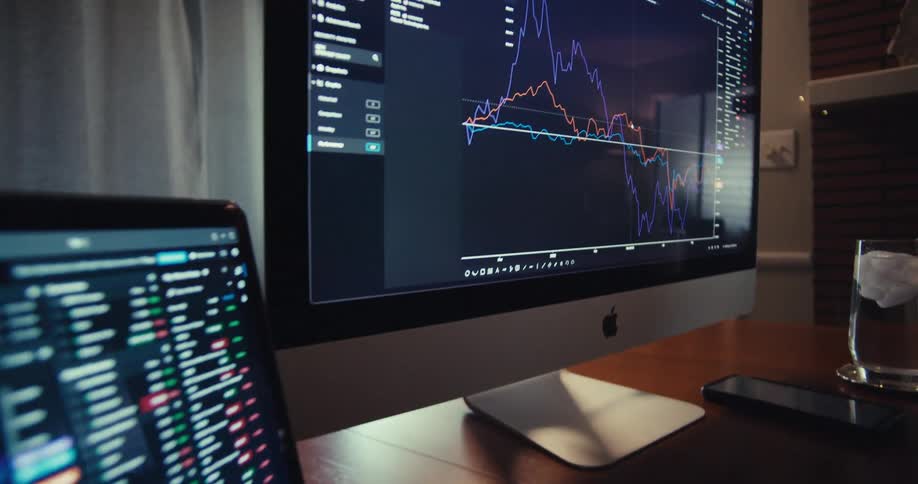
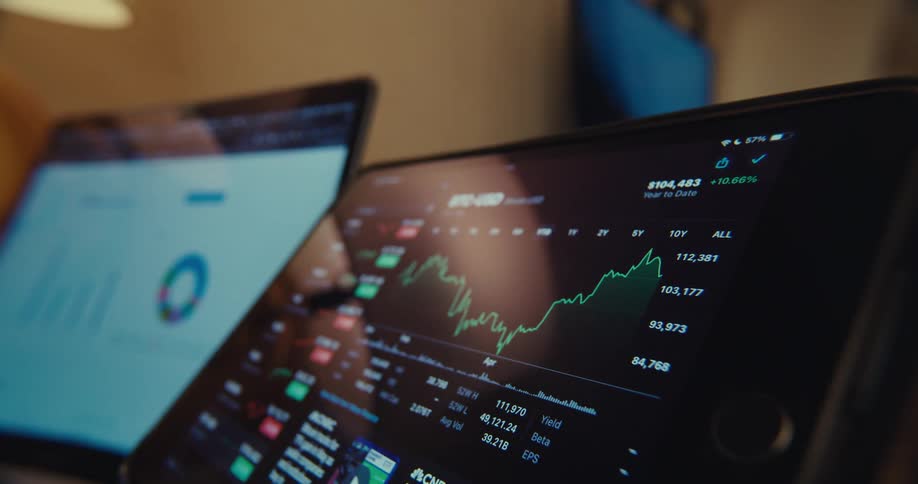
Closeup shots of computer and laptop screens showing realtime stock market fluctuations
Informational graphs cover the computer screen
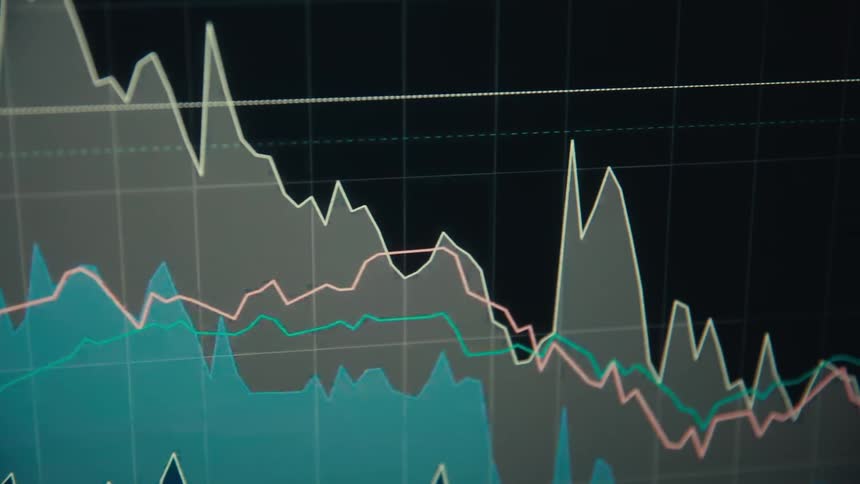
Blue colors the area under the line in a graph contrasting with the black background on a computer screen
Close up of a candle diagram stock chart pattern on a digital RGB TV screen consisting of pixels and green and red candles as the graph rises with a positive upward tendency symbolising financial success and share trading
A graph on a computer screen moves as it fills in
Digital black and white screen shows an animated graph with a rising line chart and vertical bars growing upward to indicate business development or financial investment success during a cooperate presentation with holographic overlay
Numbers and a graph are on the computer screen
A candlestick chart or trading graph animation showing a stock price or crypto currency rising over time with exponential growth and a positive trend or development on a dark computer screen with RGB pixels as symbol for a growing shares or bond market
A close view of a glowing computer screen displays colorful digital stock market charts and data with motion blur and light leak effects across the frame
A digital dashboard displays various animated stock market tickers charts and graphs in a dark mode interface
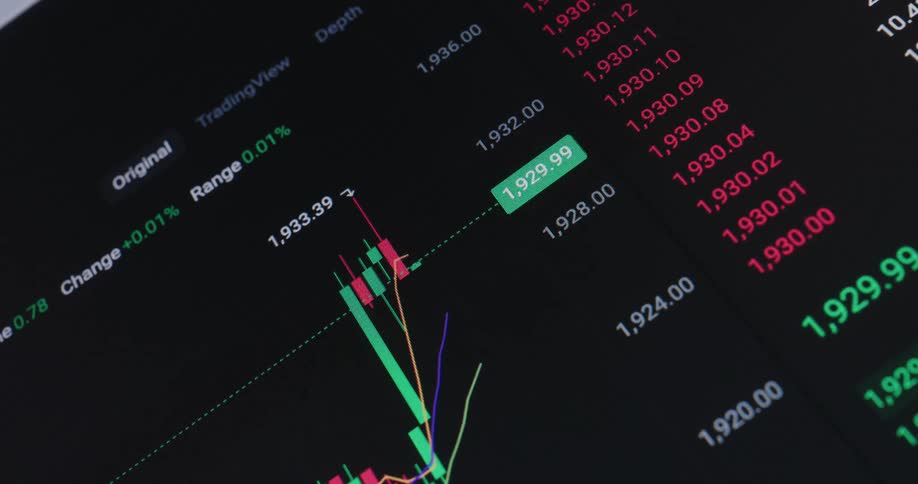
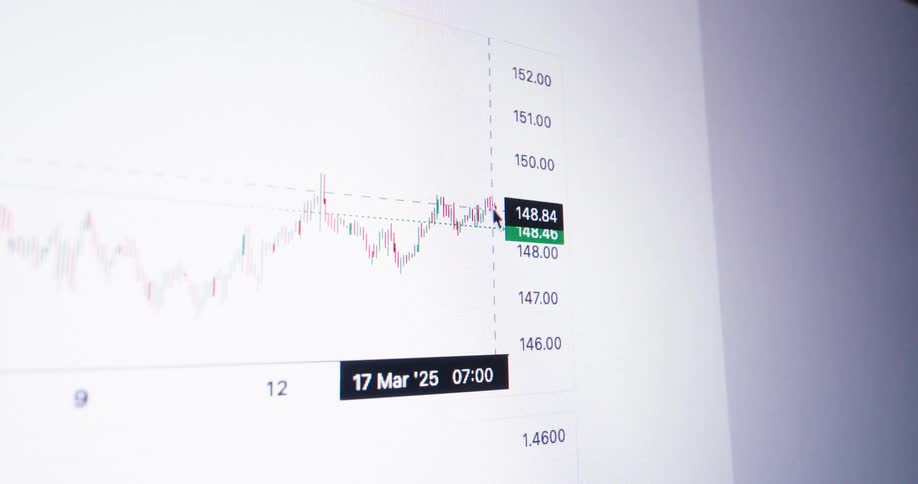
Closeup of a screen displaying a stock market chart
Digital candlestick charts hover over a swiftly moving surface of black streaked with blue and orange shades
A rapid blurry pan across a digital financial interface showcases glowing orange and teal bar graphs and fluctuating data lines that shift through heavy motion blur and vibrant light leaks
Dramatic macro shot of pixelated computer monitor showing a trading chart or financial graph crashing as the global economy is hit by a recession causing great depression and panic sales at the financial markets
A finger moves a dot along a graph
A closeup shot of a screen displaying fluctuating stock market graphs and numerical data
An interactive 3D data visualization scatter plot with colorful spheres is analyzed on a futuristic interface
Candlestick chart against a gray background
Extreme macro view of a digital screen with RGB pixels shows a black line graph with a downward pointing arrow overlaying vertical black bar charts representing a stock market crash or economic downturn with negative trend
The bar graph goes up and down across the entire computer screen
An animated retro-style green bar chart with digital distortion shows a steep decline on a dark screen
A shot shows a graph on a screen with data lines moving up and down
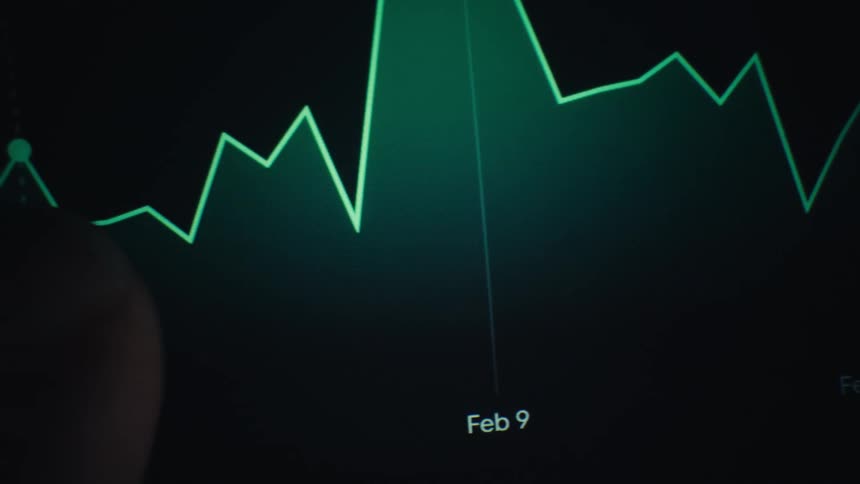
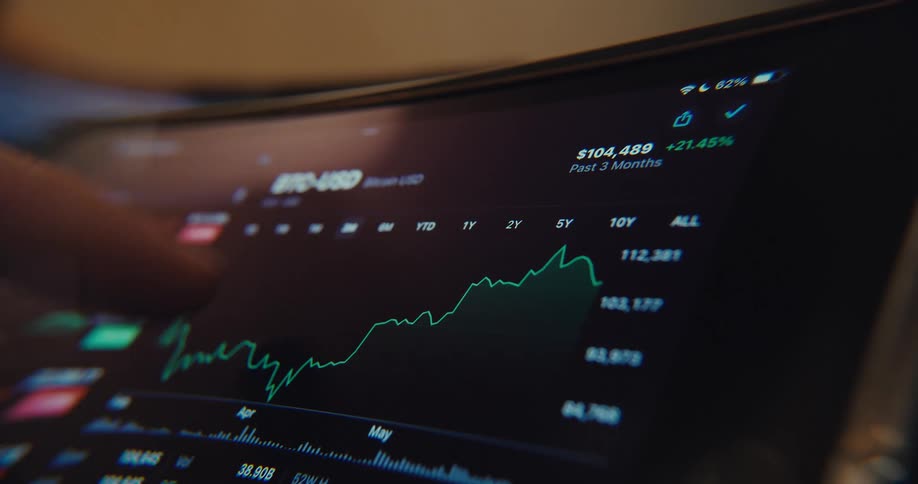
A computer screen indoors displaying a stock market price chart with a green line as a persons finger moves across it
An animated bar graph shows exponential growth with an upward trending arrow
Digital pen pointing to numeric values displayed on a dark financial interface
A dark screen with some numbers and letters written in white text
The numbers move fast on the monitor
This video features a closeup blurred shot of a digital stock market ticker displaying fluctuating financial numbers and percentages the motion blur and shifting colors of red and green create a sense of fastpaced abstract data movement
A closeup view of a stock market chart with red and green candlesticks fluctuating
A wall of graphs reflected on the floor
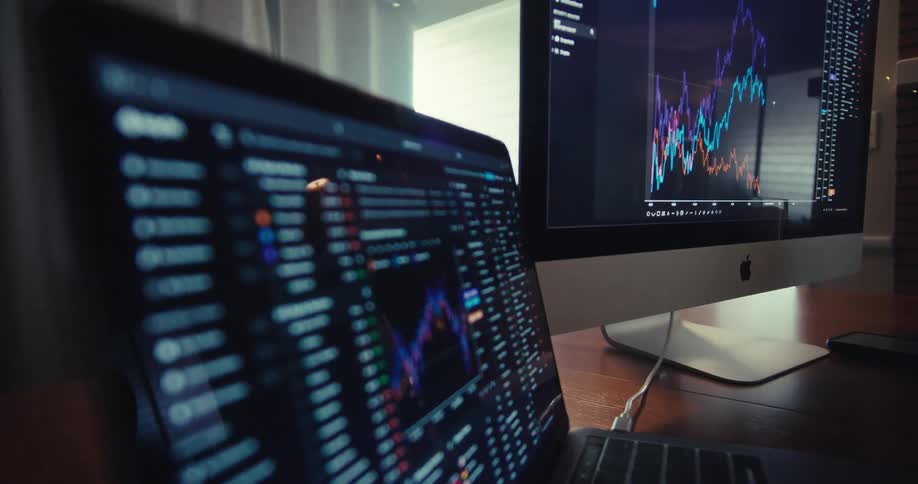
Computer monitors on a desk are displaying graphs
Blue and orange financial chart lines displayed on a digital screen
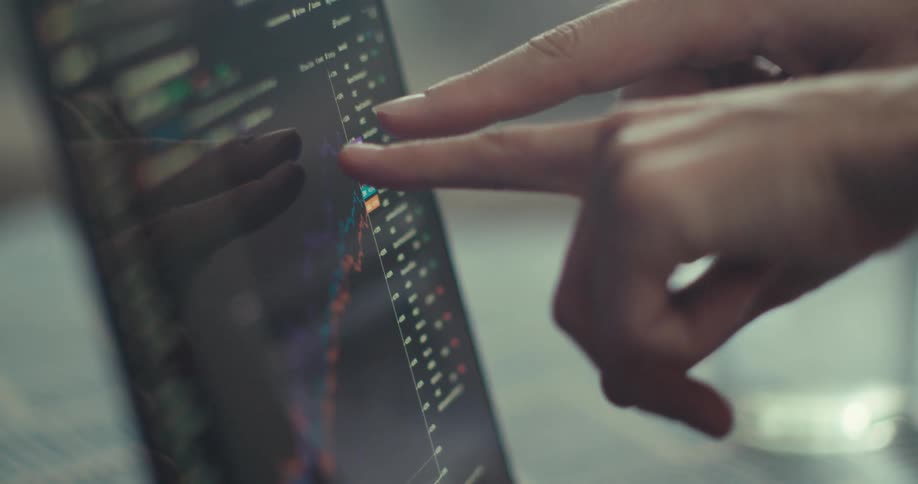
A finger points at a tablet screen displaying a fluctuating stock market graph
A close-up of a red, pixelated bar chart with an upward trending arrow animates on a black digital screen, indicating positive growth
A person is pressing the tablet
A closeup of a pixeled digital screen shows colorful animated data graphs and audio waveforms fluctuating against a dark background
Scrolling on a chart showing the fluctuation in a stocks price
Dramatic upward perspective of Bull Flag chart pattern as the green candles break resistance to the upside and the stock or crypto currency goes on price discovery with positive upward movement and trend displayed on monitor of a professional broker
A close view shows blurry digital graphs and stock market data with red and green bars moving quickly across a dark screen
Close up of a blurry device screen displaying a trading interface in green over a dark background
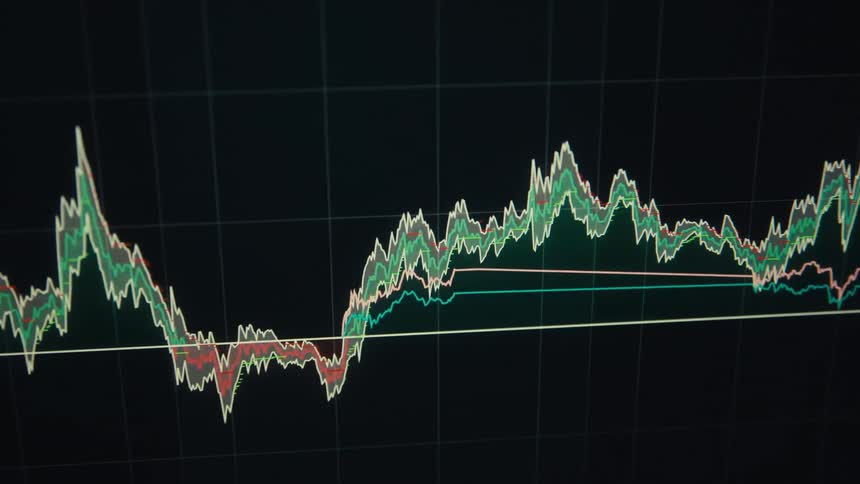
Market chart displaying shaded areas and colored lines representing financial fluctuations
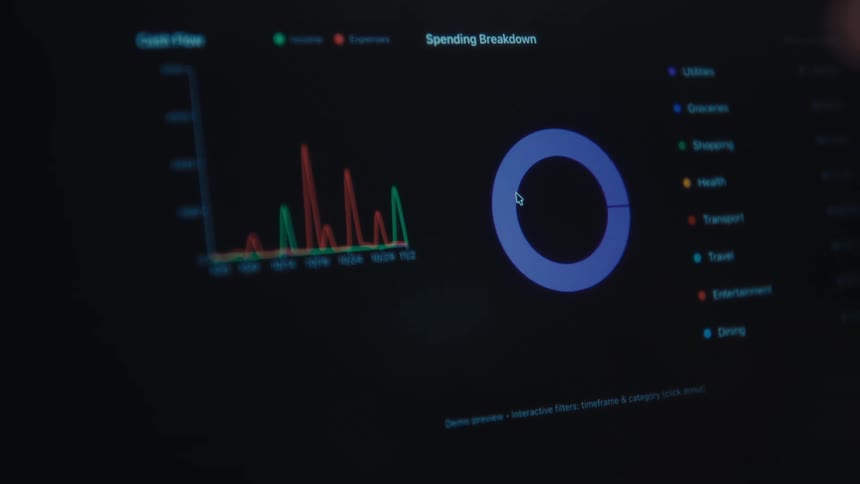
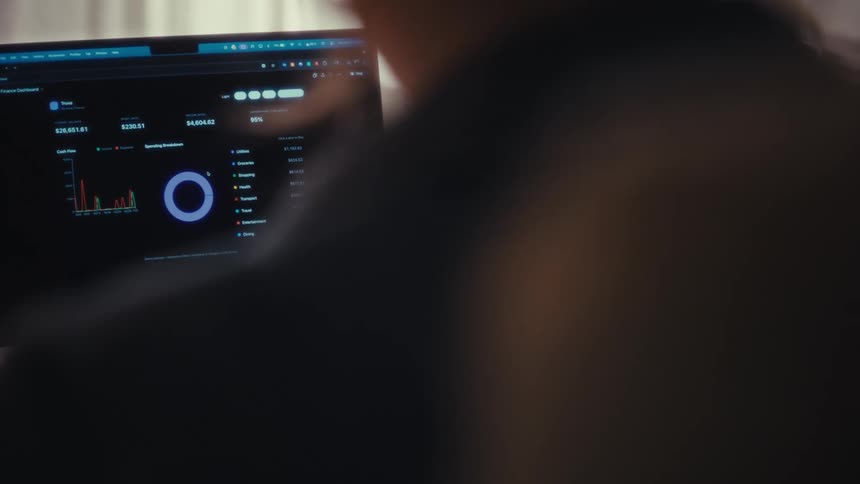
A close view shows a person viewing a laptop screen displaying a dark mode financial data dashboard with various charts and spending breakdowns
A close up of some green and red animation graphs
Macro close up of a red arrow that moves up across a pixelated screen as a financial trading graph is building beneath it symbolizing economic growth or rising stock prices or crypto currency trading as successful investment
An animated bar graph on a digital screen shows a steady upward trend and exponential growth
A large computer monitor shows a graph with zigzag lines and numbers
A stylized 3d animation shows a glowing candlestick stock chart with a strong upward trend on a futuristic digital interface
The numbers scroll by on the monitor
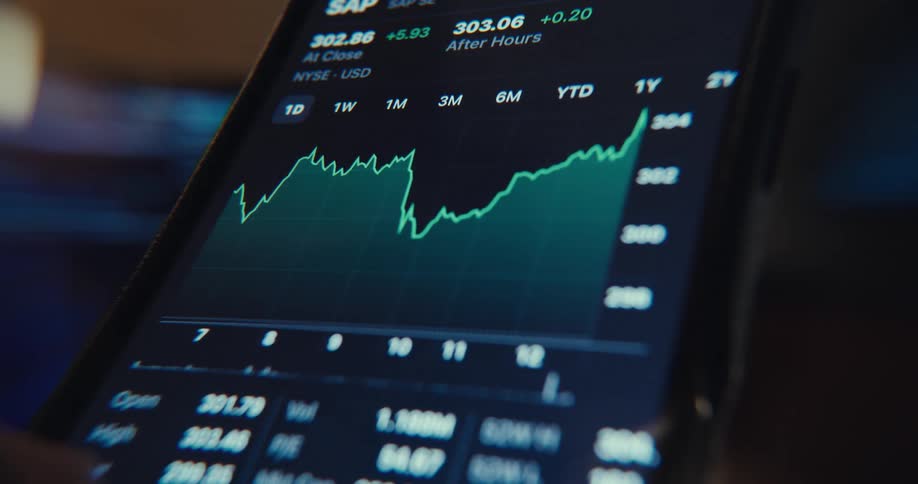
Finger interacting with a smartphone screen displaying a stock market chart
A screen shows a financial chart with green and orange bars moving up and down
The neon green pixels of a retro tube television screen display a sales chart or graph on a black background moving upwards representing a positive statistic and data for a corporate presentation
Colored line graph displayed on a screen changes as the data values change
Finger points to a highlighted point on a line chart showing value variation
A macro close-up of a digital screen shows an animated financial chart with a positive upward trend
Closeup of a monitor displaying a financial market chart
A black screen displays rows of monetary values in different categories in white text
Numbers grow on the graph displayed
A line graph is on the long monitor
A close up clip of a trading chart
A computer screen displaying a stock market candlestick chart with fluctuating red and green lines indicating market trends
Screen displaying prices for cryptocurrenciesincluding bitcoin and ethereumand stocks
Two computers display plots and graphs relevant to stock information
Hands of two people pointing at a laptop screen displaying a graph

Need help finding the
right footage?

Have it delivered to your account within 1 business day.

This is Filmsupply

Our StoryOur FilmmakersArticlesFilmsPopular SearchesAll Categories

FM

A family of brands dedicated to empowering the creative.

FILMSUPPLY

Footage licensing for productions

MUSICBED

Music licensing for filmmakers

STILLS

Image licensing for creatives

© 2026 FM LLC.

Privacy PolicyLicense TermsTerms & ConditionsCareers