Musicbed
Filmsupply
Stills
Contact Us(800) 805-6802
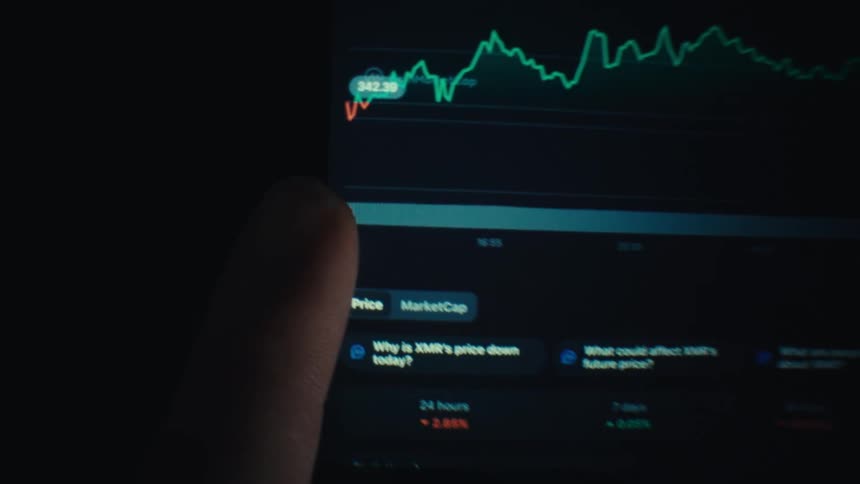
A finger scrolling on aglowing market chart on a screenthat shows fluctuating prices with sharp dips and recoveries
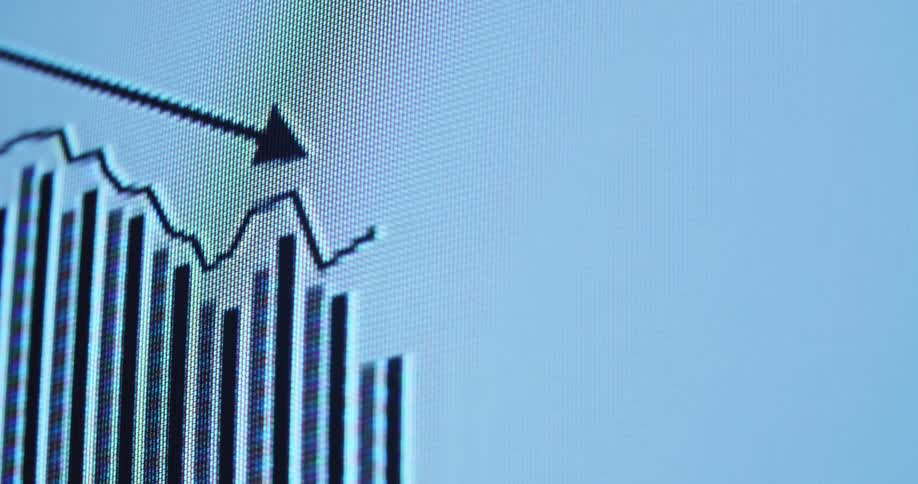
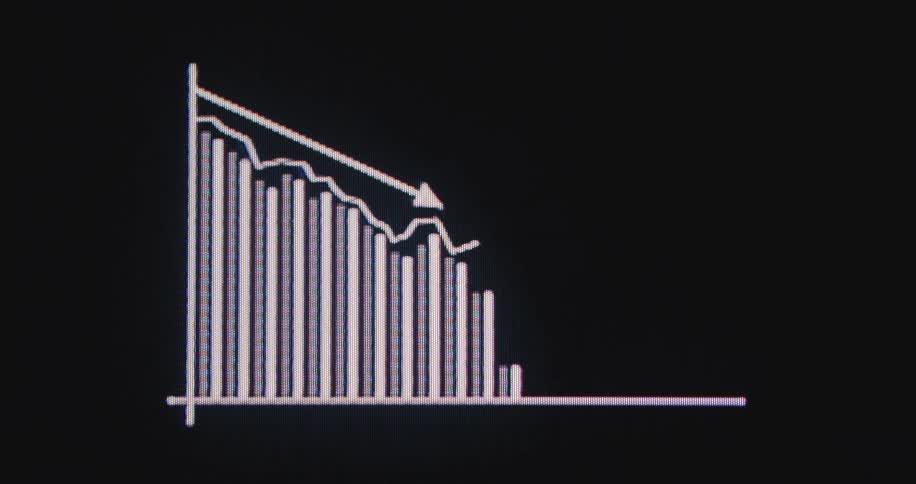
Extreme close-up of a declining financial chart on a digital screen with a downward-pointing arrow indicating a market recession
Close up view of a person looking at stocks
A fluctuating line graph appears on a digital screen with distinct peaks and troughs
Vintage 1990 computer screen displaying retro hourglass icon or symbol animation spinning as the time passes while waiting for the search algorithm or AI to load the results of a slow program or internet process
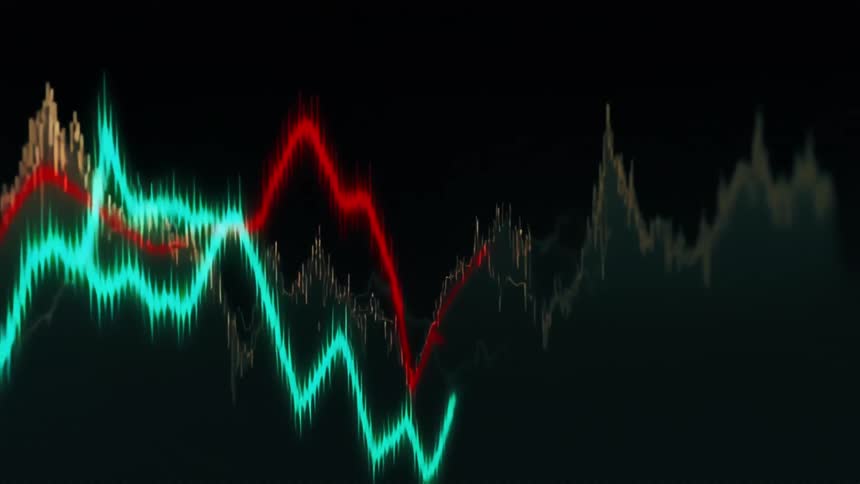
Multi line plot and a candlestick chart share a computer screen
Sharp decline shown in a financial chart animation played on a pixelated CTR computer screen as symbol for the financial crisis of the global economy in a dramatic downward trend with negative tendency as the numbers decrease
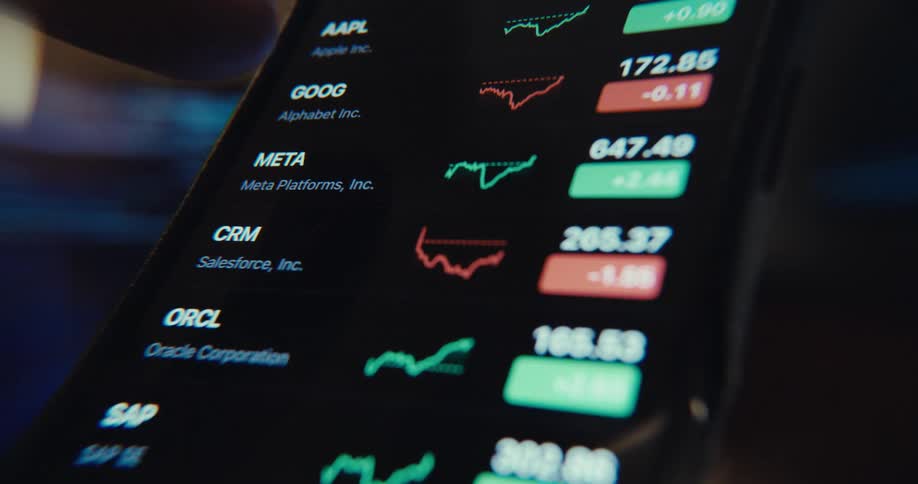
A person is interacting with a financial market app on a smartphone accessing the watchlist menu while viewing stock quotes
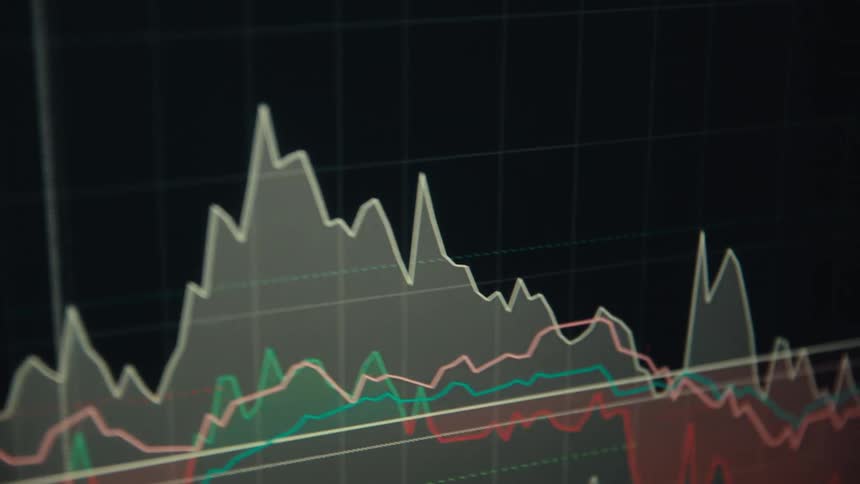
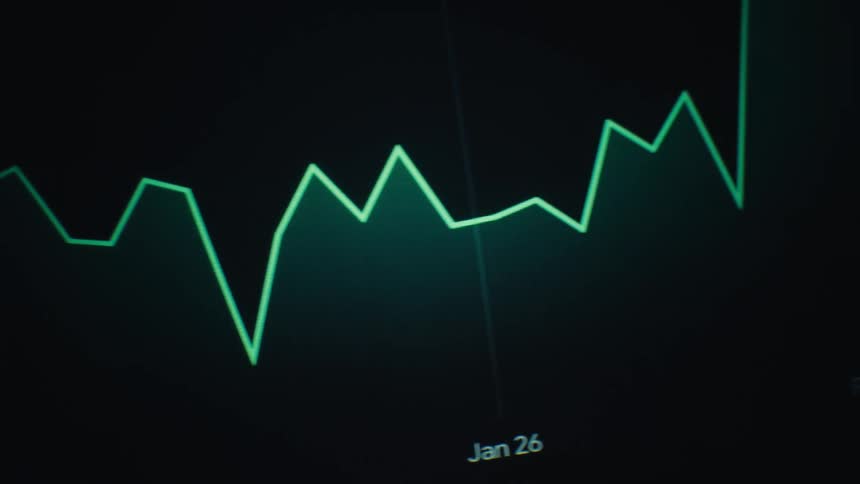
The primary visual is a dynamic jagged trend line that changes color and style throughout the clips in the initial shots it appears as a sharp white line tracing rapid price fluctuations later it shifts to a vibrant green glowing line that follows
This video features a closeup blurred shot of a digital stock market ticker displaying fluctuating financial numbers and percentages the motion blur and shifting colors of red and green create a sense of fastpaced abstract data movement
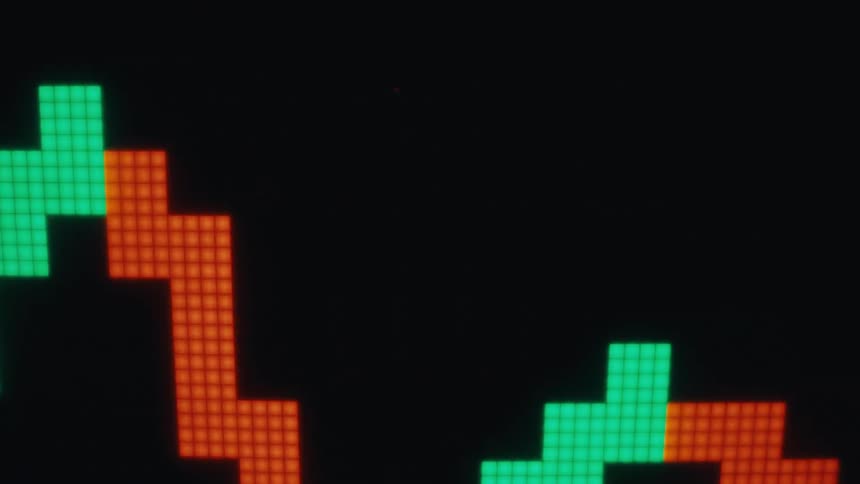
Green and orange colors of a candlestick chart contrast with the black background on a computer display
Television screen showing a no wifi symbol
Dramatic macro shot of pixelated computer monitor showing a trading chart or financial graph crashing as the global economy is hit by a recession causing great depression and panic sales at the financial markets
Closeup of a newtons cradle with polished metal balls in motion in a dark studio
Close up of a device screen as a person swipes through trading charts in a currency trading application
A screen shows a financial chart with multiple lines and bars that fluctuate
The financial markets get hit by a black swan event causing a massive crash or recession leading to a global economic crisis and great depression symbolized by a trading chart or graph that sharply falls into the red digits with dramatic downward movement
A graph of fluctuating stock data displays on a dark digital screen
A stock market screen displays a sharp decline in a candlestick chart alongside a list of trading data
A display showing charts of a stock price
Pixelated zigzag line with green and red blocks on black background
A pixelated green bar graph on a black screen displays a downward trend, symbolizing a financial market crash and economic decline
Green digitized grid lines move across the black vintage tube TV screen as a green line graph rises and falls symbolizing value increase and financial loss on digital online trading application platform that enables market analysis and risk management
A closeup shot of a digital screen displays a fluctuating red line graph representing market data while a white stylus pen moves across the surface near a circular light reflection
A close up view of a computer screen displays fluctuating orange and red line graphs against a dark background
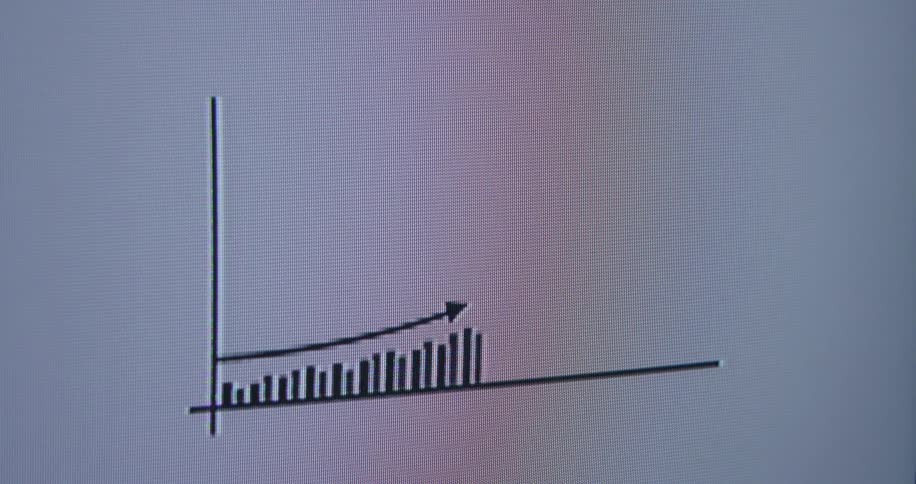
Pixelated bar animation or sales chart with an upward line represents continuous growth over time as the value increases during financial data presentation due to positive development or great business performance with economic success
Swiping on the smartphone
A neon turquoise line moves in a zig zag pattern on a dark background
A stock chart on a computer screen
Red and blue candle chart
A persons finger is scrolling on a digital screen that displays a fluctuating financial line chart showing a downward trend
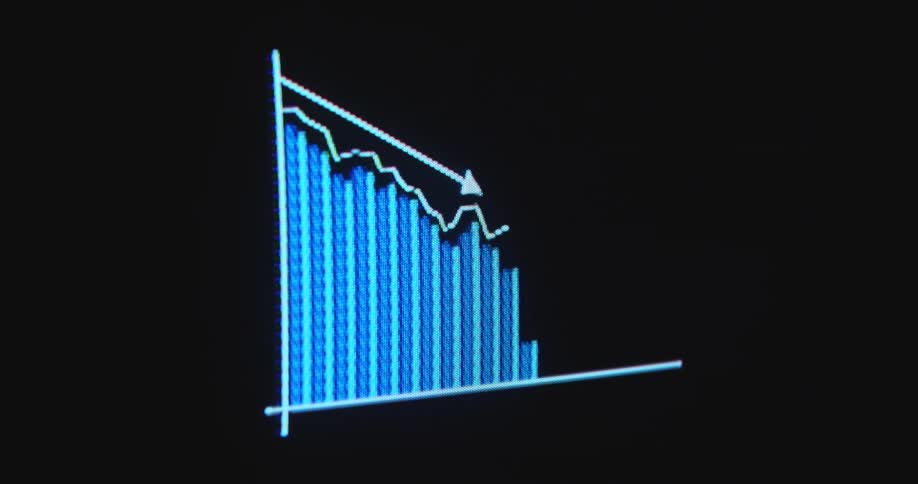
A minimalist animated bar graph on a dark screen shows a steady decline in values with a downward arrow
Person touching a screen of an electronic device
Glowing green and red digital line graphs display financial data on a dark background
A closeup digital screen displays a fluctuating stock or financial chart
A dark video shows blue green and red stock market line graphs on a computer screen against a grid
A macro view of a digital screen shows a black animated graph with a falling line chart and a downward pointing arrow overlaying vertical bar charts representing a market decline or financial loss on a white background
Extreme macro closeup of a tube TV screen displaying several hourglasses spinning and rotating as the waiting period starts and ends over and over again while the waiting time takes forever due to very slow progress and low speed
A line graph shows fluctuating stock data shifting into a rising trend against a dark background
Informational graphs cover the computer screen
A monitor displays a stock market candlestick chart with green and red candles moving across a dark grid
Closeup of a digital screen displays changing percentages highlighted in red and blue
Extreme close-up of a digital screen showing a red bar graph and arrow trending downwards, illustrating a financial crisis or market crash
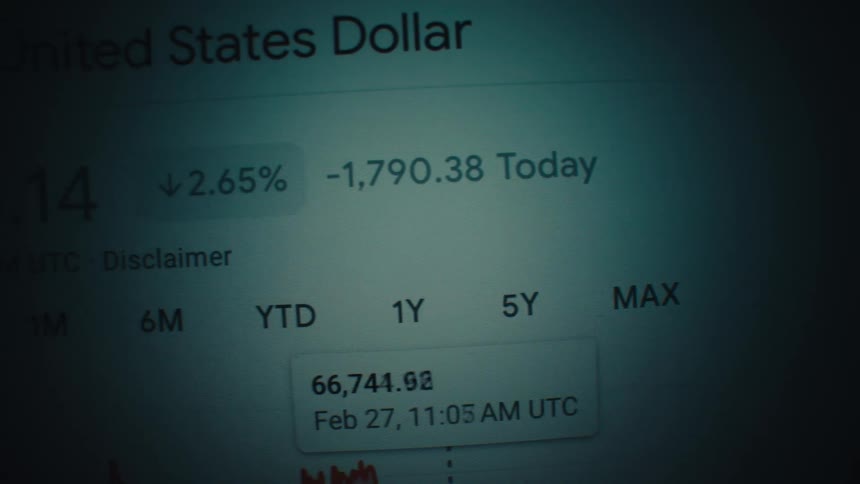
A financial page displays a significant drop in value for the united states dollar during the day
A finger scrolls through a touchsceen
Closeup of a screen displaying a stock market chart
Volatile candlestick chart rises and falls to bottom of screen due to dramatic market crash or collapse causing panic and global economic recession providing great trading opportunities for day-traders that view volatility as opportunity and buy the dip
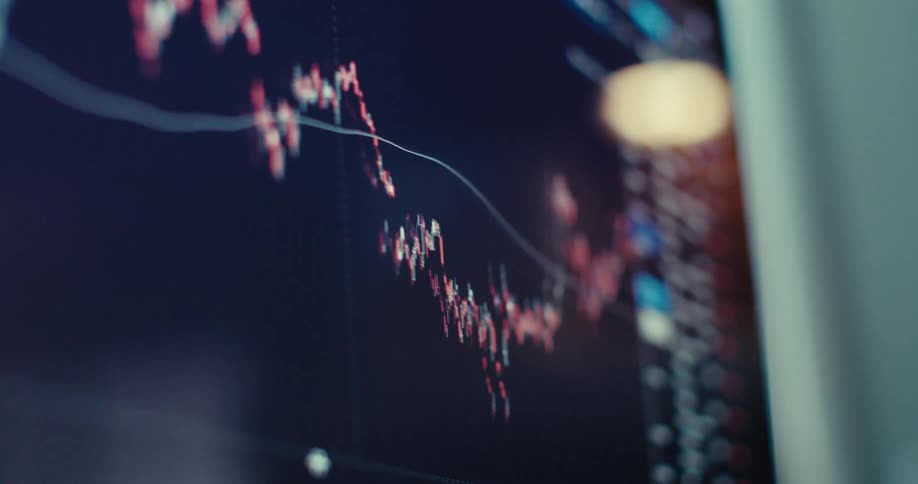
A downwardtrending blurry line graph is displayed on a tilted screen in a dimly lit setting
Digitized grids and numbers move across the screen
An angled closeup shot captures the dramatic peaks and valleys of a digital financial analytics chart with glowing yellow and green lines
Overlapping line and candlestick charts display intense financial fluctuations
Dramatic macro close up with shaky camera movement of a screen showing animated financial trading chart or business statistic with negative outlook prediction or development in neon green retro colors
Multiple data points at different values are continuously plotted next to a candle chart of a stock or crypto currency trading graph in a finance application or app on a dark pixelated computer screen
A computer screen displaying a stock market candlestick chart with fluctuating red and green lines indicating market trends
Screen displaying candle chart
Close-up of a pixelated screen showing an animated bar graph with a positive upward trajectory
Black and white loading bar sign or message is displayed on futuristic retro TV or computer screen indicating the load level of an ongoing accumulation or searching process of a search algorithm based on artificial Intelligence
Colorful candlestick chart against a background
Locked off static extreme macro shot of graph that rises to infinity on vintage display device as symbol for financial success growth and freedom due to successful equity or crypto trading strategy by a stock broker of online exchange finance application
A blue arrow moves across the screen while a graph with statistic bars builds beneath it with a downward or negative trendline visualizing the lowering or sinking of costs or financial income data during a corporate presentation
A computer screen with a graph on it
An animated bar graph with a descending trend line indicates a financial crisis or recession
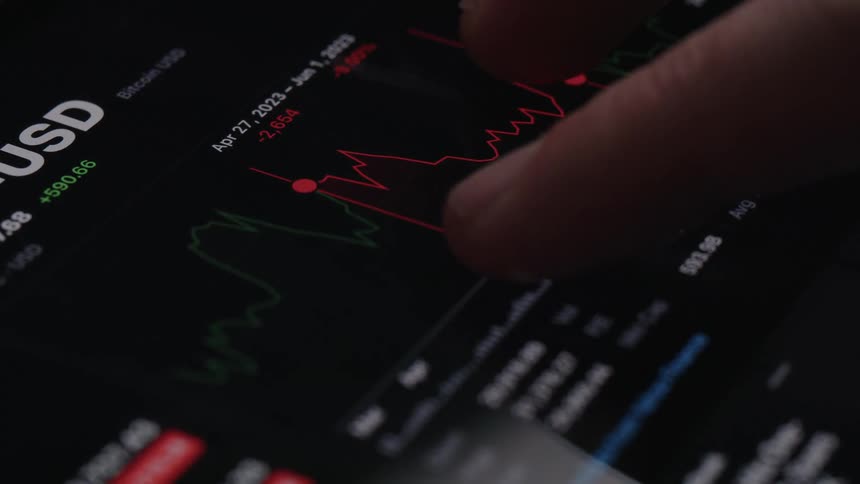
A person traces the graph on his tablet

Need help finding the
right footage?

Have it delivered to your account within 1 business day.

This is Filmsupply

Our StoryOur FilmmakersArticlesFilmsPopular SearchesAll Categories

FM

A family of brands dedicated to empowering the creative.

FILMSUPPLY

Footage licensing for productions

MUSICBED

Music licensing for filmmakers

STILLS

Image licensing for creatives

© 2026 FM LLC.

Privacy PolicyLicense TermsTerms & ConditionsCareers