Musicbed
Filmsupply
Stills
Contact Us(800) 805-6802
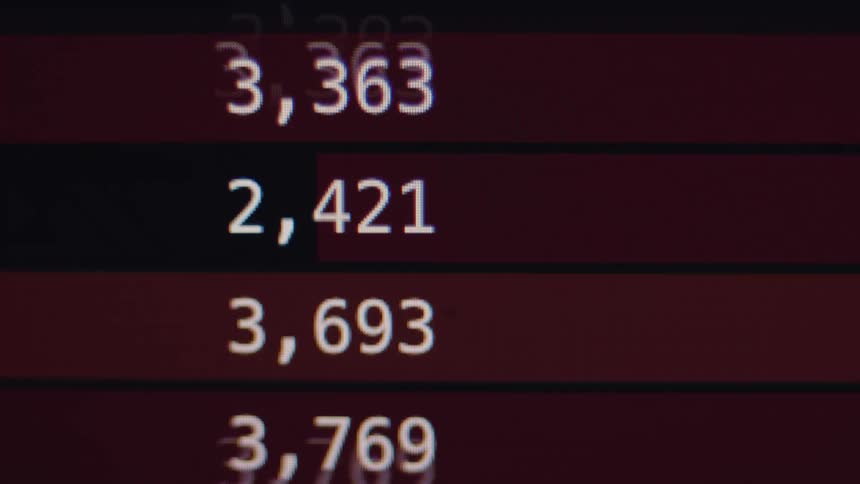
An extreme close-up of a digital display shows columns of rapidly changing financial or statistical data with visual glitches
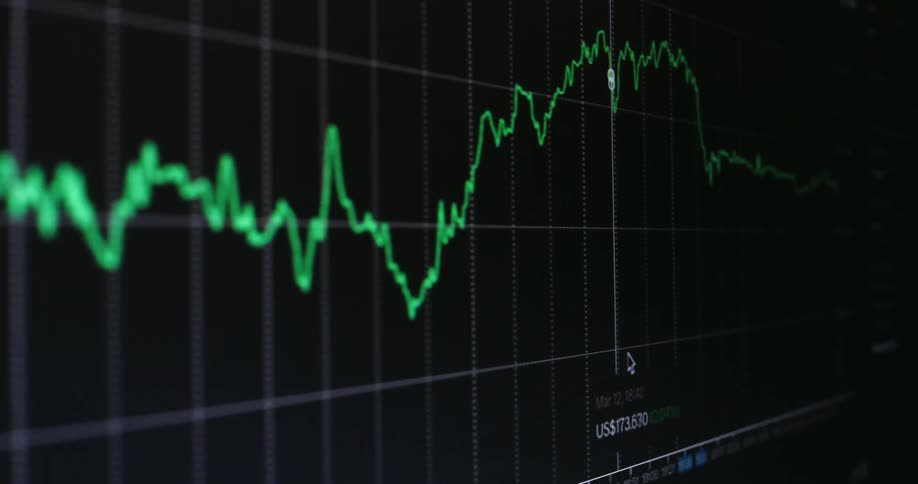
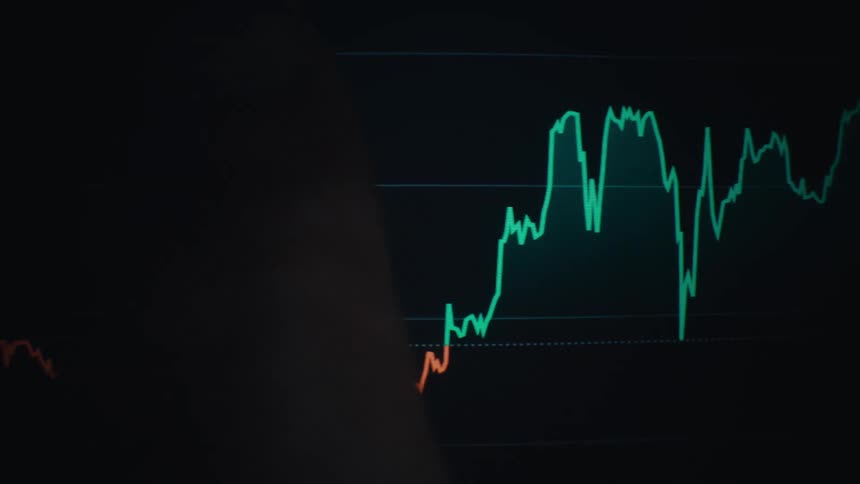
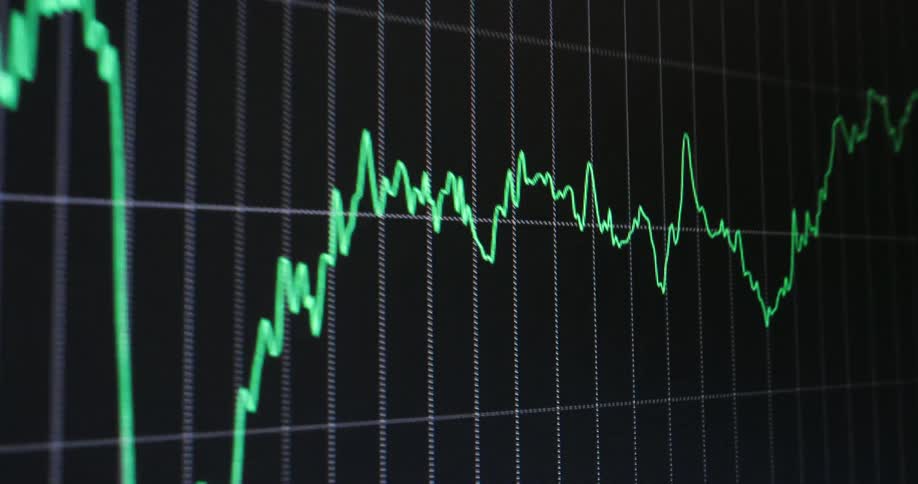
Green line displays digital information against a black background
A close view of a glowing computer screen displays colorful digital stock market charts and data with motion blur and light leak effects across the frame
Projection on a screen of abstract triangular shapes
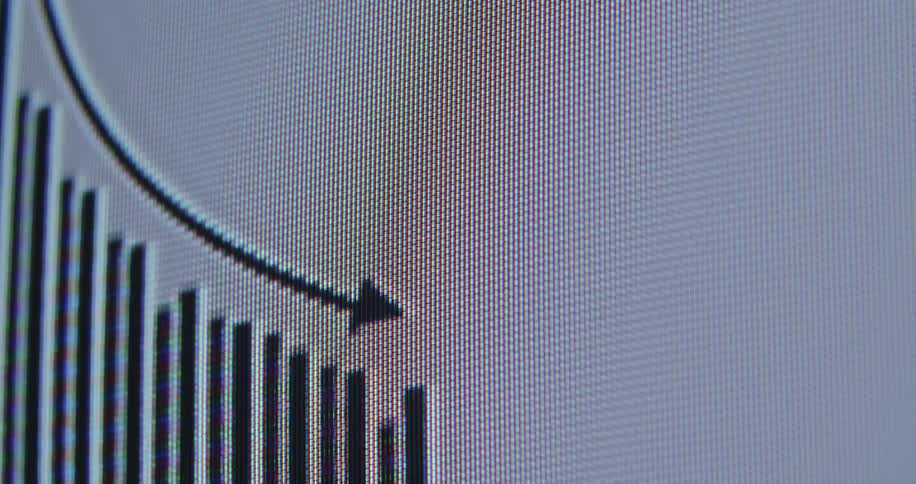
A digital chart with a downward-pointing arrow slowly pans across a screen, symbolizing economic decline
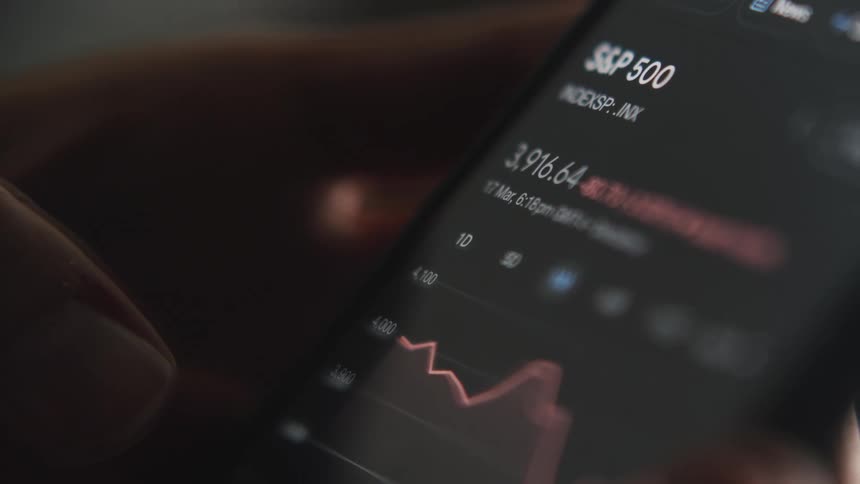
An up close of a persons finger using a cellphone and tapping the screen
A line on a graph moves up and down as it travels across a screen
A line graph is on the computer monitor
Price chart of a stock displayed on a screen
Stock price bar chart displayed on pixelated computer monitor of a broker as the market crashes and the prices of the assets go down with a negative trend and a falling arrow indicating a decline in value and a recession with shaky movement
A red and green line graph depicting a sharp decline is prominently displayed on a dark background suggesting a financial downturn and loss
Price variation chart with green and red lines showing financial values
Blue and orange financial chart lines displayed on a digital screen
A stylized digital animation of a rotating DNA double helix made of colorful bars on a pixelated screen
Close-up of an animated financial bar chart on a screen showing a downward trend
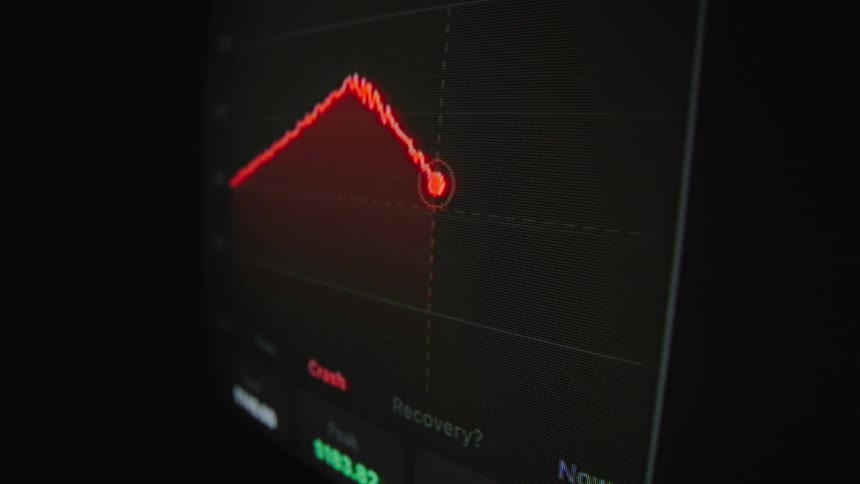
An animated red bar chart on a black digital screen shows a steep financial decline with a falling arrow
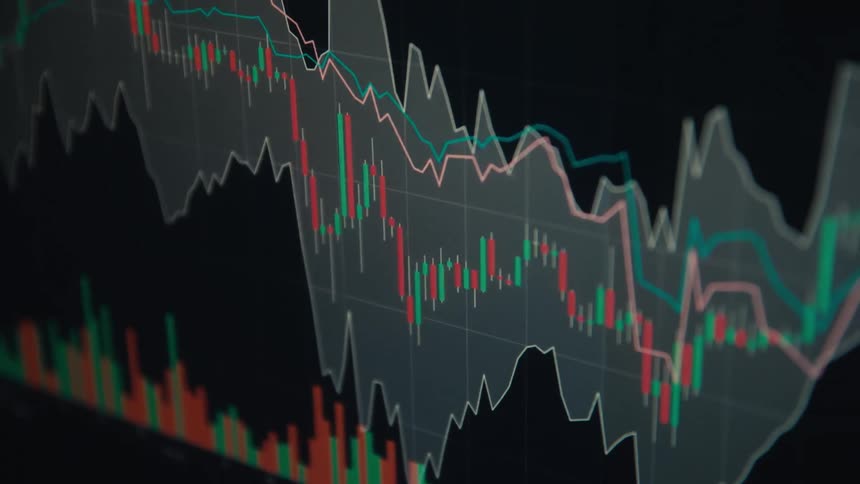
A monitor displays a stock market candlestick chart with green and red candles moving across a dark grid
Close up of a device screen as a person swipes through currency charts in a trading application
A closeup shot shows a digital screen displaying a financial graph with multiple colored lines representing different market trends the camera pans slowly from right to left revealing the volatile jagged movements of the lines as they shift up and dow
The pixelated computer screen shows the financial market reacting to a black swan event such as 9/11 causing a global economic crisis and crash followed by recession and great depression as the stock market collapses
Closeup of a monitor displaying a financial market chart
A closeup shot of a screen displaying fluctuating stock market graphs and numerical data
Green rectangles form a plot against a black background on a digital screen
A red fluctuating line graph rises across a blue digital screen toward a glowing targetlike marker
The neon green graph forms an old 90s computer screen showing a vintage user interface of a stock trading platform or exchange as the commodity and equity prices crash and a global recession hits the finance markets
Red falling trading chart of an online stock broker or crypto exchange in a downward trend during a bear market crash and financial crisis symbolizing failure bankruptcy insolvency and losses caused by declining international and global economy
Dynamic macro close up of a RGB pixel device screen displaying multiple rotating overlapped hourglass timer icons while the sandglass symbol visualizes the concept of time in a black abstract and digital space
A digital graph on a screen shows a volatile stock price or cryptocurrency value fluctuating up and down, indicating gains and losses
Finger points to a highlighted point on a line graph showing variations in financial values
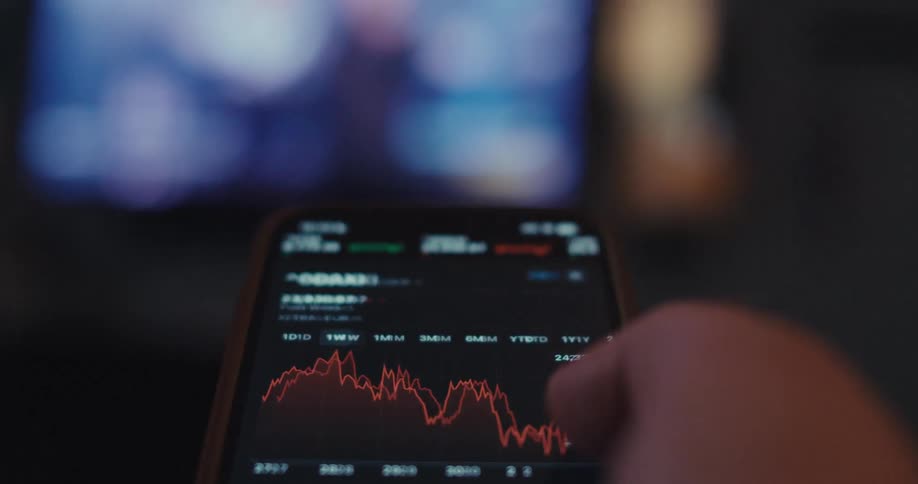
In a dimly lit room a finger scrolls through a fluctuating red stock market graph on a smartphone with a television glowing in the background
The line travels across the computer screen
Numbers and a graph are on the computer screen
Red lines grow on a screen
A finger scrolls a glowing market chart on a screen that shows fluctuating prices with sharp dips and recoveries
Three variations of an animated digital bar graph show a downward trend, symbolizing financial loss or decreasing statistics
Close up view of a person looking at their phone
A blurry stock line graph slopes downward against a blue background
A smartphone screen displays various stock market charts rapidly changing between green upward trend and red downward trend graphs for different companies and indices
Screen displaying the financial market chart in candles
Macro shot of a financial chart on a computer screen indicating a downward trend with a black arrow
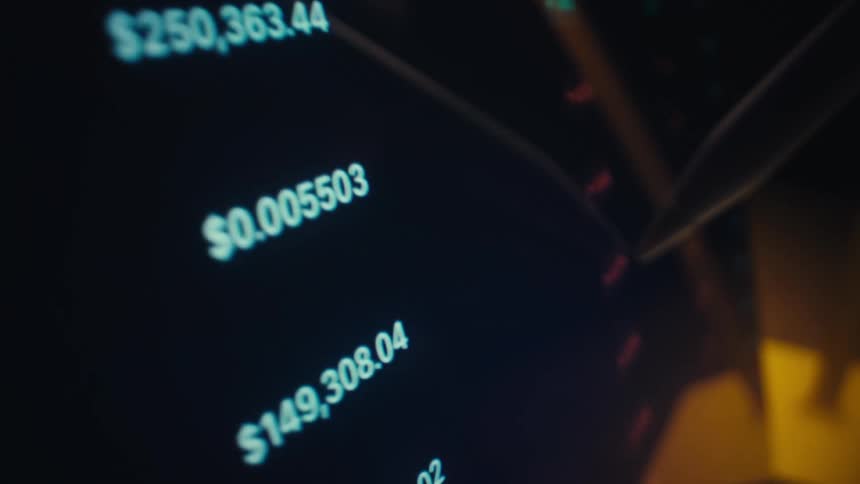
Digital pen pointing to numeric values displayed on a dark financial interface
A financial chart shows a volatile market trend with sharp rises and dips over time
People walk by the line graph on the monitor
A financial chart on a screen shows a sharp daily drop highlighting market volatility and loss
A close-up of a red, pixelated bar chart with an upward trending arrow animates on a black digital screen, indicating positive growth
Pixelated computer screen showing animated data in red trend line graph with negative downward movement symbolizing the stock market crash from 1987 or any other financial crisis causing a meltdown of the global economy
A stock price chart is displayed on a computer screen
A finger swipes along a tablet
Closeup of a digital trading graph with fluctuating lines and bars on a screen
The financial markets are crashing due to a recession making stocks and shares drop and go down in price with decreasing value symbolized by a falling candlestick chart with red candles on a RGB pixel screen with black background
Blue colors the area under the line in a graph contrasting with the black background on a computer screen
Close up of a screen displaying a trading interface with candlesticks and other trading indicators
Computer monitors are showing graphs and data
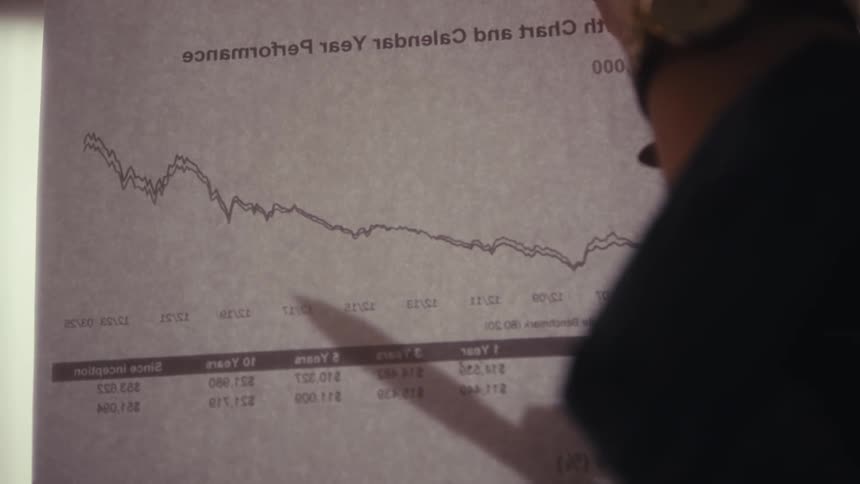
Person points to a specific section of a declining chart printed on paper
A close-up of a digital screen shows a green bar chart with a downward arrow indicating a decline
Digitized trading graph crashes and falls down as the stock market collapses with a negative downward tendency into the red digits providing opportunities for new stock brokers and investment strategies in the equities or crypto currency market
Cardiac event monitor machine displaying a green heart rate line moving from left to right on a dark screen
Close-up on a digital stock market chart showing a sudden and dramatic price crash after reaching its peak
An animated bar graph on a digital screen shows a steady upward trend and exponential growth
Swiping on a phone to see different charts
The line moves up the graph
A graph runs across the monitor
A close up of numbers and charts on a screen

Need help finding the
right footage?

Have it delivered to your account within 1 business day.

This is Filmsupply

Our StoryOur FilmmakersArticlesFilmsPopular SearchesAll Categories

FM

A family of brands dedicated to empowering the creative.

FILMSUPPLY

Footage licensing for productions

MUSICBED

Music licensing for filmmakers

STILLS

Image licensing for creatives

© 2026 FM LLC.

Privacy PolicyLicense TermsTerms & ConditionsCareers