Musicbed
Filmsupply
Stills
Contact Us(800) 805-6802
A close view shows blurry digital graphs and stock market data with red and green bars moving quickly across a dark screen
An animated heartbeat is monitored on a retro green grid screen with complex data analysis overlays
An animated candlestick chart on a digital screen displays fluctuating stock market or cryptocurrency data and analytics
A price chart of stocks is displayed on a computer screen
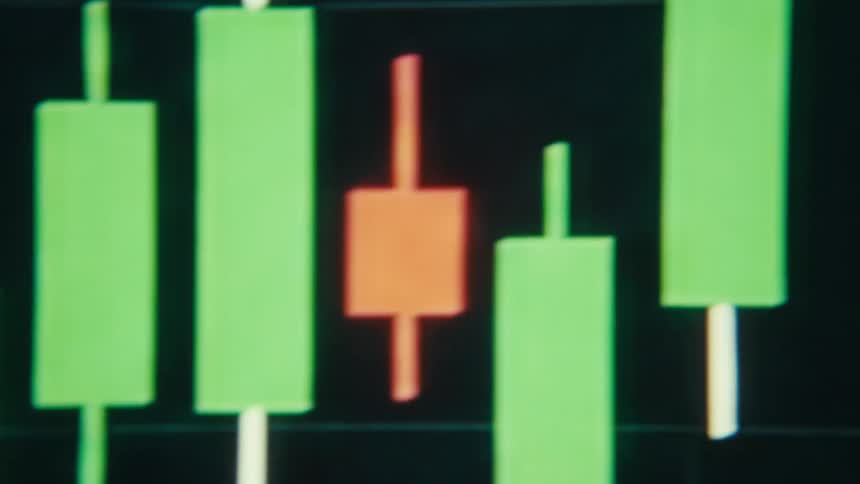
Green and orange colors of a candlestick chart contrast with the black background on a computer display
Closeup shots of computer and laptop screens showing realtime stock market fluctuations
A fluctuating blue digital chart line trends downwards in a dark, abstract macro shot
Blue static lines play on a television
Glowing blue lines on a graph move across a dark screen
Candle chart in a digital system
Dolly Out Shot of a Blue AI Neural Network - Abstract Data Flow - Machine learning - Nodes and Lines
A screen glitches out
Extreme macro close up of green and red candles with long wicks of user interface of trading application show the price of a stock or crypto currency going down with a negative trend symbolizing volatility and price action or movement
A black screen with various codes in different colors flashing by rapidly
A blurred, close-up, and stylized animation of a digital stock market chart with glowing lines and fluctuating data
Dna is displayed as a spinning double helix
Financial chart bars in green and red tones with blur
Colorful abstract wave of digital pattern and light against a dark background
A graph is on the monitor
Multiple rows of graphs and numbers quickly scroll by on a screen
An abstract, glowing line graph fluctuates over a blurred candlestick chart, visualizing the volatility of the financial stock market
Symmetrical audio or music sound equalizer animation or motion graphic being displayed on a screen with black background and visible RGB pixels symbolising the sense of hearing or sound perception in the digital age
Screen displaying bearish financial market graph as candlestick chart crashes while stock and crypto currency markets decline and assets lose their value due to drastically decreasing and falling prices causing panic sales and recession with volatility
Stock price bar chart displayed on pixelated computer monitor of a broker as the market crashes and the prices of the assets go down with a negative trend and a falling arrow indicating a decline in value and a recession with shaky movement
A person swipes through monthly performance data on a colorful bar graph displayed on a tablet screen using a stylus
Snippet of code displayed on a computer screen
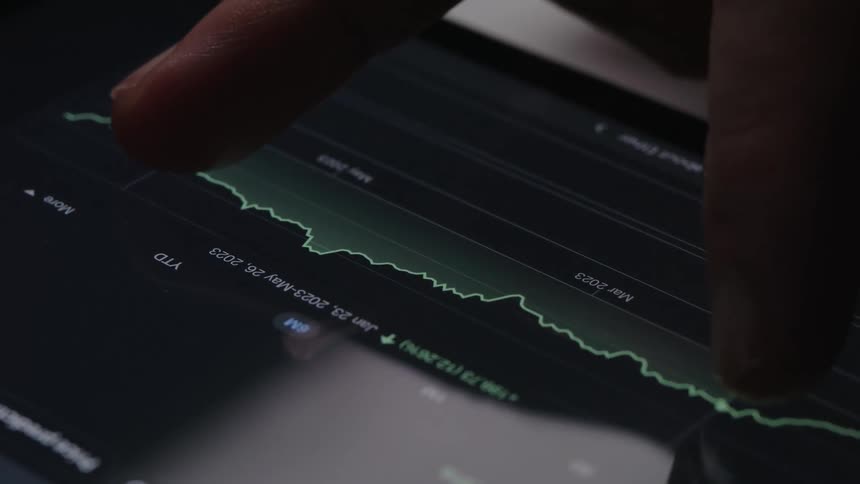
A finger scrolls through a stock market chart on a smartphone in a closeup shot
A stock chart on a computer screen
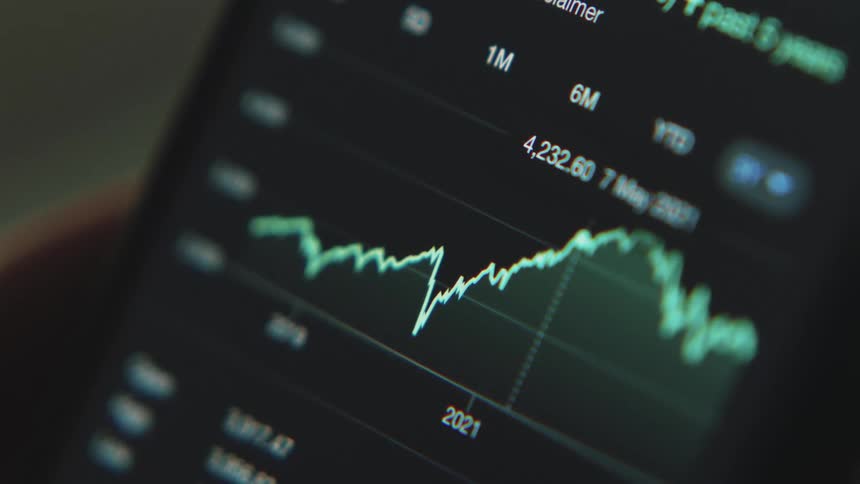
A graph speeding through the evolution in price of a stock over several years
Abstract extreme macro close up of the RGB panel of a retro tube TV or computer screen with visible pixels displaying an EQ animation as the sound bars are pulsating to the music on a dark background symbolizing the levels of sound
Person working on a portable electronic device with a touch screen
Words on a newspaper
A rapid blurry pan across a digital financial interface showcases glowing orange and teal bar graphs and fluctuating data lines that shift through heavy motion blur and vibrant light leaks
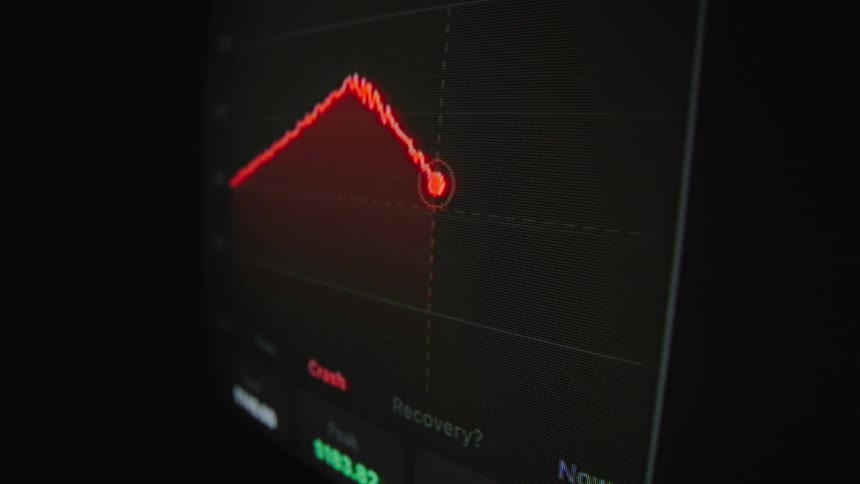
Close-up on a digital stock market chart showing a sudden and dramatic price crash after reaching its peak
Extreme close-up of an interactive digital graph on a computer screen analyzing height and weight data
Chart of rising and falling candles against a blurred background
Extreme close-up of a digital stock market display showing volatile price fluctuations in real-time
A computer screen displaying a stock market candlestick chart with fluctuating red and green lines indicating market trends
Closeup of a display containing a graph and a few spots of glare
An out-of-focus close-up of a live stock market or cryptocurrency candlestick chart showing real-time price fluctuations
A stylized 3d animation shows a glowing candlestick stock chart with a strong upward trend on a futuristic digital interface
A stock market candlestick chart with technical indicators is displayed on a screen
A close up of some green and red animation graphs
Financial candlestick chart on a screen indoors
A stylus points at colorful fluctuating line graphs displayed on a digital screen suggesting data analysis or market tracking
A stylus pointing at a glowing financial chart on a dark digital screen emphasizing data analysis and market trends
Extreme macro close-up of a pixelated candle of candlestick trading chart changing between the colors green and red as symbol for volatility and uncertainty in the financial markets while the price of the stock or cryptocurrency rises and falls
Shaky hand-held extreme closeup with dynamic camera movement of green stock graph or trading chart on a moving screen with RGB pixels
Candlestick trading chart showing upward movement in the financial market as the value of the MSCI World or SP 500 ETF increases as symbol for economic growth and success with dramatic upward perspective and no camera movement
Dynamic handheld close-up of animated trend line graph moving up and down from positive to negative price performance on a dark pixelated screen with green grid in the background
A monitor displays a stock market candlestick chart with green and red candles moving across a dark grid
Blurry close-up of a digital screen displaying a live stock market candlestick chart with fluctuating prices
A screen where there is a trading chart with red and green lines that are going up and down and there are numbers on the right side
A glowing line graph showing fluctuating financial data
Close-up of a green audio waveform on a digital timeline with a red playhead scrolling across
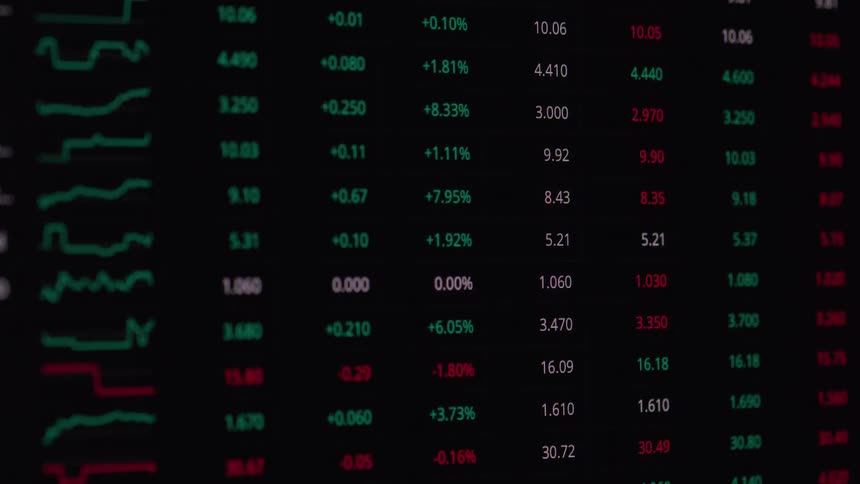
Close up of a device screen displaying a trading interface table scrolled through
A close-up of a digital screen showing a green bar graph and arrow trending upward, indicating positive growth and financial success
The artwork on the display is different charts flying by
The stock trading investment graph moves upward and downward while changing direction and color from neon green to red when it goes from positive to negative during the market cycle including bull run and bear market
Red and blue candle chart
A person uses their tablet to check stocks
The animation is playing on the television screen
Digital display shows graph and data points

Need help finding the
right footage?

Have it delivered to your account within 1 business day.

This is Filmsupply

Our StoryOur FilmmakersArticlesFilmsPopular SearchesAll Categories

FM

A family of brands dedicated to empowering the creative.

FILMSUPPLY

Footage licensing for productions

MUSICBED

Music licensing for filmmakers

STILLS

Image licensing for creatives

© 2026 FM LLC.

Privacy PolicyLicense TermsTerms & ConditionsCareers