Musicbed
Filmsupply
Stills
Contact Us(800) 805-6802
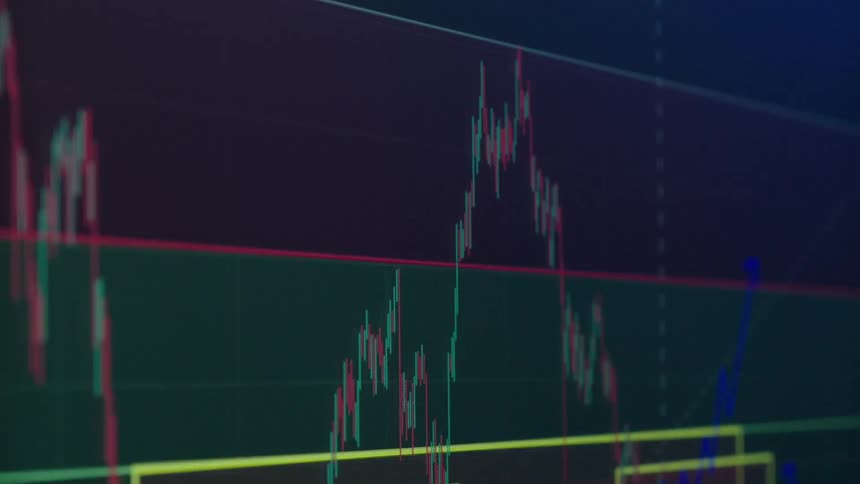
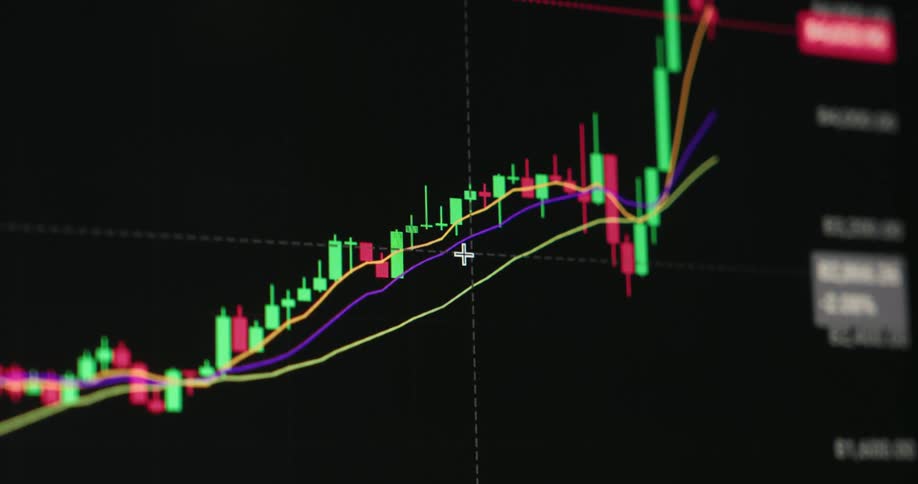
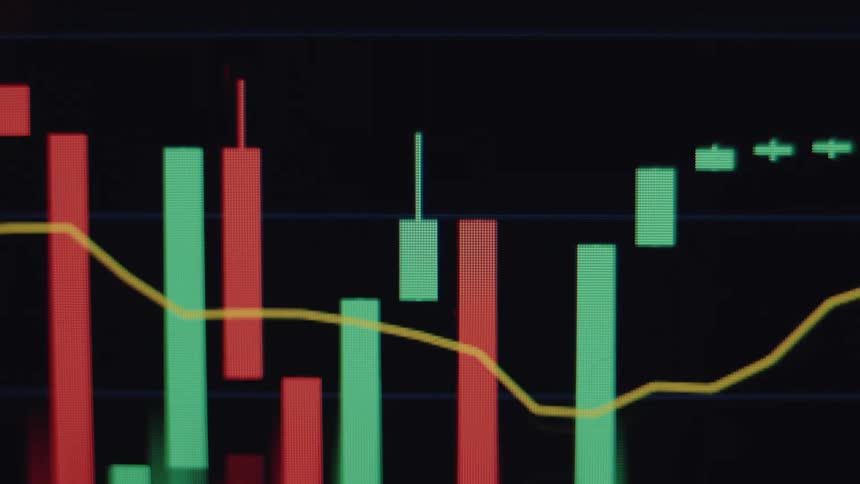
FilmmakersMyles ShankStock Market Charts And GraphsA glowing line graph showing fluctuating financial data
A glowing line graph showing fluctuating financial data

A glowing line graph showing fluctuating financial data

Filmmaker

Myles Shank

Clip ID

755697

Releases

Commercial Use, Editorial Use

00:08
 Anamorphic

Select a license

Don’t see what you’re looking for? Just call us or email us and we can get the exact license you need.

Footage From The Same Shoot

View All

Similar Footage

A cinematic, out-of-focus macro shot of a real-time stock market candlestick chart on a digital screen
Financial candlestick chart on a screen indoors
A bullish candlestick chart pattern moves on the computer monitor with visible pixels as the bull flag breaks resistance to the upside causing massive surge and gain for investors and traders trading stocks and crypto currency coins or tokens online
An out-of-focus close-up of a live stock market or cryptocurrency candlestick chart showing real-time price fluctuations
Series of candlestick stock prices displayed on a screen
Screen displays pink and green graph lines on a grid
A financial chart with red and green bars and colored lines is displayed on a dark screen
A blurry, abstract animation of a candlestick chart showing stock market or cryptocurrency volatility on a digital screen
A candle diagram graph plots an array of data on a pixel screen with numbers representing rising and falling real estate prices or changes in the stock market or crypto currency finance sector
A shallow depth of field close-up captures a vibrant, fluctuating candlestick chart on a digital financial trading screen
A colorful, stylized animation of a financial candlestick chart displays market volatility on a digital grid
The video features a closeup cinematic shot of various financial data charts and candlestick graphs flickering across a digital screen it captures the fastpaced atmosphere of stock market trading through shifting focus and vibrant multicolored data v
An abstract, out-of-focus close-up of a live cryptocurrency or stock market candlestick chart with flickering red and green bars on a dark screen
A close-up macro view of a financial candlestick chart with red and green bars fluctuating on a digital screen

Related Keywords

data
graph
numbers
chart
light
lighting
computer
screen
analysis
analytics
animation
assets
bearish
bitcoin
bonds
btc
bull and bear market graphics
bullish
business
business statistics graphics
buy
candles
charts
companies
crash
crypto
crypto currency
cryptocurrency
currency
day trading
diamond hands
digital
digital currency
dow jones footage
economic data overlay
economy
equity
exchange
finance
financial
financial data visualization
financial graphs
financials
forecastin
graphs
hedge funds
hodl
indices
invest
investment
investment analysis visuals
investments
long term investment
market
market analysis animation
market trends
marketflow
money
nasdaq charts
overlay
platform
prices
robinhood
sell
shares
statistics
stock
stock exchange footage
stock market charts
stock market footage
stock market numbers
stock market trends video
stock price graphs
stock ticker animation
stock trading screen
stocks
ticker
trading
trading data animation
trading platform footage
trends
visuals
wall street
wealth

Categories:

Technology

Need help finding the
right footage?

Have it delivered to your account within 1 business day.

This is Filmsupply

Our StoryOur FilmmakersArticlesFilmsPopular SearchesAll Categories

FM

A family of brands dedicated to empowering the creative.

FILMSUPPLY

Footage licensing for productions

MUSICBED

Music licensing for filmmakers

STILLS

Image licensing for creatives

© 2026 FM LLC.

Privacy PolicyLicense TermsTerms & ConditionsCareers