Musicbed
Filmsupply
Stills
Contact Us(800) 805-6802
A wall of graphs reflected on the floor
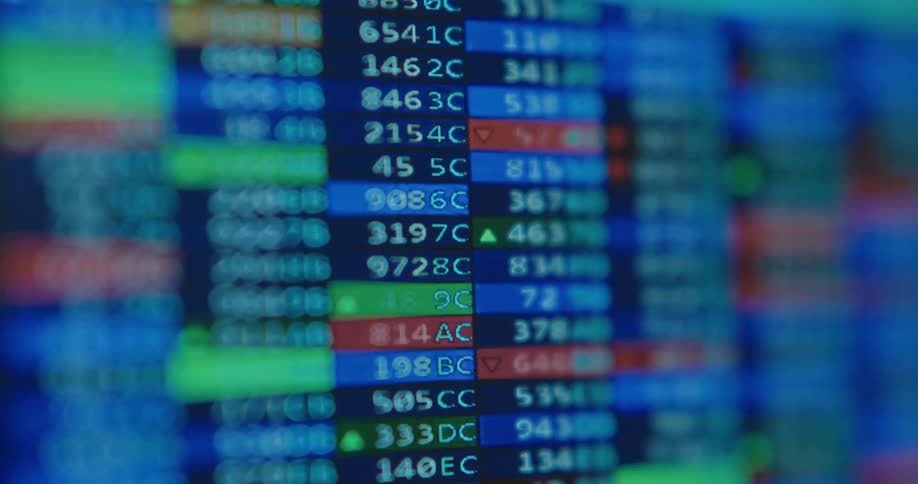
An out-of-focus close-up of a live stock market or cryptocurrency candlestick chart showing real-time price fluctuations
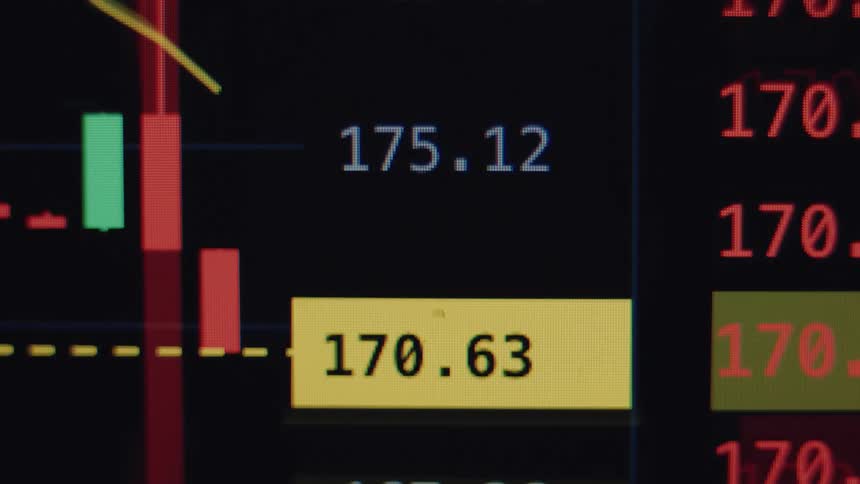
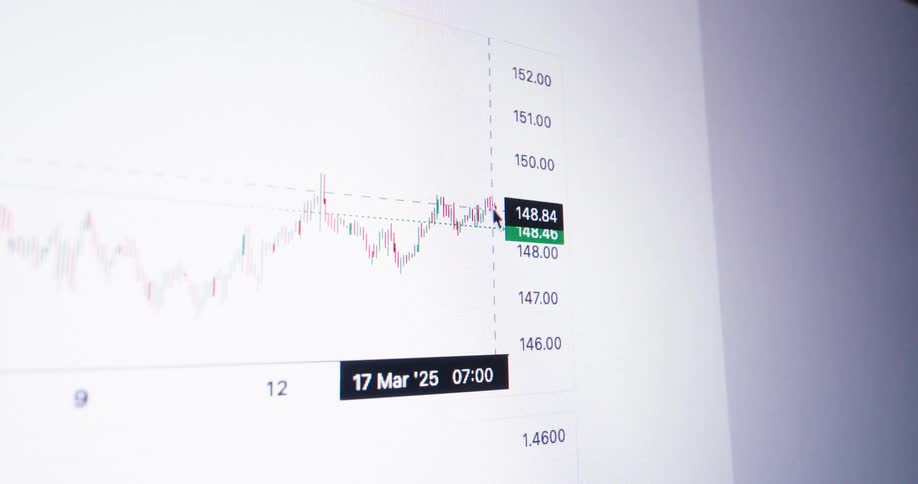
A close up clip of a trade chart
Pixelated computer screen displays a red graph with statistical data showing the increasing inflation rate as prices for everyday goods and living costs in the US rise with a very high CPI or consumer price index causing financial problems
A retro-style green bar chart on a black computer screen shows exponential growth, with an upward-pointing arrow
An animated candlestick chart on a digital screen displays fluctuating stock market or cryptocurrency data and analytics
Retro computer monitor or screen displaying a neon green growing graph of a vintage broker or trading software enabling users to buy and sell stocks online in order to make profit and earn money and invest for their future
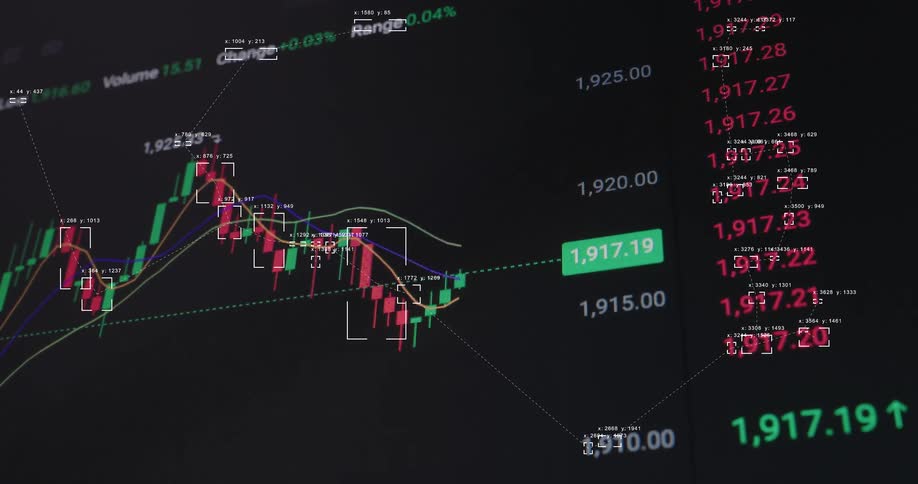
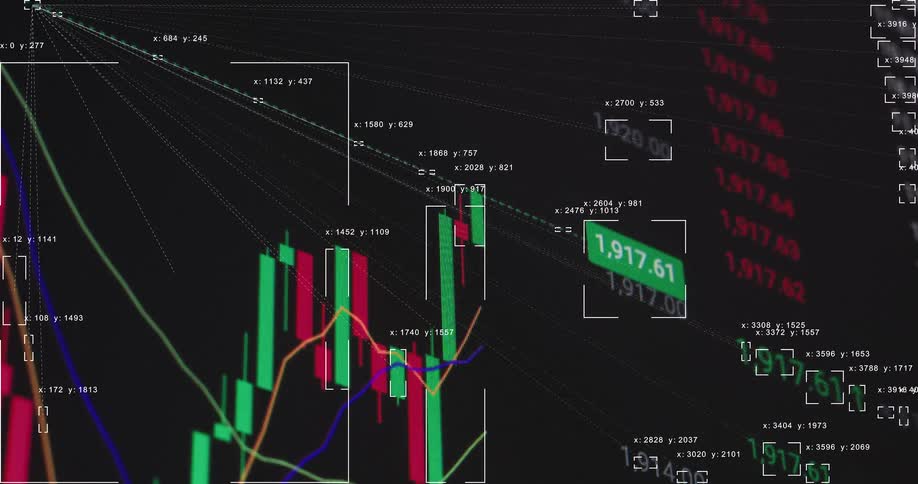
A stock market candlestick chart with technical indicators is displayed on a screen
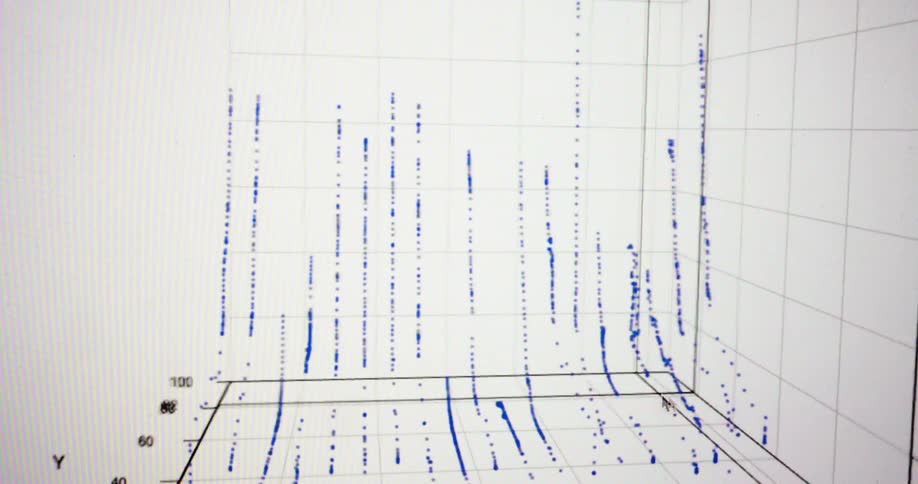
Plot displayed on a computer monitor contains labeled blue dots
A screen shows a graph with a line and a pie chart with data
A screen shows a financial chart with green and orange bars moving up and down
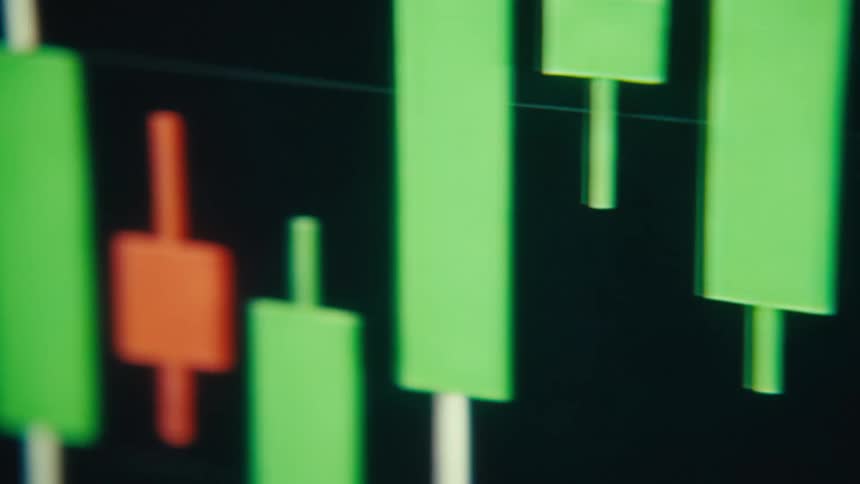
Tall green candlestick bars with thin white wicks rise against a dark background their sharp tops and bottoms hinting at sudden bullish spikes and shortterm volatility
Macro shot of a financial chart on a computer screen indicating a downward trend with a black arrow
Computer program creates a red line graph on a PC monitor going up and down and falling after being rejected by the trend line as a symbol for financial meltdown and losing money in the stock and crypto investment market
Line graphs flash on a screen
Extreme macro close up of a stock chart candle diagram with red and green candles and increasing and decreasing numbers on a dark digital computer screen with pixelated image and distortion
Blurry close-up of a digital screen displaying a live stock market candlestick chart with fluctuating prices
A close view shows blurry digital graphs and stock market data with red and green bars moving quickly across a dark screen
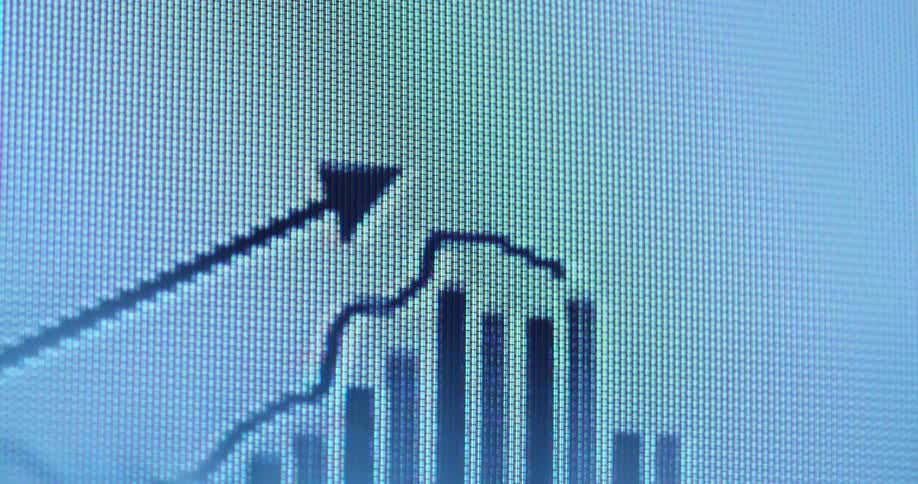
Extreme close-up on a pixelated screen shows a bar graph and arrow rising to represent business success and economic growth
A digital screen shows a volatile stock market or cryptocurrency candlestick chart with a line graph fluctuating up and down
Candlestick chart of a stock market price displayed on a computer screen with green and red candles
Locked off static extreme macro shot of graph that rises to infinity on vintage display device as symbol for financial success growth and freedom due to successful equity or crypto trading strategy by a stock broker of online exchange finance application
Extreme macro close-up of a computer monitor showing a bar graph with a downward arrow indicating a financial market crash, economic recession, or loss
Sharp decline shown in a financial chart animation played on a pixelated CTR computer screen as symbol for the financial crisis of the global economy in a dramatic downward trend with negative tendency as the numbers decrease
Financial candlestick chart on a screen indoors
Closeup of a graph of financial data that occasionally shows spots of light
A line graph is displayed on a monitor on the side of a building
A user manipulates and rotates a 3D scatter plot to visualize and analyze complex data on a computer screen
Red and neon green glowing candles create a bullish candlestick chart pattern with upward movement and positive price development as symbol for a healthy commodity or equity market or profitable stock or crypto trades via online broker app
Black and white animation of an EQ or equalizer playing a music bass graph with a fast beat on a digital screen of a pixelated tube TV or television visualizing the sound of the tune or track
Closeup of a monitor displaying a financial market chart
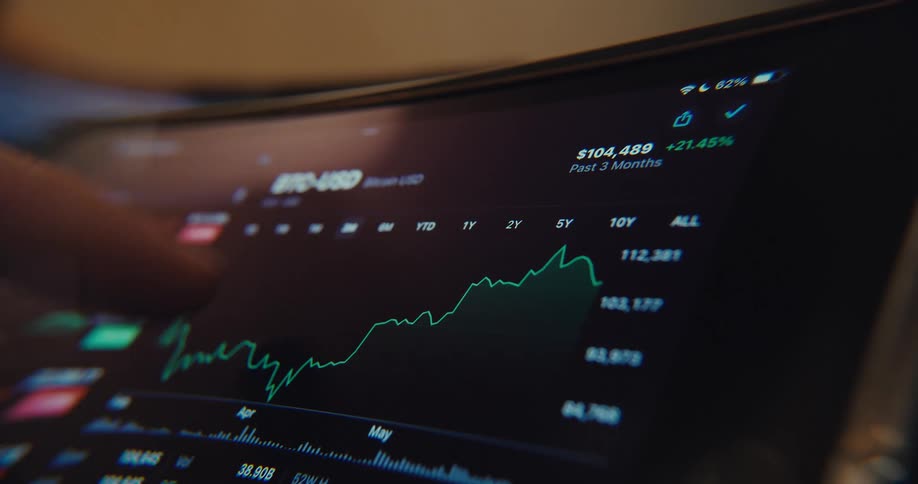
Person touching a tablet screen with their fingers to check stock prices
Thats a close up shot of a stock ticker or financial data display showing fluctuating numbers and possibly candlestick charts
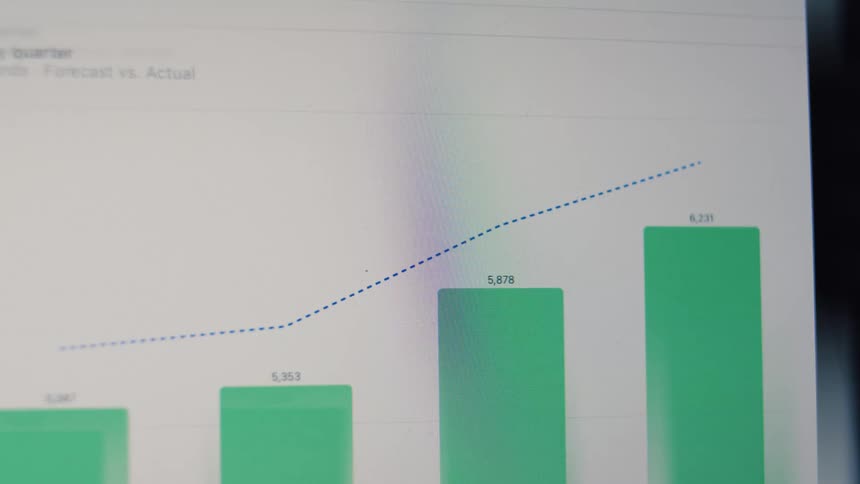
An extreme close-up of a computer screen showing an animated bar and line graph with upward trending data
Financial market candle chart against abstract background
Digital table with market numbers and percentages in green and red
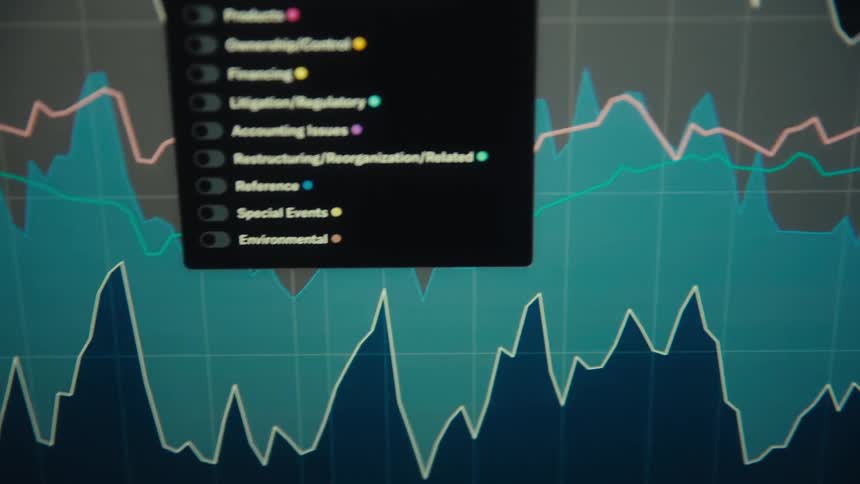
A closeup of layered line and area graphs in teal pink and gray against a dark grid the sharp peaks and troughs and overlaid legend suggesting volatile financial or technical data
A closeup shot shows a digital financial chart with red and green candlestick graphs on a black background the camera pans slowly to the right showing the bars moving up and down to reflect market changes
A finger points at a tablet screen displaying a fluctuating stock market graph
A close-up of a rising stock market graph on a digital display showing financial growth
The numbers on the monitor change frequently
A dna strand is spinning on the wall from a projector
Digital display shows graph and data points
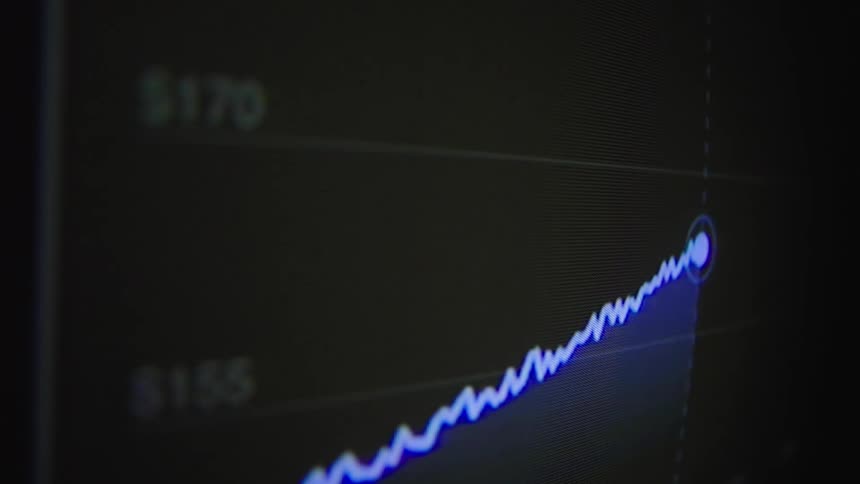
A close-up, out-of-focus shot of a blue digital line graph fluctuating on a dark screen, representing stock market data or financial trends
Numbers and a line chart are on the computer monitor
An abstract and distorted close-up of a rotating 3D scatter plot showing colorful data points being analyzed
A rapid blurry pan across a digital financial interface showcases glowing orange and teal bar graphs and fluctuating data lines that shift through heavy motion blur and vibrant light leaks
Futuristic digital display shows a dynamic candlestick chart of stock market or cryptocurrency trading with algorithmic analysis
Audio studio voice recording sound wave on a computer screen with different frequencies and tones as the audio level indicator bars of the equalizer interface move up and down to the music beat or song
A bright blue line graph moving across a light blue screen
A close-up of a digital stock market chart shows fluctuating asset prices with candlestick patterns and changing numbers
A blurry close-up of a digital stock market ticker shows financial data changing rapidly on a blue screen
A glowing line graph showing fluctuating financial data
A candlestick chart of a stock option displayed on a computer screen
Macro close-up view of a digital screen shows an animated graph with a rising line chart and an upward pointing arrow overlaying vertical bar charts representing market growth or financial success on a white computer screen background
A high-tech digital animation of a financial market graph showing fluctuating prices with data analysis tracking
A blurred, close-up, and stylized animation of a digital stock market chart with glowing lines and fluctuating data
Multiple colorful lines move in an animated digital graph
Blurred financial graphs on a screen indoors
Scrolling on a chart showing the fluctuation in a stocks price
A digital bar graph on a monitor shows a bullish market trend and positive economic growth
Dynamic hand-held macro shot of pixelated screen showing stock trading chart or financial graph crashing with negative downward tendency falling into the red figures causing stress and panic with fear of economic recession
A close view shows blurry digital graphs and stock market data with red and green bars moving quickly across a dark screen

Need help finding the
right footage?

Have it delivered to your account within 1 business day.

This is Filmsupply

Our StoryOur FilmmakersArticlesFilmsPopular SearchesAll Categories

FM

A family of brands dedicated to empowering the creative.

FILMSUPPLY

Footage licensing for productions

MUSICBED

Music licensing for filmmakers

STILLS

Image licensing for creatives

© 2026 FM LLC.

Privacy PolicyLicense TermsTerms & ConditionsCareers