Musicbed
Filmsupply
Stills
Contact Us(800) 805-6802
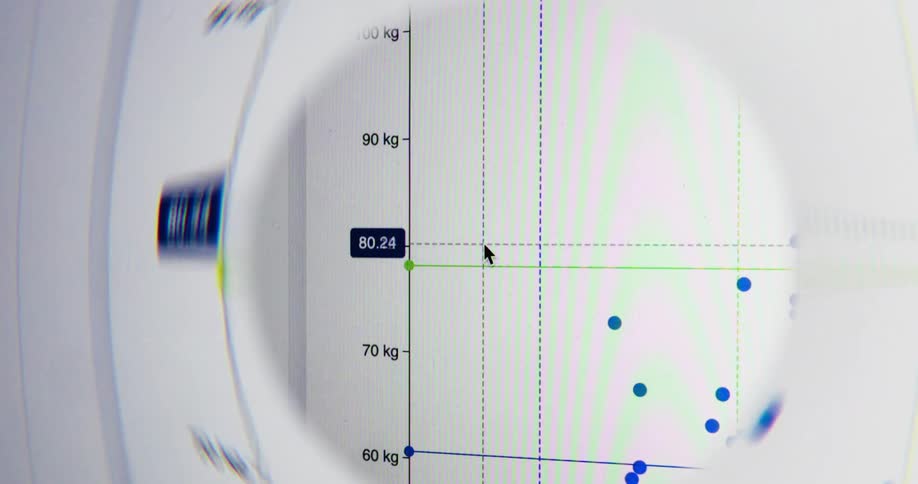
Close-up of a digital graph on a computer screen showing a rapid increase in weight measured in kilograms
Computer monitors are showing graphs and data
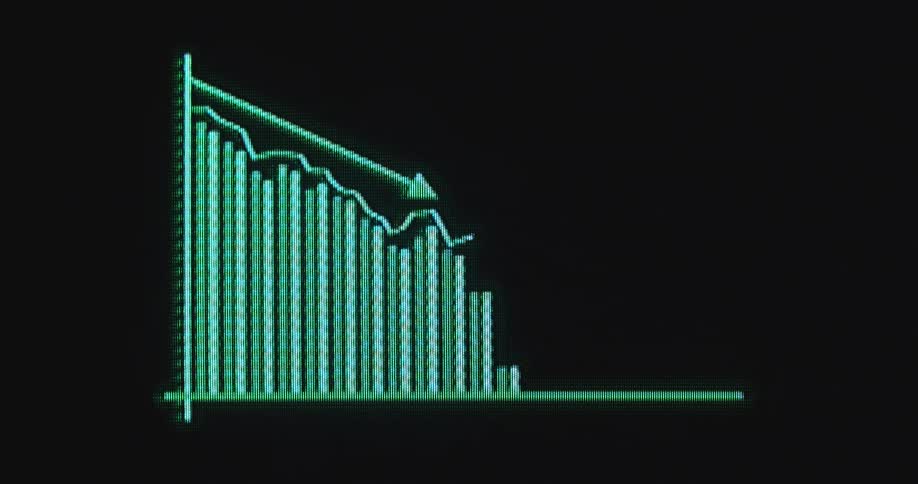
Extreme close-up of a digital screen displaying a bar graph with a downward-trending arrow, indicating a financial decline or market crash
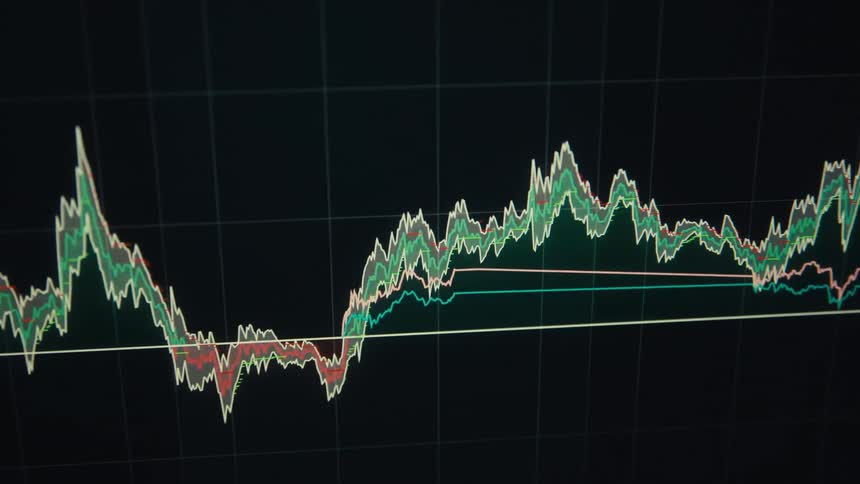
A graph on a screen with a black background and the graph has red and green ripples going up and down
A red arrow moves upwards across the screen as a bar graph animation is forming beneath it presenting statistical data and visualizing the dramatic increase of prices and production costs
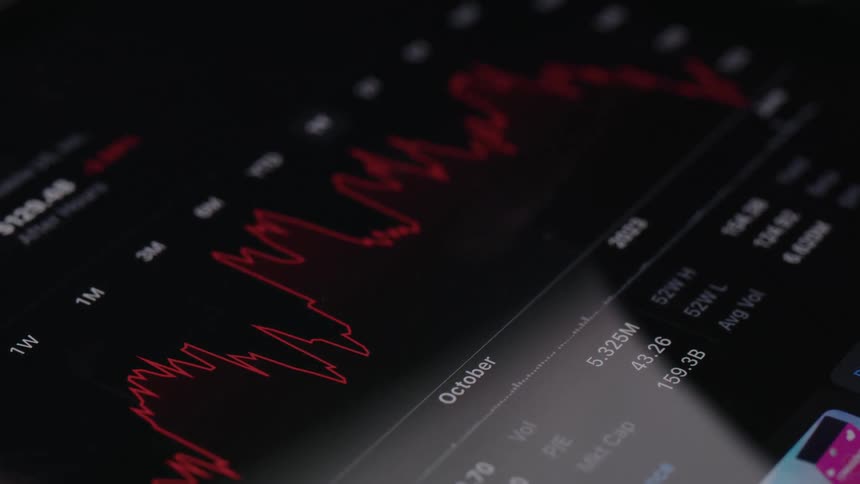
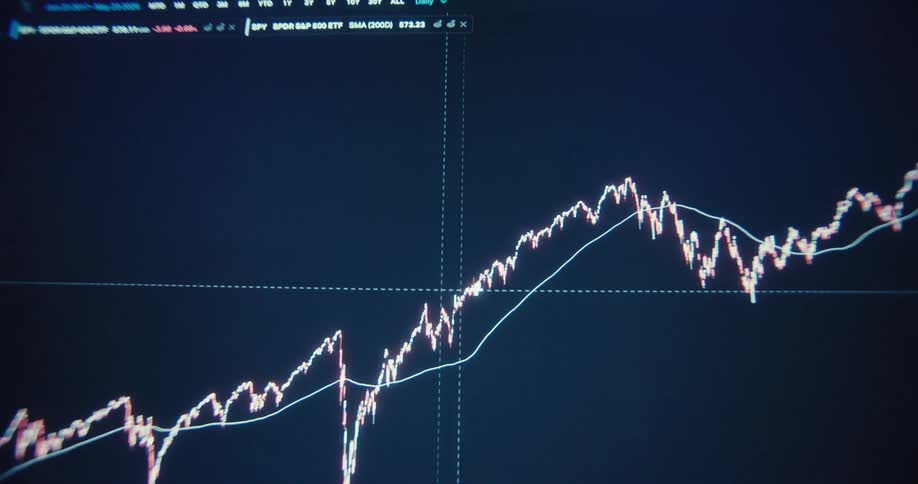
A stock price chart is displayed on a computer screen
Finger points to a highlighted point on a line chart showing value variation
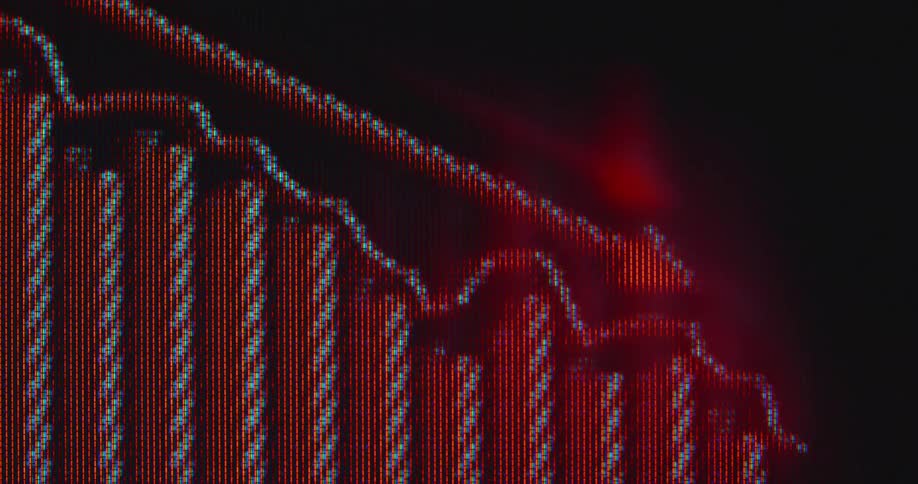
CRT or cathode ray tube monitor with RGB pixels displaying animated bar chart with negative trend line and downward pointing arrow going down as the business expenses are lowered or the profit is declining due to bad economic development
Macro shot of digital pixelated green trading line graph from an online finance application shifts up and down with the global economy in times of financial instability as it moves across the black screen of a flickering vintage tube TV
Overlapping line and candlestick charts display intense financial fluctuations
Graph of the value of a currency
A wall made up of animated graphs
Close-up of a digital screen displaying a colorful animated bar graph for business analytics and financial reporting
A real-time digital trading chart fluctuates on a screen, with the line graph indicating financial gains and losses
A neon green coloured sales chart or finance trading graph showing a downward trend symbolising a financial meltdown or a market crash or collapse caused by economic uncertainties and fear of global recession
The line graph is moving on the screen
Closeup of a digital trading graph with fluctuating lines and bars on a screen
The screen is full of line graphs
Glowing green and red digital line graphs display financial data on a dark background
Financial market candle chart against a gray screen
A distorted, fisheye view of a computer screen shows a user interacting with a colorful 3D scatter plot, analyzing scientific data
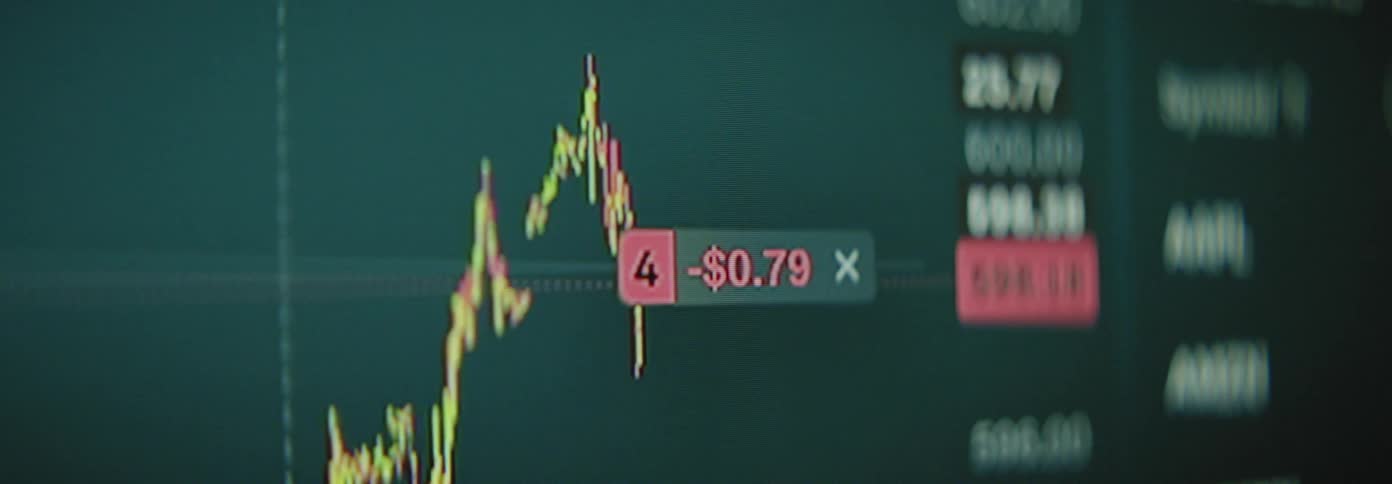
A computer screen displays fluctuating stock market charts and trading data
Red falling trading chart of an online stock broker or crypto exchange in a downward trend during a bear market crash and financial crisis symbolizing failure bankruptcy insolvency and losses caused by declining international and global economy
A view of graphs and lines on a screen
Dramatic macro view of data visualization or presentation showing a negative down trend with critical development as the digital graph or chart animation crashes symbolizing extreme volatility and economic decline and uncertainty
An animated, colorful bar chart on a digital screen displays fluctuating business data and analytics over several months
A shot shows a graph on a screen with data lines moving up and down
People walk by the line graph on the monitor
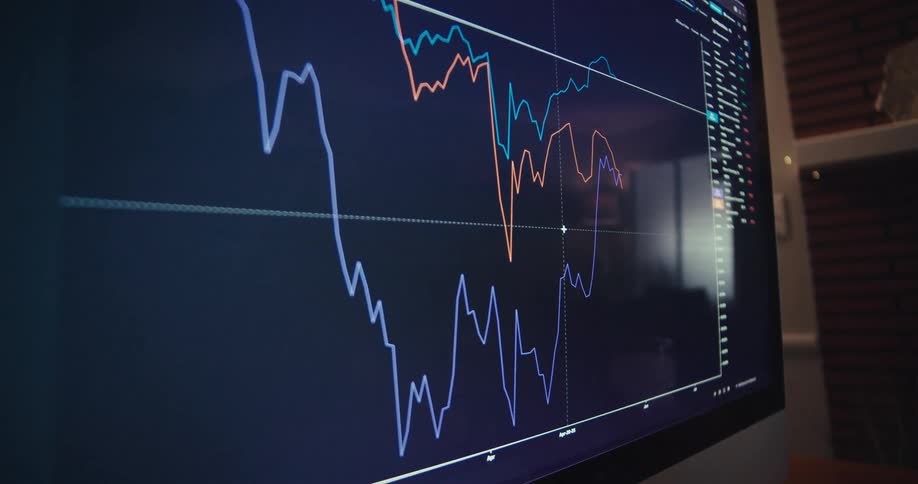
A screen with red and blue graphs
Bright neon green bars or candles of a candlestick chart pattern or financial graph on computer display screen with dark background and positive price development symbolizing successful stock trading with upward trend and handheld camera movement
Macro close up shot of a colorful data visualization graph displaying scientific analysis on a computer screen
A person uses their tablet to check stocks
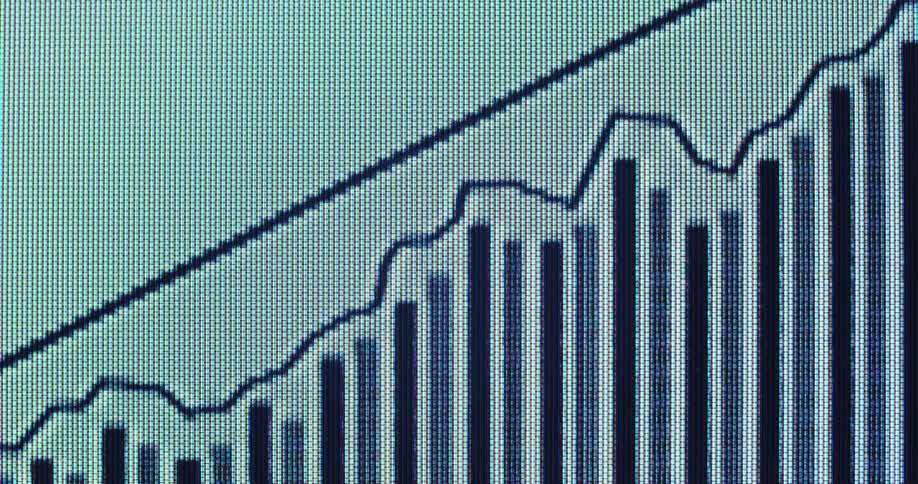
Futuristic macro close up of a retro digital CTR screen playing animated graph with a rising line chart and upward pointing arrow overlaying moving black bars representing stock market or business growth with financial success on white background
A clip of a screen displaying a digital trading candlesticks
Extreme closeup of a pixelated red chart with significant downward trend highlighted by descending line and arrow as the stock market or the global economy decline and the US dollar loses value due to negative price development
A line on a graph moves up and down as it travels across a screen
A computer screen with a green graph on it
The animated data graph steadily goes down with a negative trend or declining tendency on the pixelated monitor presenting a financial or business statistic during a cooperate presentation with a holographic overlay or effect
A close up view of financial data charts and graphs displayed on a screen with light distortions
Close up of pixelated investment graph going up during an upward trend as a symbol for rising stock market and financial freedom and success during economic growth on an old TV or computer screen showing a finance app
Closeup of a computer screen showing live stock market data and charts
Candle chart in a digital system
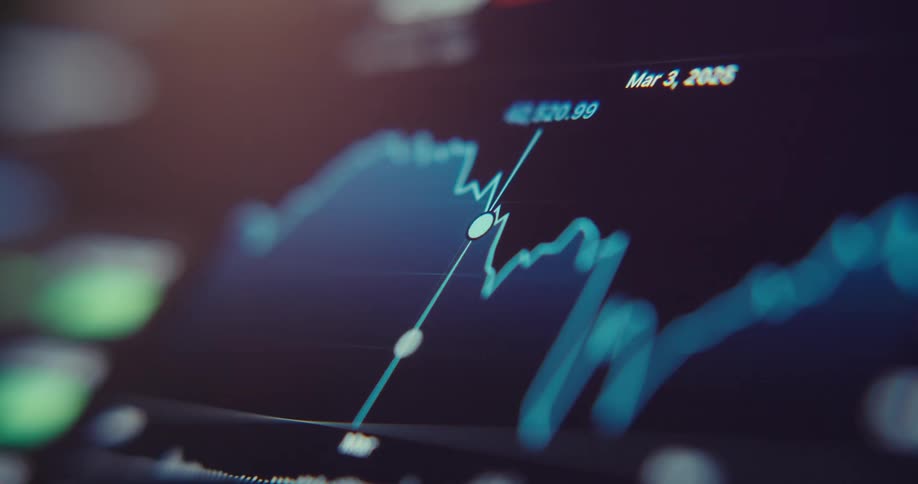
A closeup digital screen displays a fluctuating stock or financial chart
The numbers scroll by on the monitor
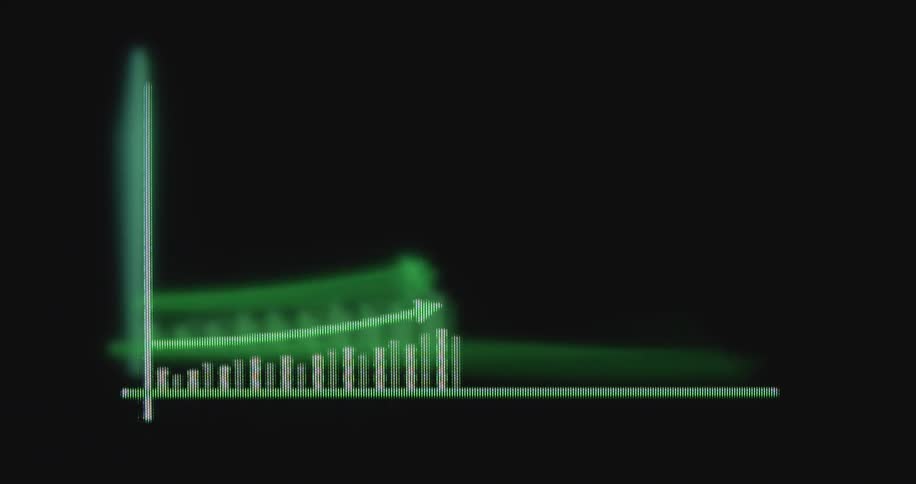
An animated green bar chart on a digital screen illustrates exponential growth with a rising arrow
A computer monitor displays a candlestick chart of a stock price with the graph actively scrolling to the right
Closeup of a screen displaying a stock market chart
A red and green line graph depicting a sharp decline is prominently displayed on a dark background suggesting a financial downturn and loss
Charts are flashing on the computer screen
A persons finger is scrolling on a digital screen that displays a fluctuating financial line chart showing a downward trend
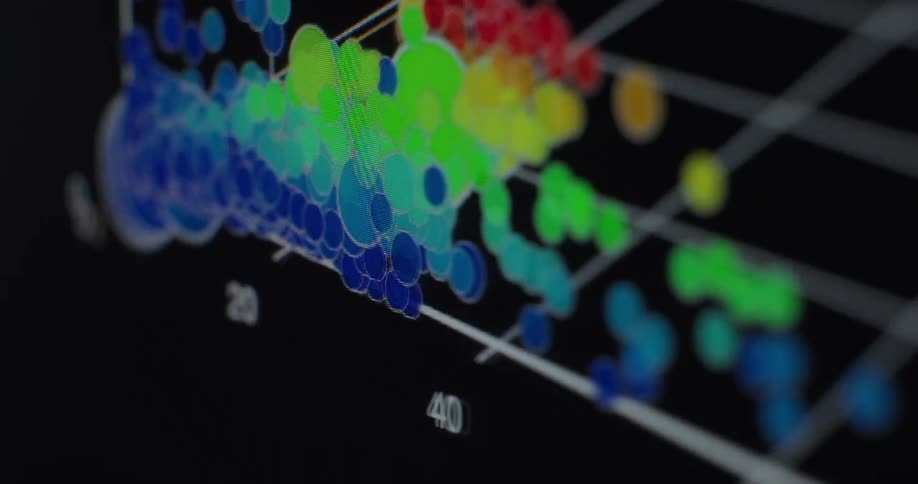
A dynamic data visualization of a 3D scatter plot with colorful dots representing protein analysis rotates within an abstract frame
Screen displaying a dimensional color graph
Futuristic closeup of a computer screen displaying a stock market graph or candle chart with ups and downs and upward tendency representing the digital and modern finance sector
Financial chart bars in green and red tones with blur
A macro close-up of a digital stock market graph showing a bearish trend with a declining arrow indicating a financial crisis
Closeup of a computer screen displaying realtime stock market charts and financial data
Colored line graph displayed on a screen changes as the data values change
Financial market candlestick chart displayed against a blurred background of buildings
Chart of rising and falling candles against a blurred background
Financial candlestick chart showing strong upward movement after Bull Flag breaks resistance to the upside and bullish price action continues during massive crypto bull run and alt coin season creating generational wealth among investors and traders
A screen shows a financial chart with lines and bars moving up and down
Green and orange colors of a candlestick chart contrast with the black background on a computer display
Close up of a device screen as a person swipes through trading charts in a currency trading application

Need help finding the
right footage?

Have it delivered to your account within 1 business day.

This is Filmsupply

Our StoryOur FilmmakersArticlesFilmsPopular SearchesAll Categories

FM

A family of brands dedicated to empowering the creative.

FILMSUPPLY

Footage licensing for productions

MUSICBED

Music licensing for filmmakers

STILLS

Image licensing for creatives

© 2026 FM LLC.

Privacy PolicyLicense TermsTerms & ConditionsCareers