Musicbed
Filmsupply
Stills
Contact Us(800) 805-6802
Close-up of a digital screen displaying a colorful animated bar graph for business analytics and financial reporting
A line graph and numbers are projected on the wall
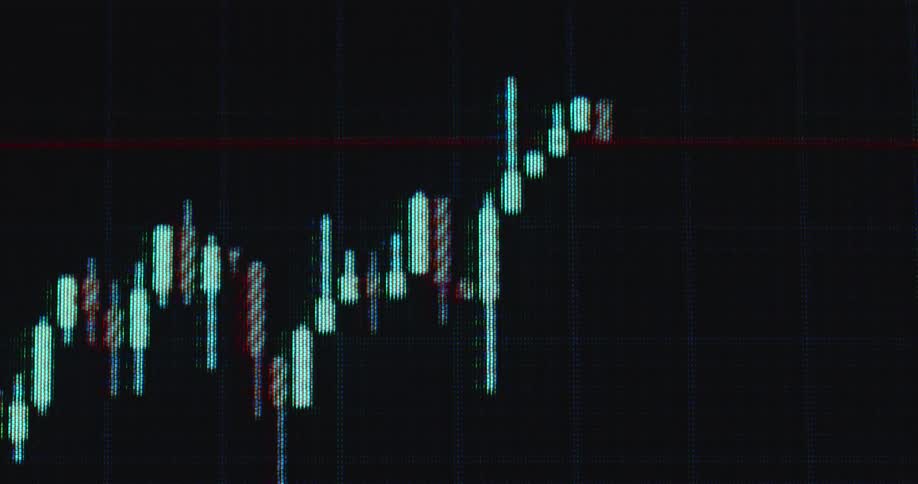
Retro Macintosh computer screen displaying financial market chart of an online trading platform or broker application for buying stocks or shares with bright neon green candles as the price goes up or increases with a positive trend
Close up of a device screen displaying a trading interface in green over a dark background
A computer screen displaying a stock market candlestick chart with fluctuating red and green lines indicating market trends
Green trend line drawing candles with wicks on dark pc screen creating bullish candlestick graph or pattern with upward tendency and positive price development symbolizing successful trade with profits via online trading platform or broker application
A display screen shows charts in gold color
Abstract canvas displaying graphics
Blue static lines play on a television
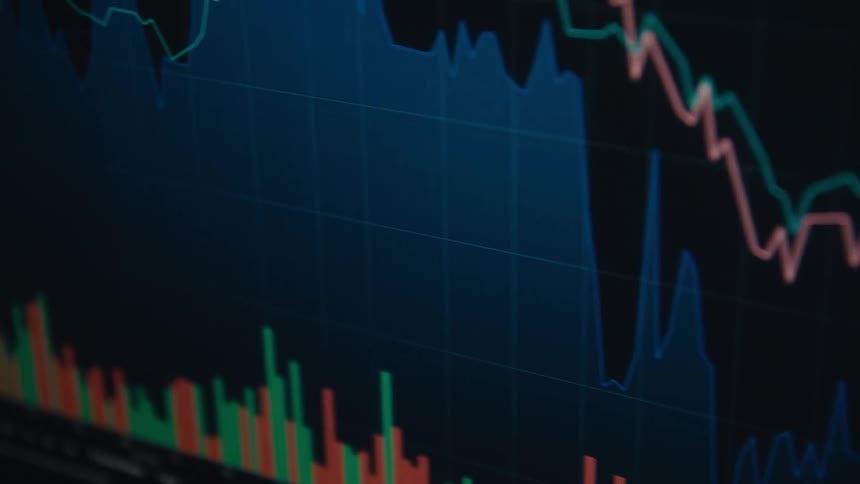
Financial chart bars in green and red tones with blur
Sharp decline shown in a financial chart animation played on a pixelated CTR computer screen as symbol for the financial crisis of the global economy in a dramatic downward trend with negative tendency as the numbers decrease
Cursor causing the screen to scroll to the right as it moves along the graph line
The candlestick trading chart or graph steadily rises with a positive upward tendency and trend showing the price development of the MSCI World or S&P 500 or another ETF as a store of value and protection against inflation
A heart rate monitor displayed on the screen
A close-up of a digital stock market graph showing a blue bull run followed by a dramatic bearish crash into the red
A heart rate monitor displaying readings with lines moving up and down in a zigzag pattern
A stylized digital animation of a rotating DNA double helix made of colorful bars on a pixelated screen
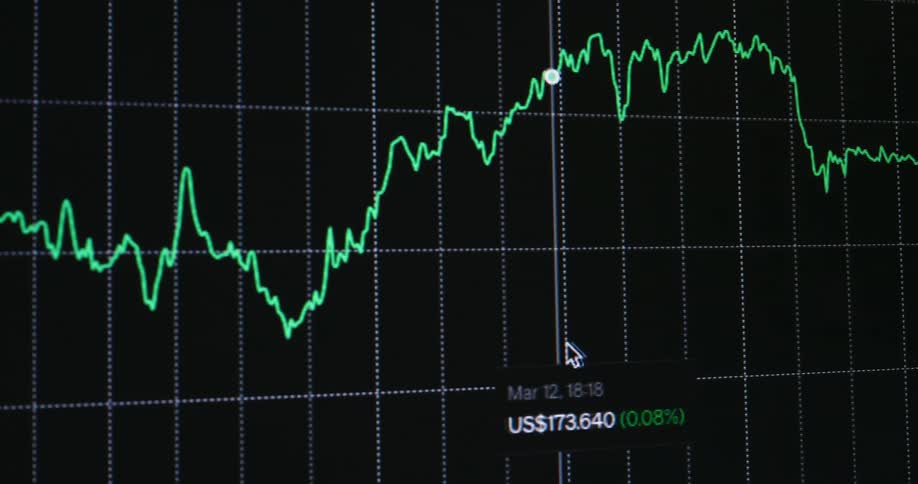
A fluctuating line graph appears on a digital screen with distinct peaks and troughs
Close up view of a person looking at their phone
A close view shows blurry digital graphs and stock market data with red and green bars moving quickly across a dark screen
Software audio recording against a black background
Dynamic hand-held macro shot of glowing equalizer bars pulse on a digital screen reacting to sound waves or dance music being played with a retro audio player device
Red candlestick charts indicate sharp market downturn with fast price movement and negative development caused by stock or finance market crash and recession displayed on digital computer screen causing stress and panic while assets lose value
A screen shows a graph with a line and a pie chart with data
The animated trading graph or candlestick chart is moving on the computer display as a recession hits the global finance markets and the prices crash as red candles symbolize the end of a market cycle and the beginning of a financial crisis or depression
A screen displaying green sound waves on a dark background
Close up of a digital screen displaying bass in green color
A close up of numbers and charts on a screen
Black and white shapes
Closeup of a digital trading graph with fluctuating lines and bars on a screen
A computer screen showing a stock chart with indicator lines
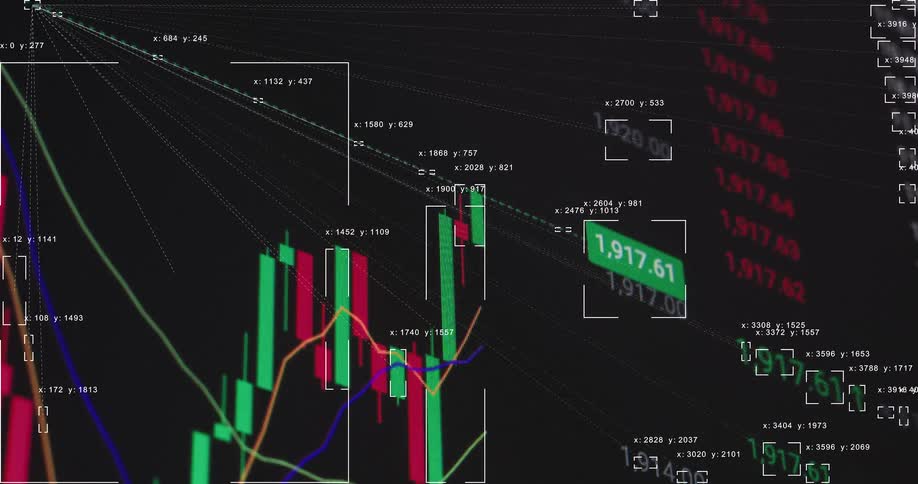
A high-tech digital animation of a financial market graph showing fluctuating prices with data analysis tracking
A vibrant green waveform fluctuates across a dark screen with a subtle grid representing an audio signal
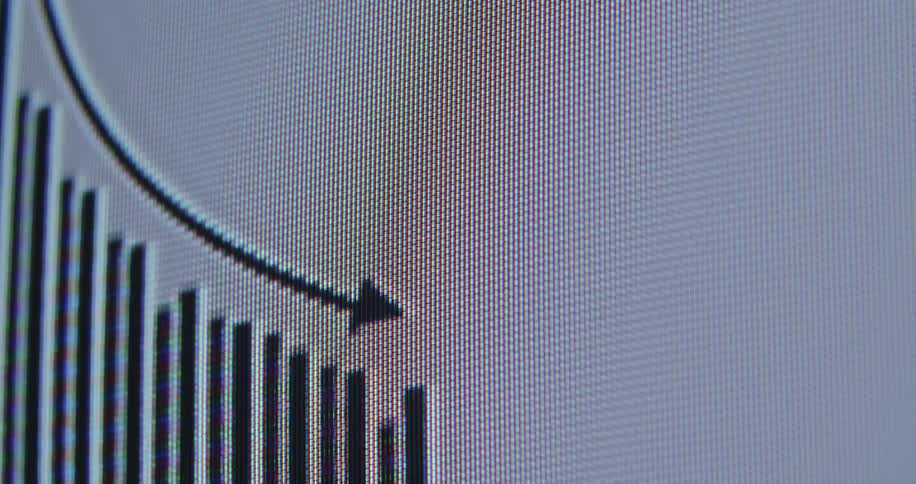
Macro shot of a financial chart on a computer screen indicating a downward trend with a black arrow
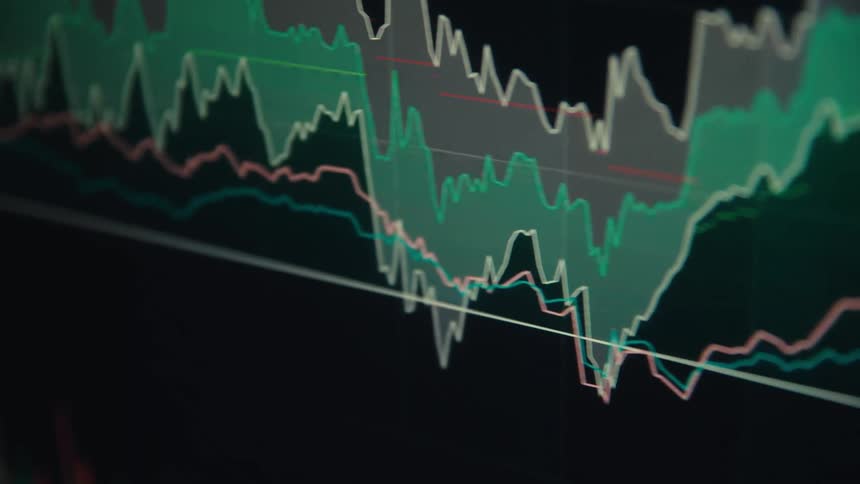
A closeup shot shows a digital screen displaying a financial graph with multiple colored lines representing different market trends the camera pans slowly from right to left revealing the volatile jagged movements of the lines as they shift up and dow
A dark video shows bright neon turquoise waveforms moving from left to right across a screen in a rhythmic and digital pattern
A monitor displays a stock market candlestick chart with green and red candles moving across a dark grid
Colored line graph displayed on a screen changes as the data values change
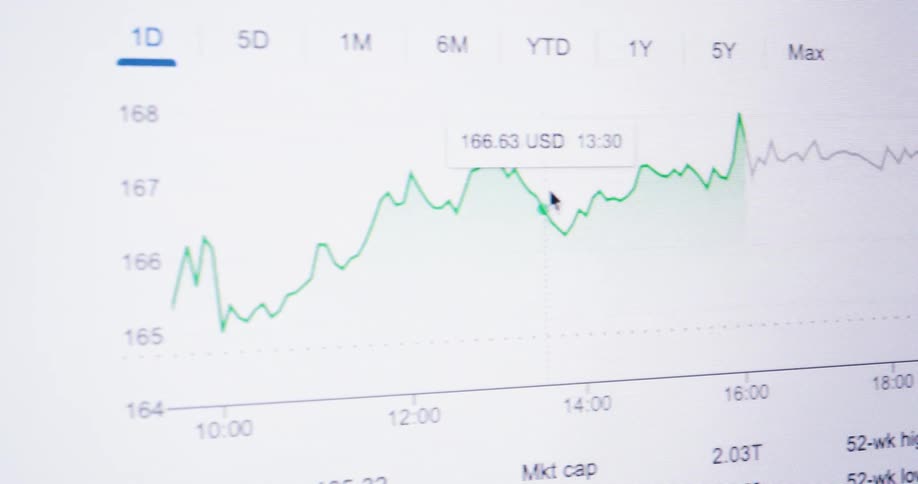
Mouse scrolling over a graph of the value of a currency
A stylized, digital animation of a DNA helix slowly rotates on a pixelated screen
Stock price bar chart displayed on pixelated computer monitor of a broker as the market crashes and the prices of the assets go down with a negative trend and a falling arrow indicating a decline in value and a recession with shaky movement
Flatline on an electrocardiogram monitor
Various news headlines about artificial intelligence surveillance and generated videos scroll rapidly across a dark digital interface while a large white ai label remains centered
A screen with a blue chart on it
A heartbeat is displayed on a monitor
Closeup of a computer screen showing live stock market data and charts
A close-up macro view of a digital audio visualizer with pixelated light bars moving on a screen
A close-up view of a user manipulating a colorful three-dimensional surface plot on a computer screen
The shape is building on the spinning graphic
A sound frequency is showing on a monitor
Extreme close-up macro view of a pixelated digital graph with an arrow trending upwards on a screen
Pixelated macro close-up of a digital screen showing the user interface of an online trading platform or finance app or broker application displaying a candlestick chart or graph with green candles as the price increases and goes up with a positive trend
Glowing blue lines on a graph move across a dark screen
A digital display shows multiple lines of data graphing price fluctuations over time
The projection starts displaying on the wall in the dark
A close-up of a fluctuating blue waveform representing data on a dark screen
Smartphone tracking the changes in stock price
A closeup digital screen displays a fluctuating stock or financial chart
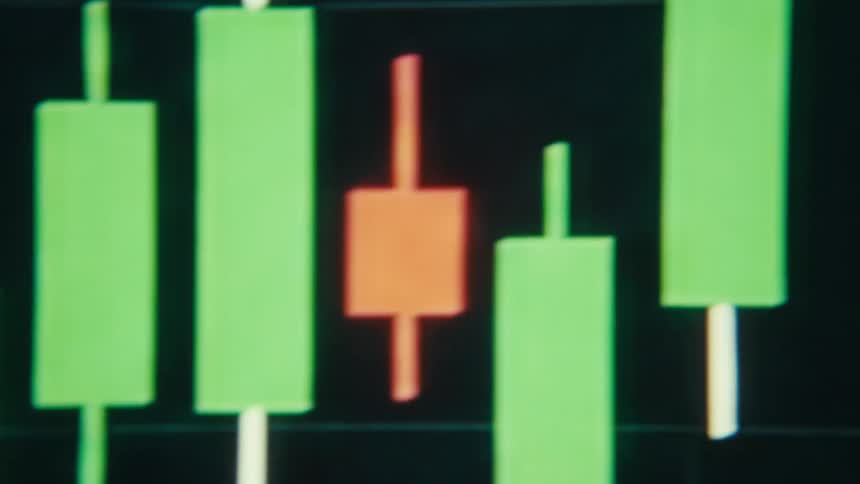
Tall green candlestick bars with thin white wicks rise against a dark background their sharp tops and bottoms hinting at sudden bullish spikes and shortterm volatility
Graphics display on a laptop monitor
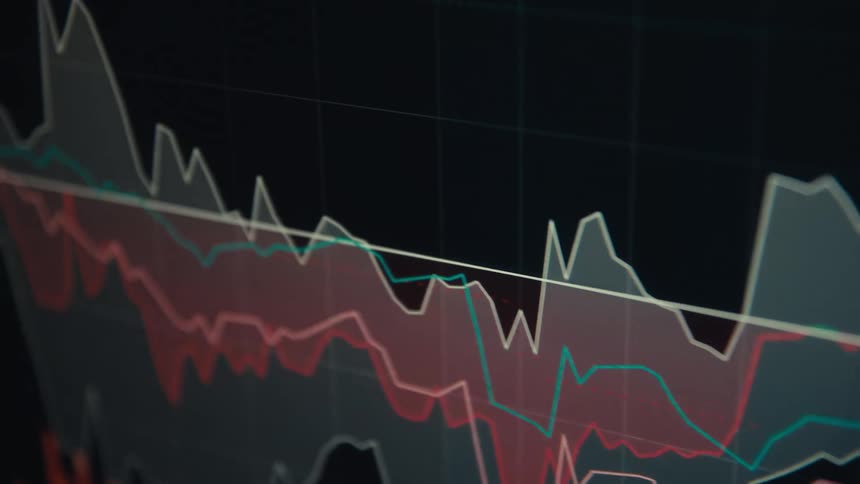
A downwardtrending blurry line graph is displayed on a tilted screen in a dimly lit setting
Chart of rising and falling candles against a blurred background
A dark screen displays a bright blue waveform fluctuating across a grid with various markers and dashed lines

Need help finding the
right footage?

Have it delivered to your account within 1 business day.

This is Filmsupply

Our StoryOur FilmmakersArticlesFilmsPopular SearchesAll Categories

FM

A family of brands dedicated to empowering the creative.

FILMSUPPLY

Footage licensing for productions

MUSICBED

Music licensing for filmmakers

STILLS

Image licensing for creatives

© 2026 FM LLC.

Privacy PolicyLicense TermsTerms & ConditionsCareers