Musicbed
Filmsupply
Stills
Contact Us(800) 805-6802
A financial chart displaying colorful candlestick patterns indicates market trends and price movements
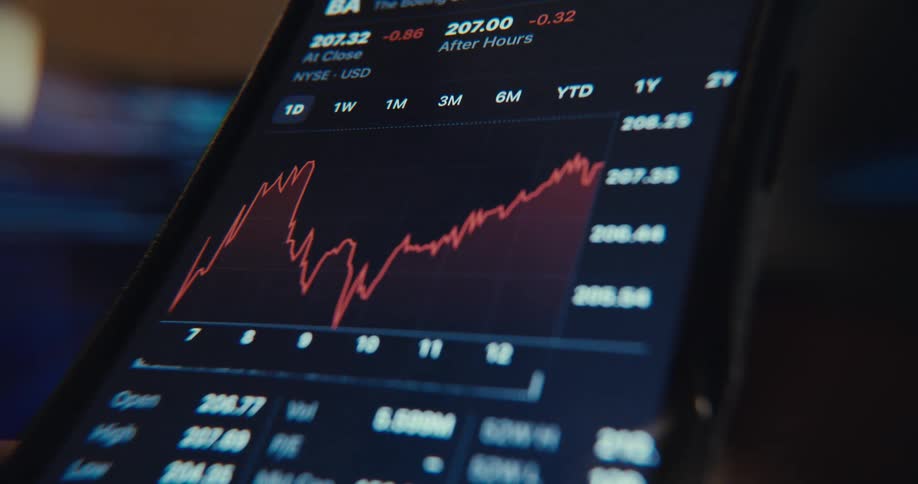
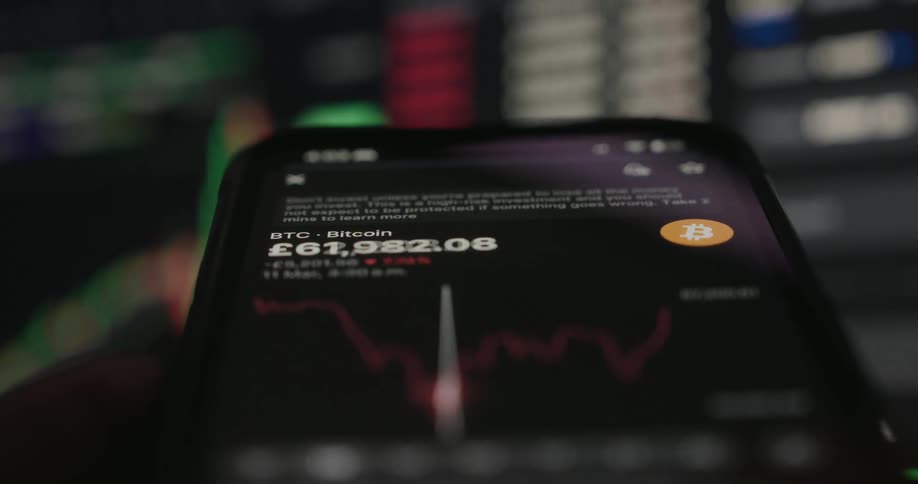
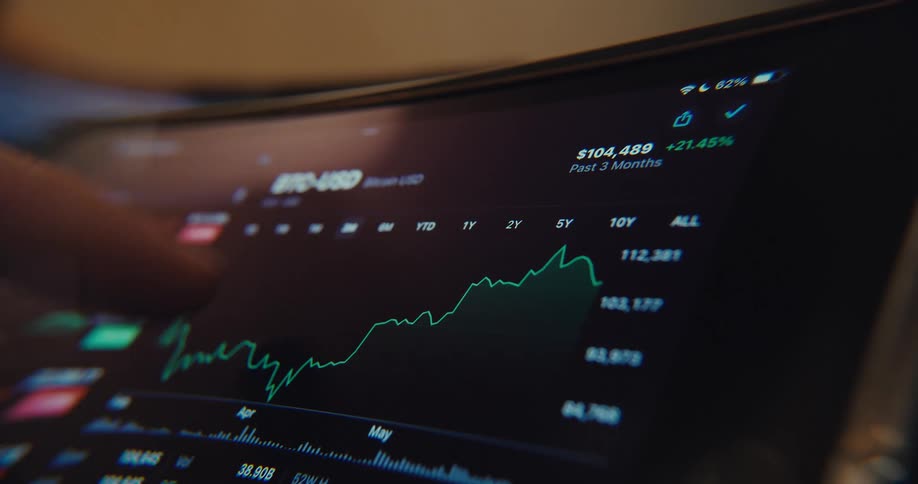
The prices changes on the cryptocurrency displayed on the phone
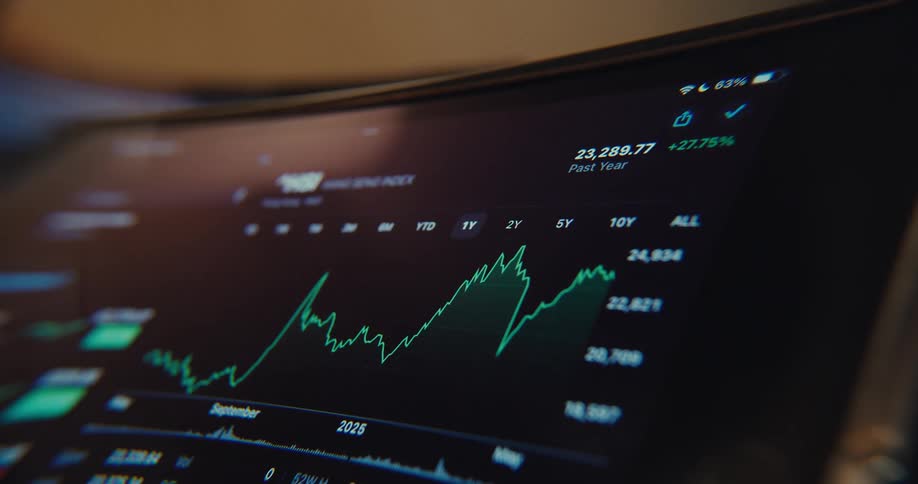
Numbers and a line chart are on the computer monitor
Static shot of a falling graph from an online trading application in a down trend during critical market cycle entering bear market after a crash and crisis on vintage screen with rgb pixels and glitches and retro digital look
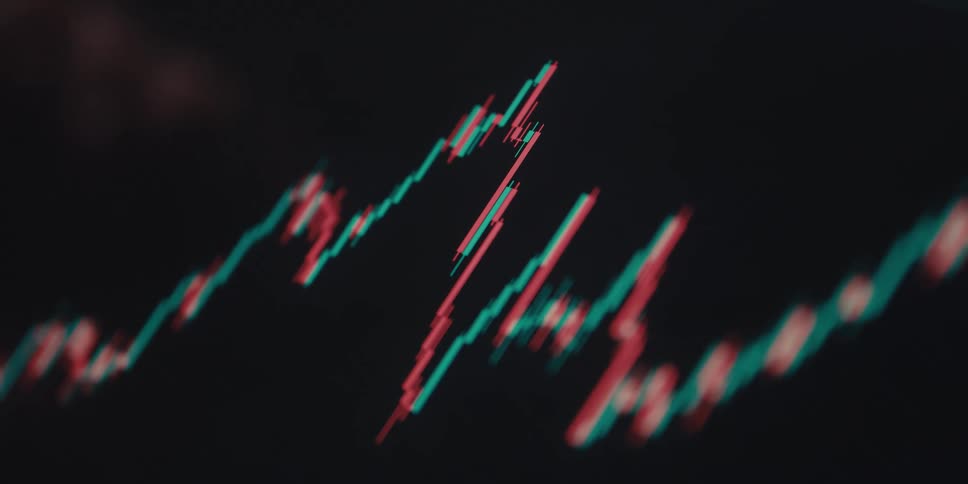
A close view shows blurry digital graphs and stock market data with red and green bars moving quickly across a dark screen
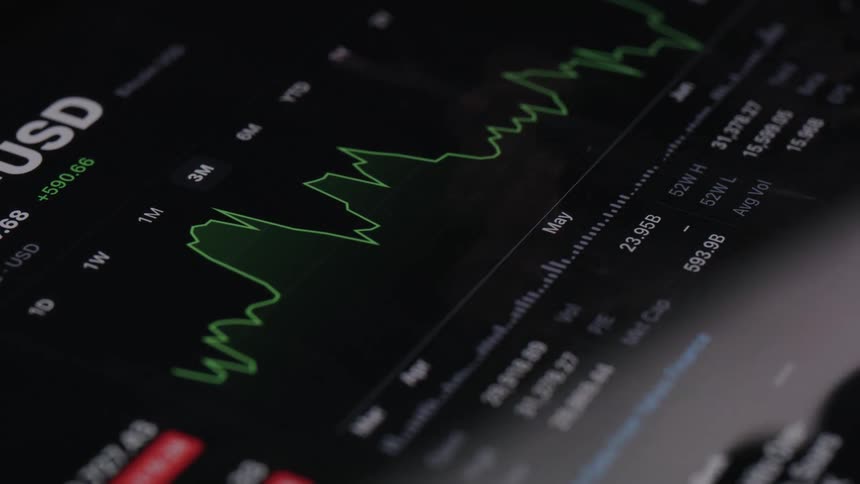
An angled closeup shot captures the dramatic peaks and valleys of a digital financial analytics chart with glowing yellow and green lines
A person traces the graph on his tablet
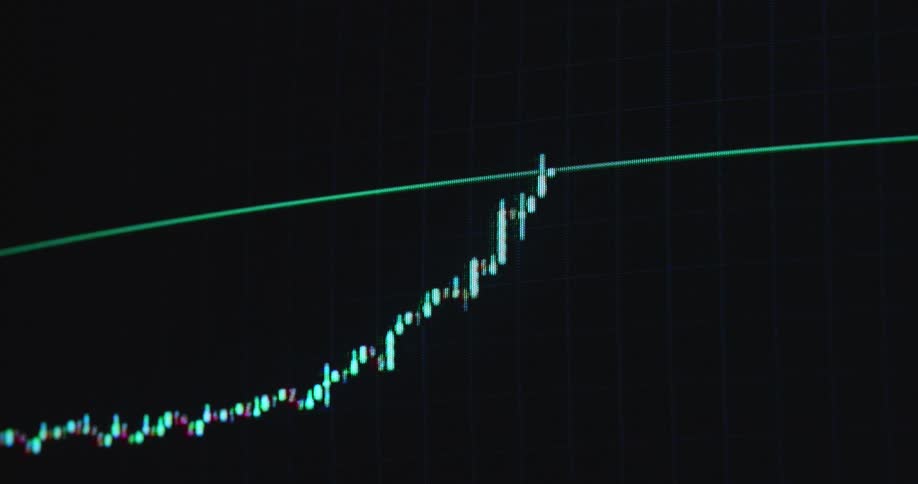
A candlestick chart or trading graph animation showing a stock price or crypto currency rising over time with exponential growth and a positive trend or development on a dark computer screen with RGB pixels as symbol for a growing shares or bond market
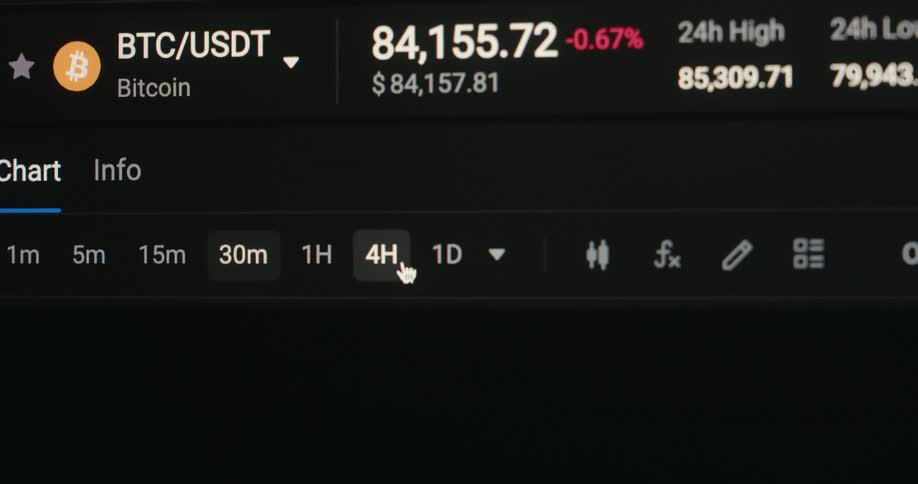
A cryptocurrency app screen transitions between trading views showing btcusdt market data chart intervals and detailed price movement stats
A closeup shot of a screen displaying fluctuating stock market graphs and numerical data
Financial information is displayed on a screen as it is scrolled
Screen displays the values and the relevant plot of changing stock data
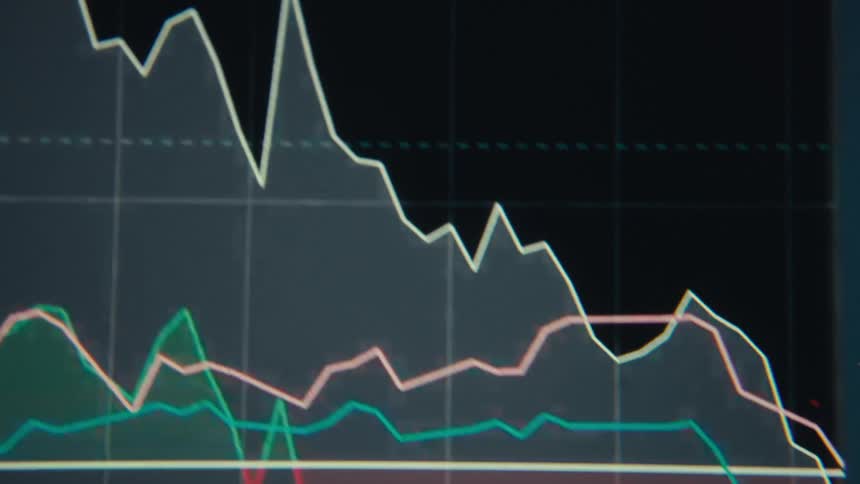
Closeup of a screen displaying a fluctuating line graph
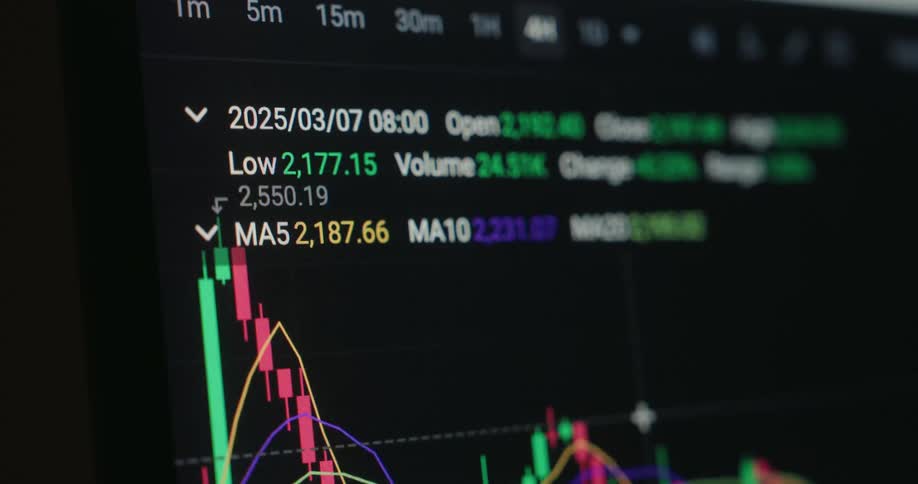
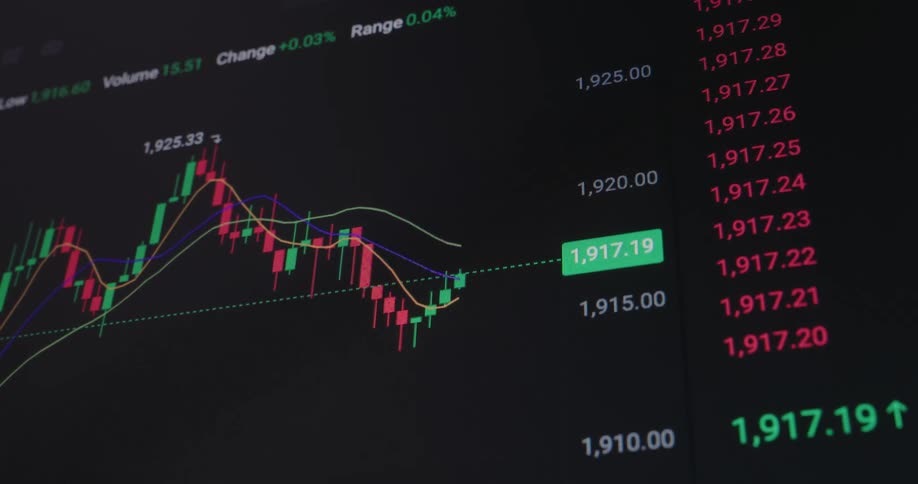
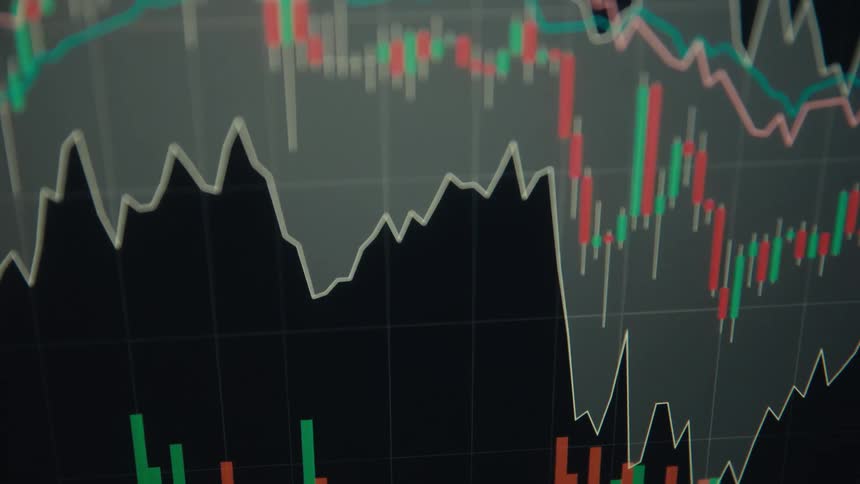
A computer screen displaying a stock market candlestick chart with fluctuating red and green lines indicating market trends
Screen showing numbers scrolling and switching between red and green due to the stock market
A computer screen displaying a stock price chart with green and red candlestick patterns
Finger pointing at a market line chart displayed on a digital screen
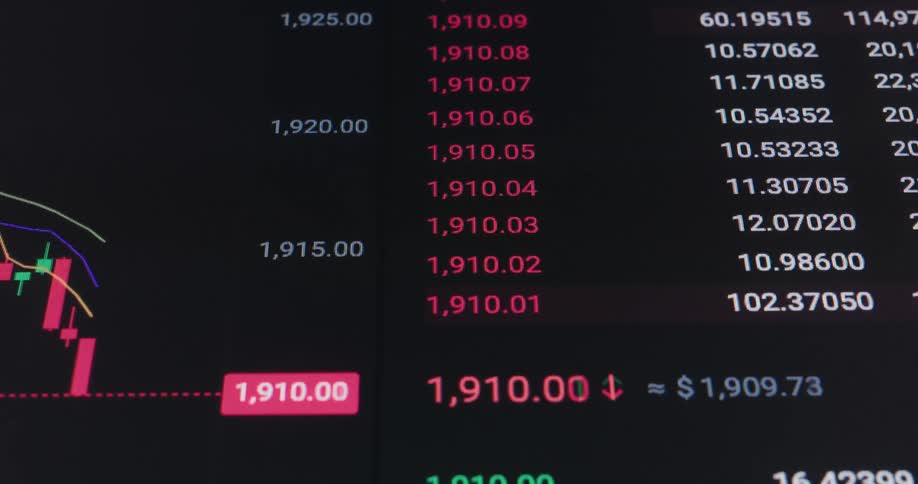
Frontal macro close up of computer monitor or screen panel displaying the user interface of a stock broker or crypto currency trading exchange as a financial investment chart or data graph is going down with a negative price development
A stock price chart is displayed on a computer screen
A pile of coins on a reflective surface with lit up arrows
A computer screen shows a website with a graph
A smartphone screen displays various stock market charts rapidly changing between green upward trend and red downward trend graphs for different companies and indices
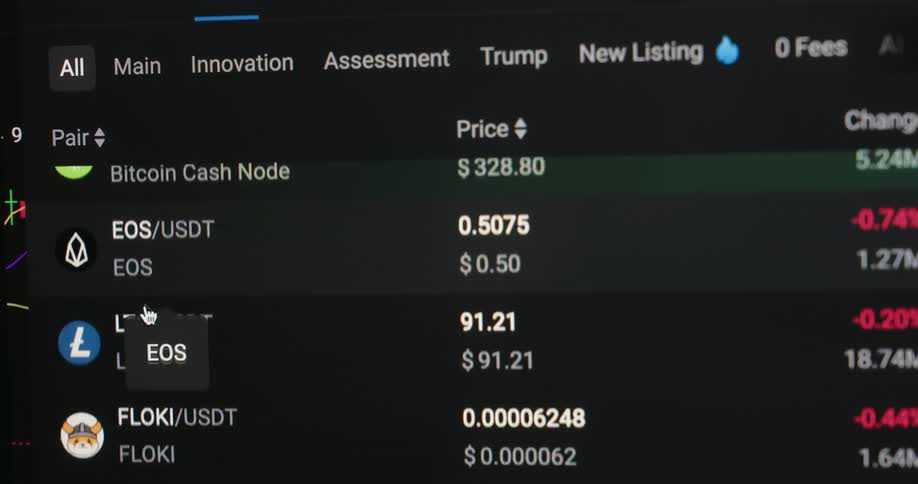
Screen displaying prices for cryptocurrenciesincluding bitcoin and ethereumand stocks
Person scrolls through stock information on a tablet
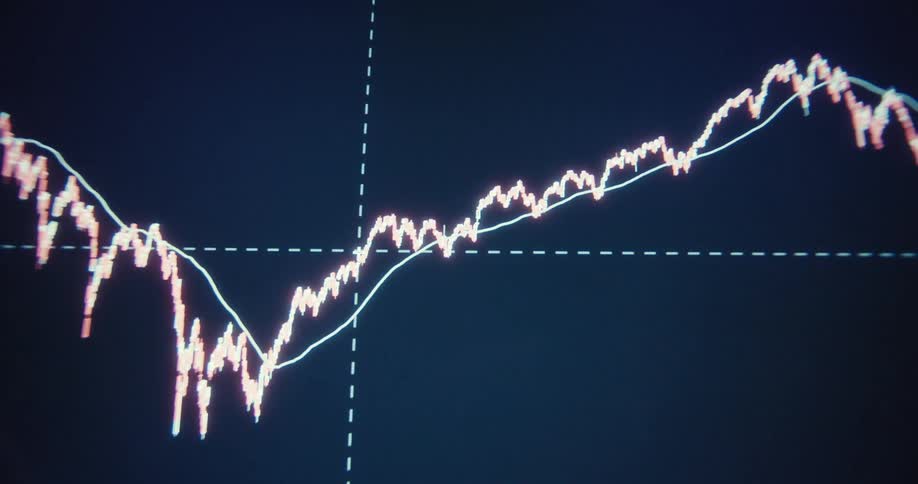
A line graph is on the computer monitor
Computer monitors are showing graphs and data
Bright light effects flow through ovals rising against a black background
Macro shot of digital pixelated green trading line graph from an online finance application shifts up and down with the global economy in times of financial instability as it moves across the black screen of a flickering vintage tube TV
Closeup of a screen displaying distorted stock market data
Colorful candlestick chart against a background
A buy button is on the cryptocurrency screen
A screen where there is a trading chart with red and green lines that are going up and down and there are numbers on the right side
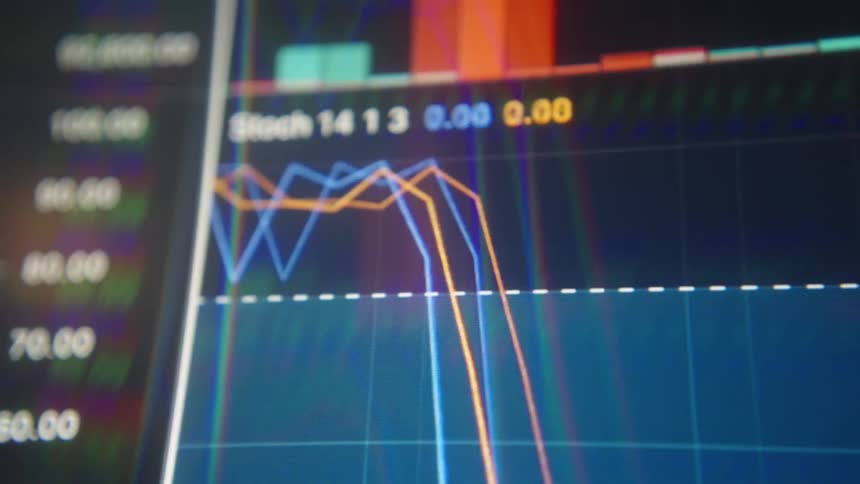
A screen shows a financial chart with multiple lines and bars that fluctuate
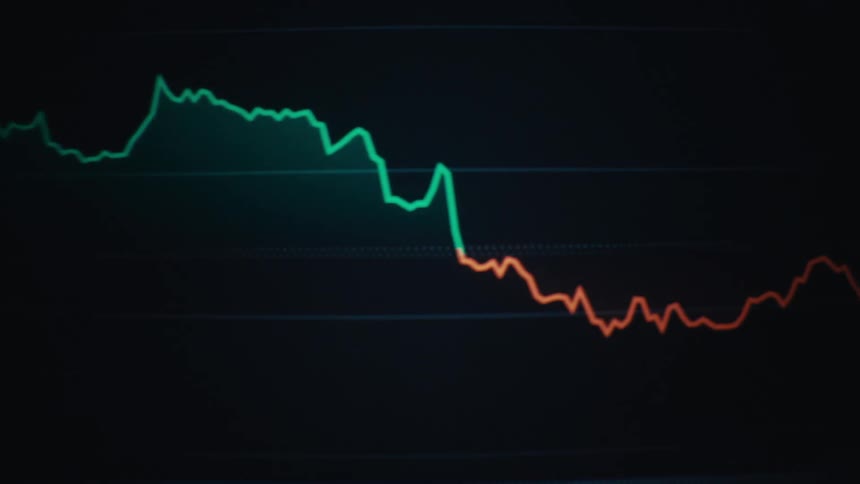
A digital investment graph trend line shifting between going up and down as a stock trading market prognosis or index of the finance sector affected by the global economy in the darkness on black flickering retro computer screen
Charts are flashing on the computer screen
The screen on the phone shows a cryptocurrency
A person is pressing the tablet
The financial markets are crashing due to a recession making stocks and shares drop and go down in price with decreasing value symbolized by a falling candlestick chart with red candles on a RGB pixel screen with black background
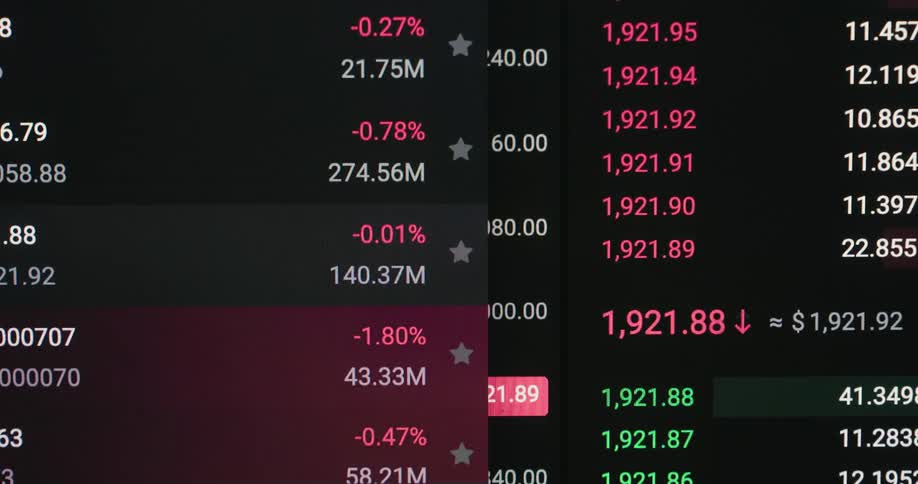
Values and changes in red and green displayed on a financial market board
An animated bar graph with a red arrow illustrates a declining trend, symbolizing financial loss or economic downturn
Red falling financial market chart
A finger points at a tablet screen displaying a fluctuating stock market graph
Candlestick and line charts display variations on a financial panel
A persons finger sets a newtons cradle in motion causing the silver balls to swing rhythmically
Numbers flash on the screen fast
Stylized financial chart with multicolored candlestick patterns
A finger scrolls a glowing market chart on a screen that shows fluctuating prices with sharp dips and recoveries
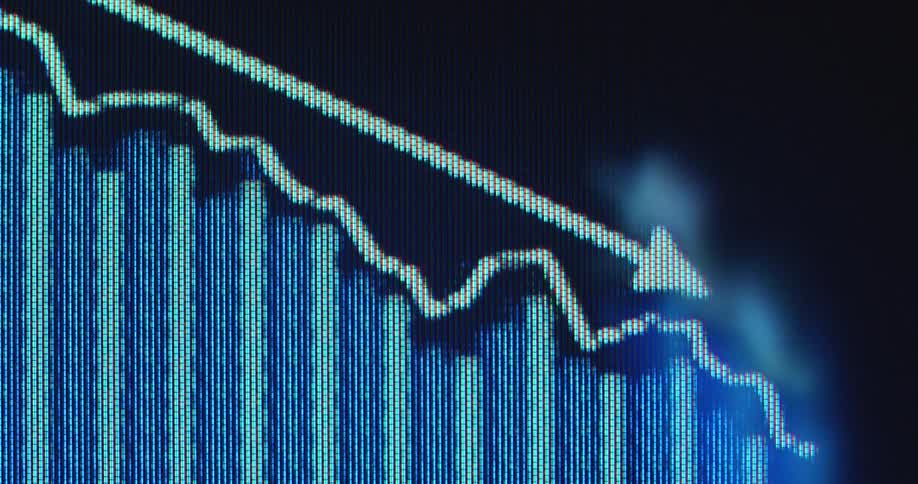
Negative statistical data presented on a pixelated display device as the bars and arrow trend line follow a declining price development symbolizing a failure of the financial system and recession of the global economy
Close up of a blurry device screen displaying a trading interface in green over a dark background
Numbers and a graph are on the computer screen
The numbers move fast on the monitor
A finger scrolls through a stock market chart on a smartphone in a closeup shot
A futuristic animated stock market or cryptocurrency trading chart displays real-time fluctuating values and data analysis
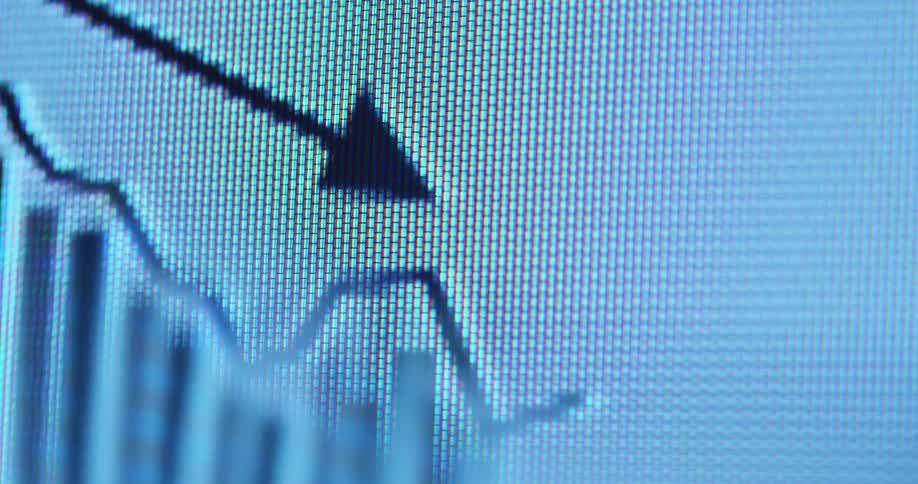
A macro view of a digital screen shows a black animated graph with a falling line chart and a downward pointing arrow overlaying vertical bar charts representing a market decline or financial loss on a white background
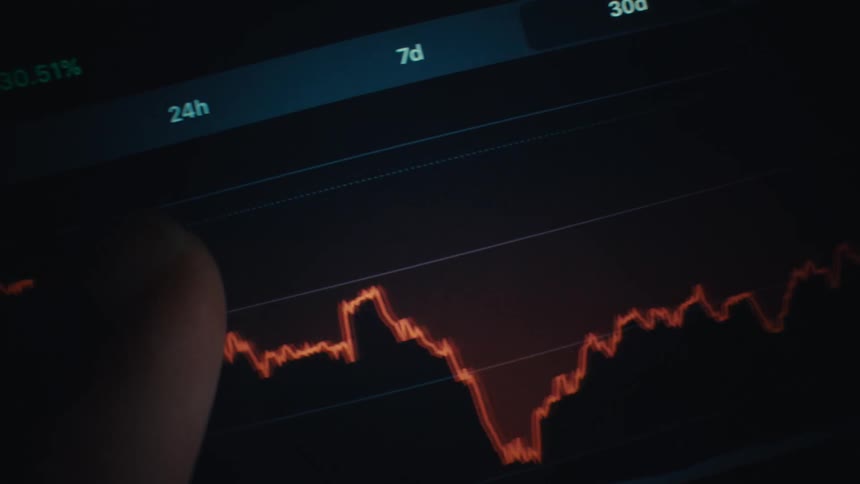
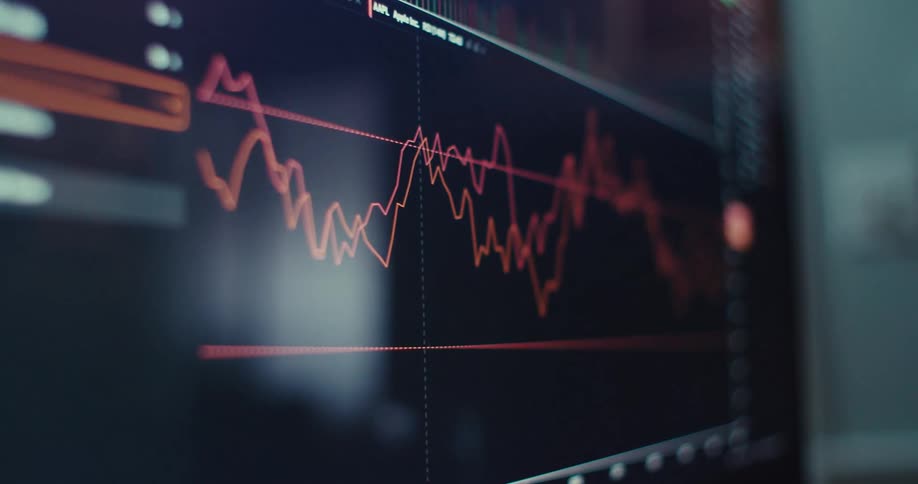
A close up view of a computer screen displays fluctuating orange and red line graphs against a dark background
Line graphs and numbers move across the monitor
A bright blue beam of light rising on a black background
Close up of digitized trend line graph moves up and down on the smartphone screen or computer monitor as symbol for volatility of the finance industry business and share market that requires good investment strategies to successfully earn money
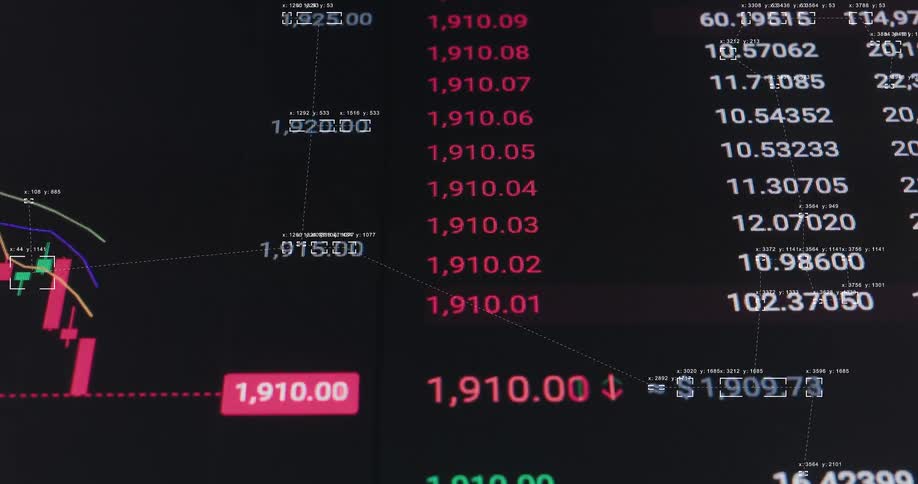
Digital table with market numbers and percentages in green and red
Financial candlestick chart against a gray screen
A vibrant green digital graph displays fluctuating diagram consisting of lines and vertical bars with a prominent downward arrow indicating a decline of the Wall Street stock market or global economy with negative price development
Closeup of a display containing a graph and a few spots of glare
Financial chart with colored lines and areas showing market fluctuations

Need help finding the
right footage?

Have it delivered to your account within 1 business day.
This is Filmsupply

Our StoryOur FilmmakersArticlesFilmsPopular SearchesAll Categories

FM

A family of brands dedicated to empowering the creative.

FILMSUPPLY

Footage licensing for productions

MUSICBED

Music licensing for filmmakers

STILLS

Image licensing for creatives

© 2026 FM LLC.

Privacy PolicyLicense TermsTerms & ConditionsCareers