Musicbed
Filmsupply
Stills
Contact Us(800) 805-6802
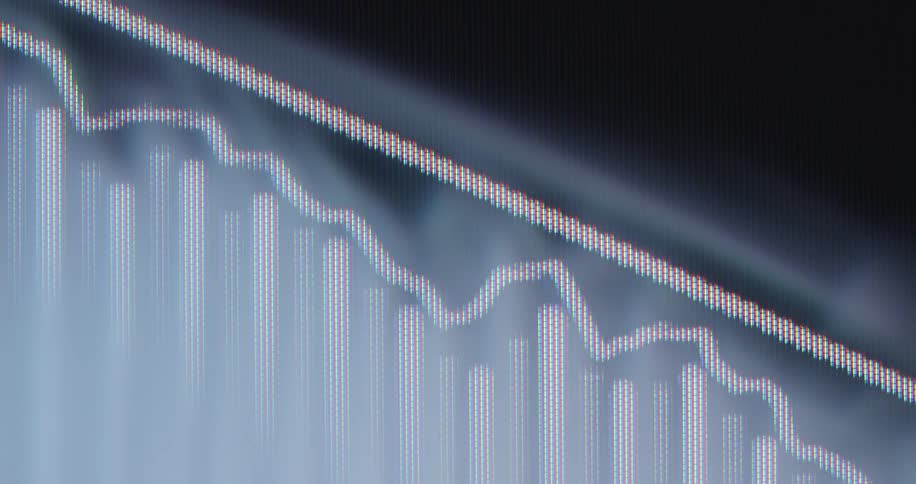
Red candlestick charts indicate sharp market downturn with fast price movement and negative development caused by stock or finance market crash and recession displayed on digital computer screen causing stress and panic while assets lose value
A digital clip of a trading chart
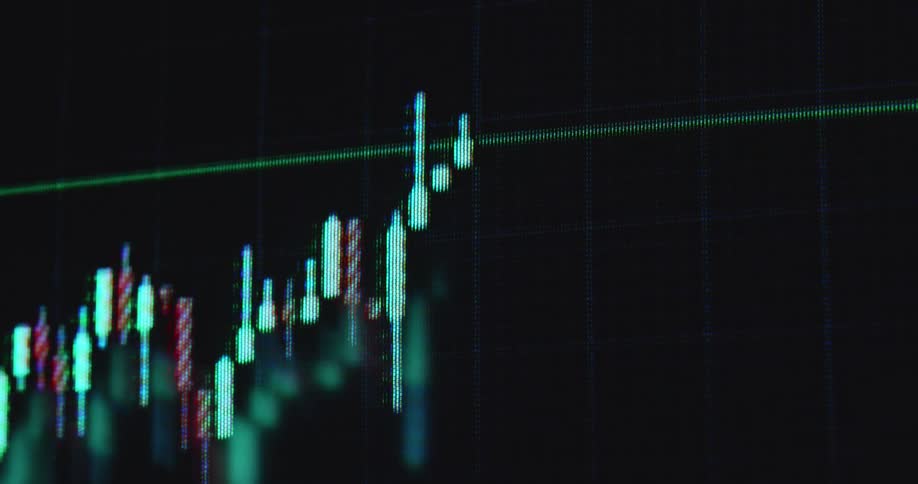
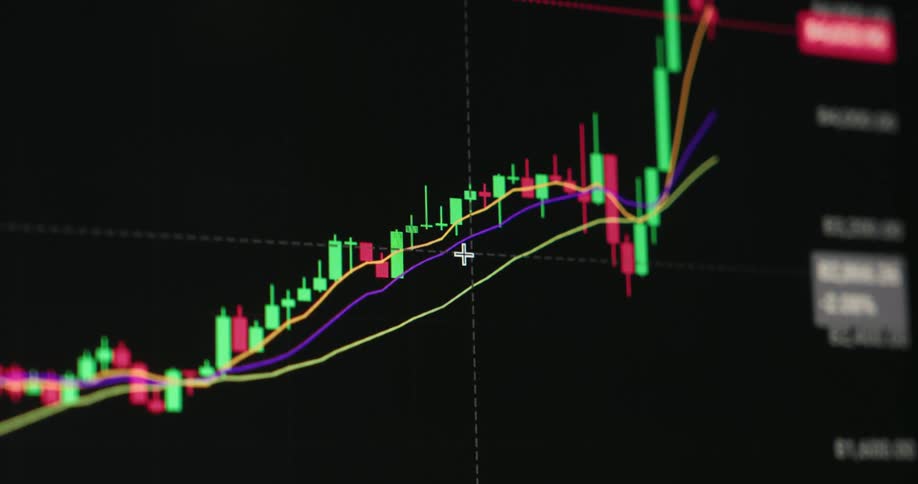
A candlestick chart or trading graph animation showing a stock price or crypto currency rising over time with exponential growth and a positive trend or development on a dark computer screen with RGB pixels as symbol for a growing shares or bond market
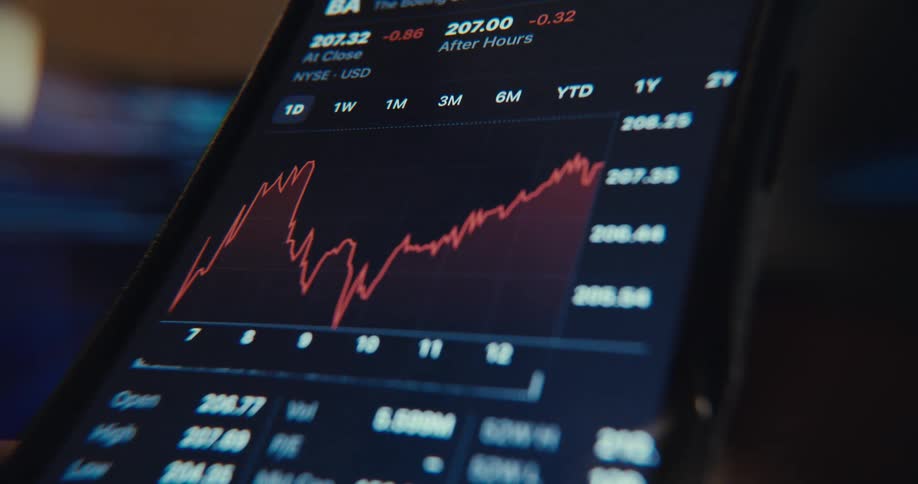
A stock price chart is displayed on a computer screen
Red falling trading chart of an online stock broker or crypto exchange in a downward trend during a bear market crash and financial crisis symbolizing failure bankruptcy insolvency and losses caused by declining international and global economy
Series of stock market price lists displayed on a computer screen
A close up of a stylus on a smart phone screen
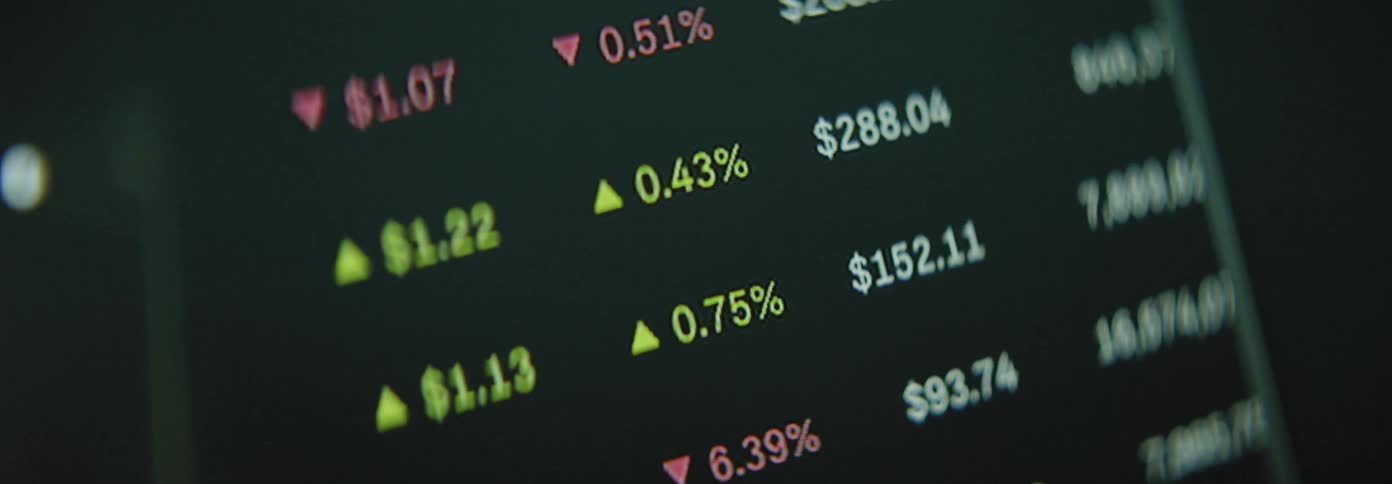
Closeup of a screen displaying numbers and percentages
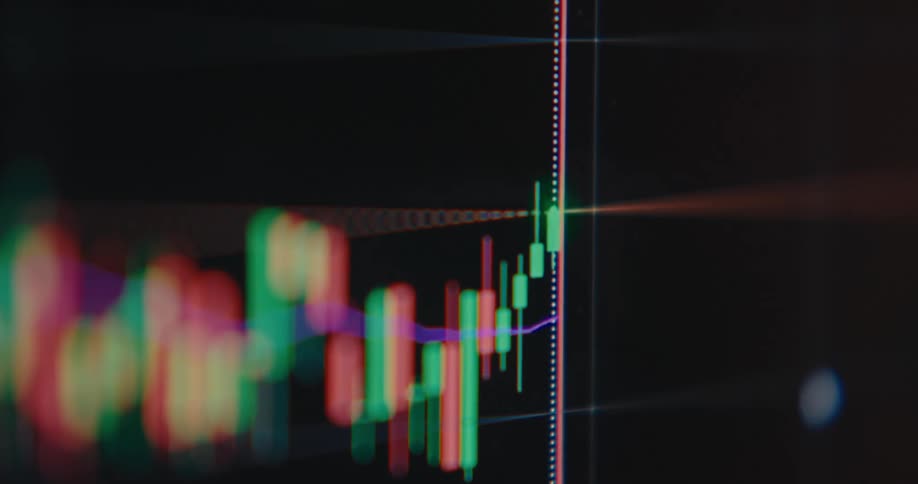
Close-up of a real-time digital stock market candlestick chart showing a bullish upward trend on a computer screen
A smartphone screen displays various stock market charts rapidly changing between green upward trend and red downward trend graphs for different companies and indices
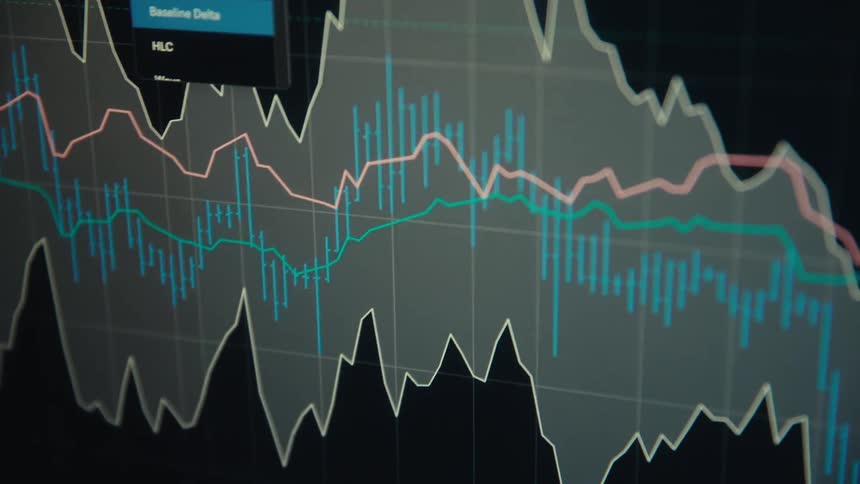
Multiple lines and a candlestick chart occupy the same graph on a digital screen as a selection is made
A macro shot of a financial trading application displaying a live order book with changing figures
Falling financial market chart against a background of abstract numbers
A clip of a digital chart
A macro shot of a volatile stock price rapidly increasing on a digital trading screen, showing a significant percentage gain
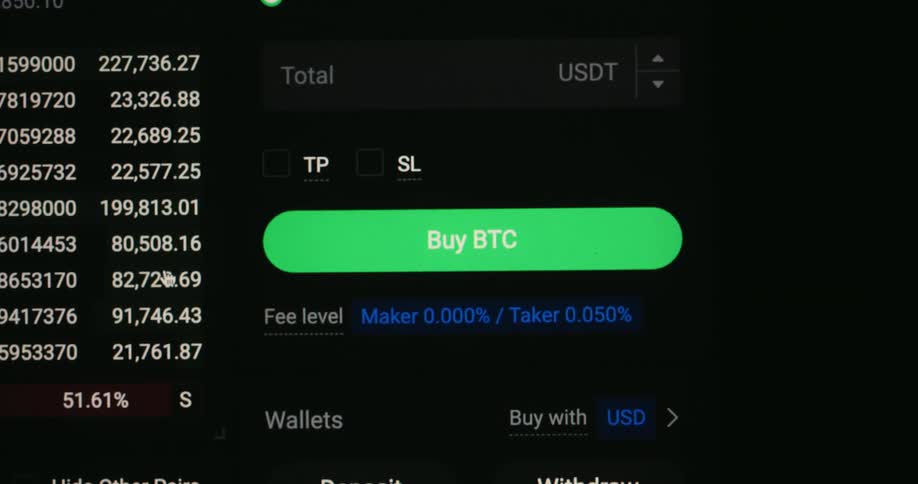
A closeup of a cryptocurrency trading app screen shows a highlighted buy btc button and fluctuating market data as the view tilts dramatically
Volatile candlestick chart rises and falls to bottom of screen due to dramatic market crash or collapse causing panic and global economic recession providing great trading opportunities for day-traders that view volatility as opportunity and buy the dip
Blue and orange financial chart lines displayed on a digital screen
A line graph is on the computer monitor
A blurry close-up of a green stock market chart on a digital screen showing fluctuating data and an upward trend
A finger scrolls through a touchsceen
A macro shot of a financial chart on a screen displaying a red 'Sharp drop' notification indicating a market crash
A computer screen with a green graph on it
Screen with graph in the financial market
Negative statistical data presented on a pixelated display device as the bars and arrow trend line follow a declining price development symbolizing a failure of the financial system and recession of the global economy
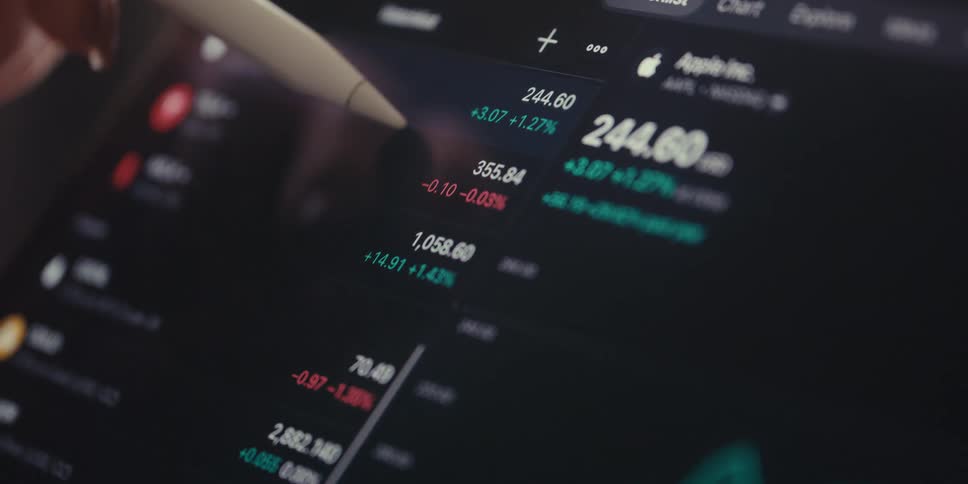
A digital pen pointing to financial data displayed on a screen with stock information for apple and other companies visible suggesting market analysis or trading
Candlestick financial chart on a screen indoors
The video features a closeup cinematic shot of a digital stock market ticker displaying fluctuating financial data green and red numbers scroll across the screen highlighting various stock symbols and their realtime price changes
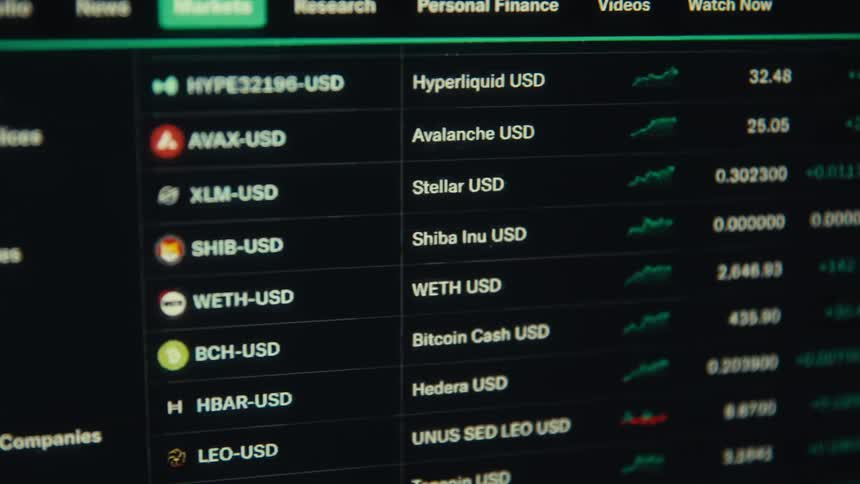
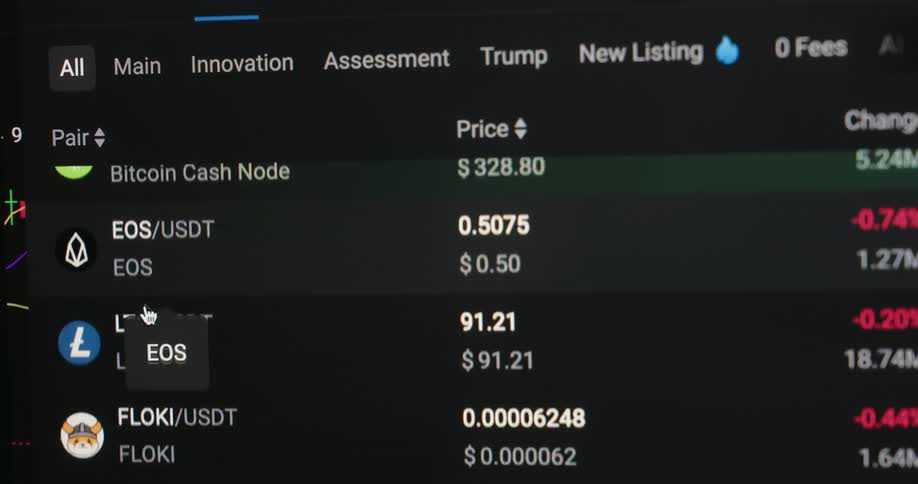
Crypto information scrolls on the screen
A blurred, close-up, and stylized animation of a digital stock market chart with glowing lines and fluctuating data
Screen displaying bearish financial market graph as candlestick chart crashes while stock and crypto currency markets decline and assets lose their value due to drastically decreasing and falling prices causing panic sales and recession with volatility
A close up of numbers and text on a scren
A screen where there is a trading chart with red and green lines that are going up and down and there are numbers on the right side
A macro shot of a digital screen reveals a rapidly changing stock market graph, with prices fluctuating and a green line trending upwards
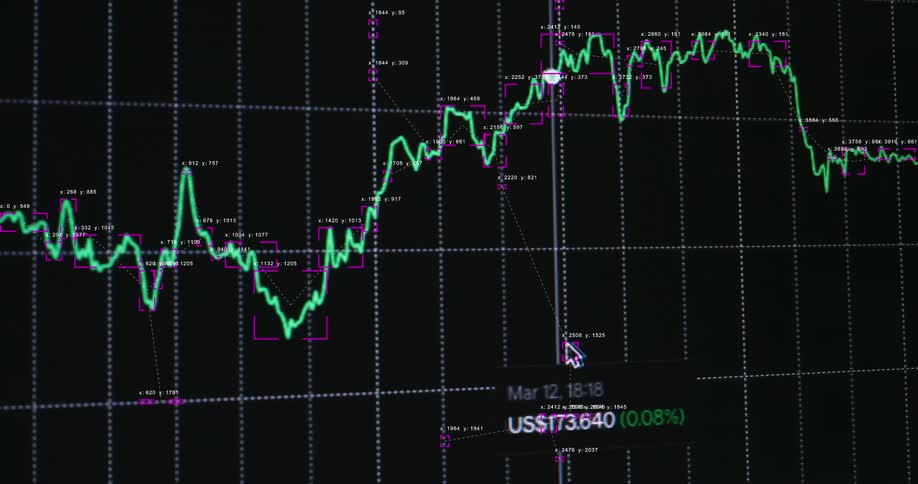
A high-tech digital animation shows a fluctuating green line graph on a stock market or cryptocurrency exchange chart with data analysis overlays
A stylus pen points to and scrolls through various financial figures cryptocurrency market caps for usdt and xrp and fluctuating line graphs displayed on a dark digital screen in a dimly lit room
An abstract, glowing line graph fluctuates over a blurred candlestick chart, visualizing the volatility of the financial stock market
A digital chart with a downward-pointing arrow slowly pans across a screen, symbolizing economic decline
A macro close-up of a digital screen shows stock market or cryptocurrency prices fluctuating in real-time
A computer screen displaying a stock price chart with green and red candlestick patterns
The monitor has a color coded line chart on display
A soft-focus close-up of a digital stock market board shows fluctuating red and green numbers, symbolizing market volatility and trading
Macro view of a digital screen showing a white animated financial graph and arrow moving upwards on a black background
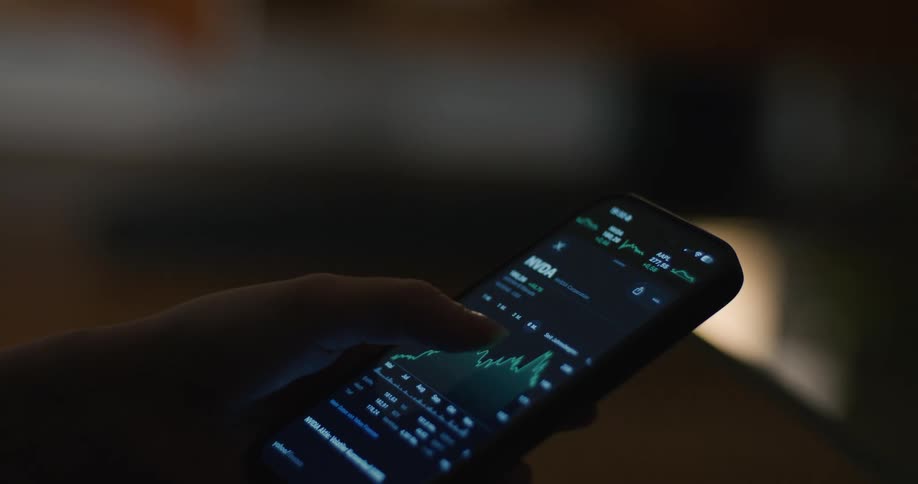
Graph and numbers moving on the screen of a smart phone
A macro close-up of a digital screen shows an animated financial chart with a positive upward trend
A close-up of a digital stock market chart displays real-time price fluctuations with candlestick patterns on a screen
Extreme macro close up of a stock chart candle diagram with red and green candles and increasing and decreasing numbers on a dark digital computer screen with pixelated image and distortion
Closeup shots of computer and laptop screens showing realtime stock market fluctuations
Closeup shot of multiple screens displaying realtime stock market data and charts
Finger pointing at a market line chart displayed on a digital screen
A mouse cursor hovers over a green buy btc button on a cryptocurrency trading platform interface as price data and wallet options scroll by
A person uses their tablet to check stocks
People walk by the line graph on the monitor
A closeup view of a trading dashboard showing live financial data
Hand holding a smartphone displaying a financial chart on a lit screen
A shallow depth of field close-up captures a vibrant, fluctuating candlestick chart on a digital financial trading screen
A real-time digital trading chart fluctuates on a screen, with the line graph indicating financial gains and losses
Financial information is displayed on a screen as it is scrolled
A financial chart with red and green bars and colored lines is displayed on a dark screen
Hands of two people pointing at a laptop screen displaying a graph
A close-up of a dynamic digital stock market chart shows the fluctuating value of an asset over time with technical data analysis
Person selects time intervals and points on graph on phone display
Extreme close-up of a declining financial chart on a digital screen with a downward-pointing arrow indicating a market recession

Need help finding the
right footage?

Have it delivered to your account within 1 business day.

This is Filmsupply

Our StoryOur FilmmakersArticlesFilmsPopular SearchesAll Categories

FM

A family of brands dedicated to empowering the creative.

FILMSUPPLY

Footage licensing for productions

MUSICBED

Music licensing for filmmakers

STILLS

Image licensing for creatives

© 2026 FM LLC.

Privacy PolicyLicense TermsTerms & ConditionsCareers