Musicbed
Filmsupply
Stills
Contact Us(800) 805-6802
The line graph is moving on the screen
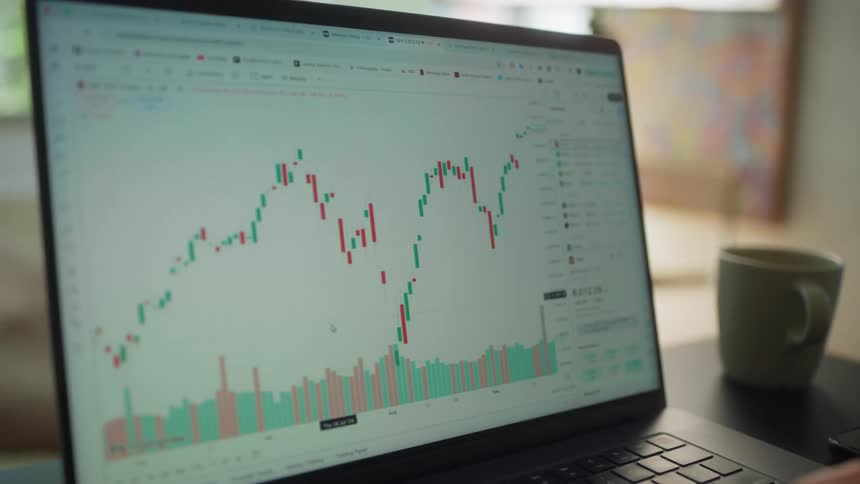
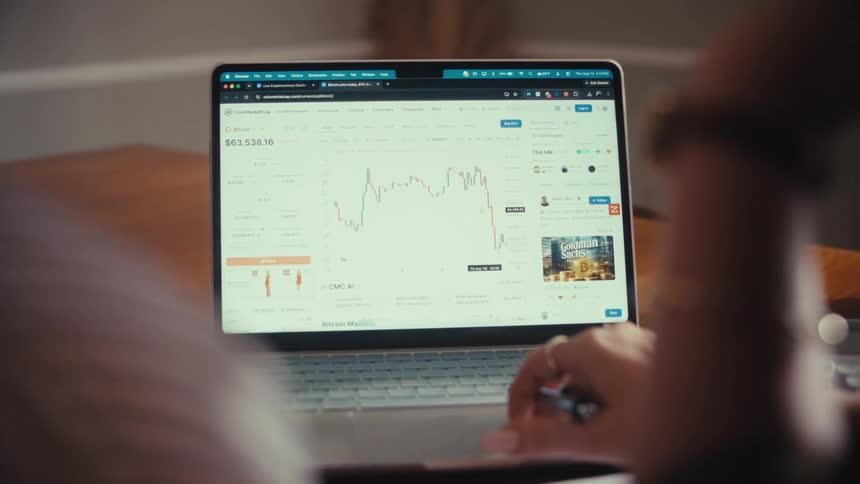
An over-the-shoulder shot shows two people analyzing a fluctuating financial graph on a laptop screen
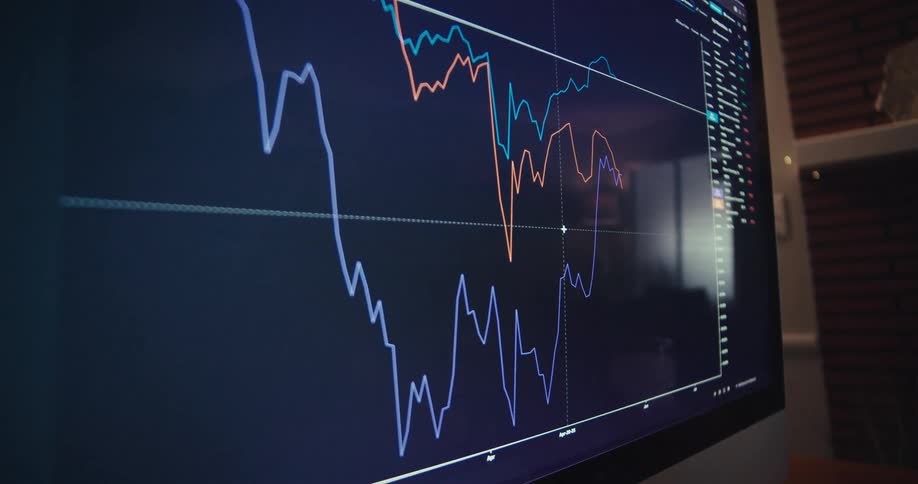
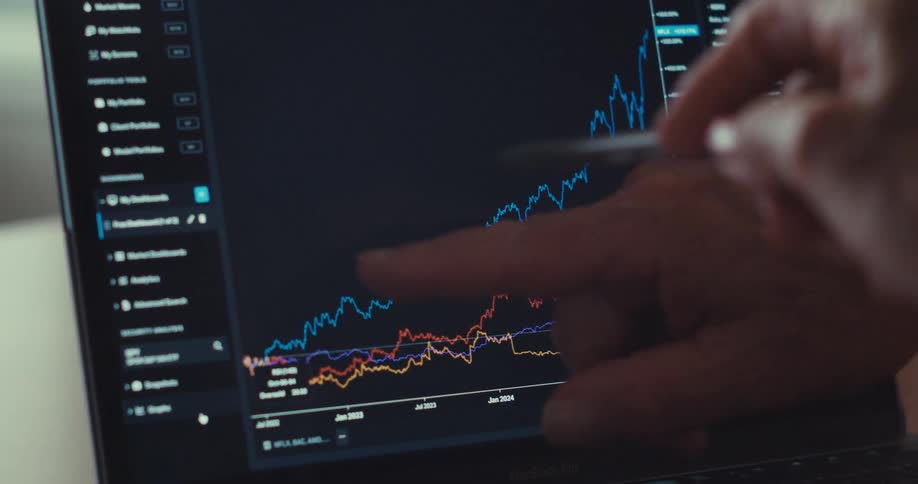
Blue and orange financial chart lines displayed on a digital screen
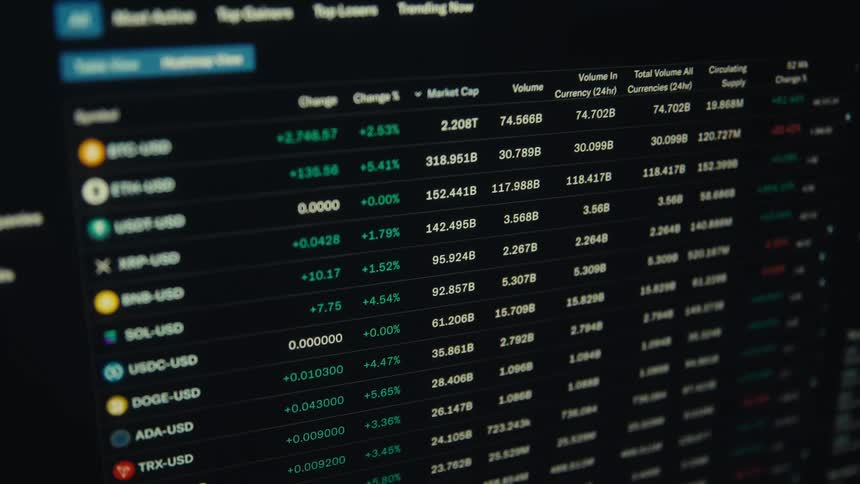
A computer screen displaying a stock market price list with rows of ticker symbols current prices percentage changes and colorcoded indicators for gains and losses
Stack of golden coins with the bitcoin logo printed on them in front of a screen showing a financial graph
A screen displaying fluctuating stock market numbers in focus
A man works on spreadsheets and graphs on his laptop
Red and green candlestick chart on a pixelated screen with RGB pixels as the bearish graph breaks resistance to the downside and the market or asset value collapses causing massive losses and volatility due to an unexpected crash
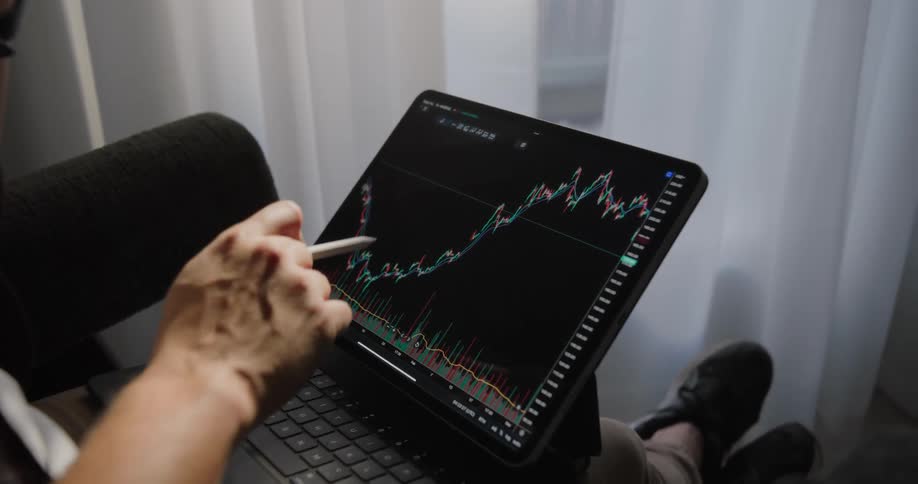
Close-up shot of a hand using a stylus to analyze a fluctuating stock or cryptocurrency chart on a digital tablet
Red falling trading chart of an online stock broker or crypto exchange in a downward trend during a bear market crash and financial crisis symbolizing failure bankruptcy insolvency and losses caused by declining international and global economy
A person scrolls through a graph on his laptop
Closeup of a display containing a graph and a few spots of glare
A red and green line graph depicting a sharp decline is prominently displayed on a dark background suggesting a financial downturn and loss
Closeup of a computer screen showing live stock market data and charts
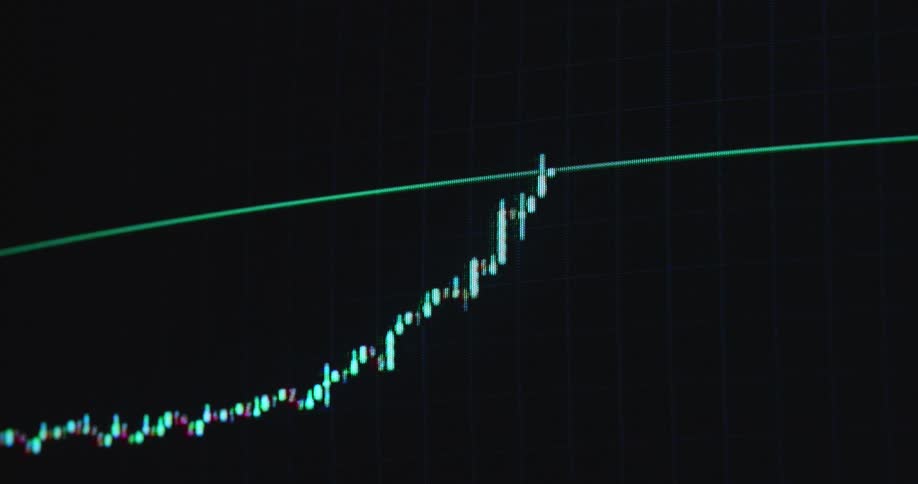
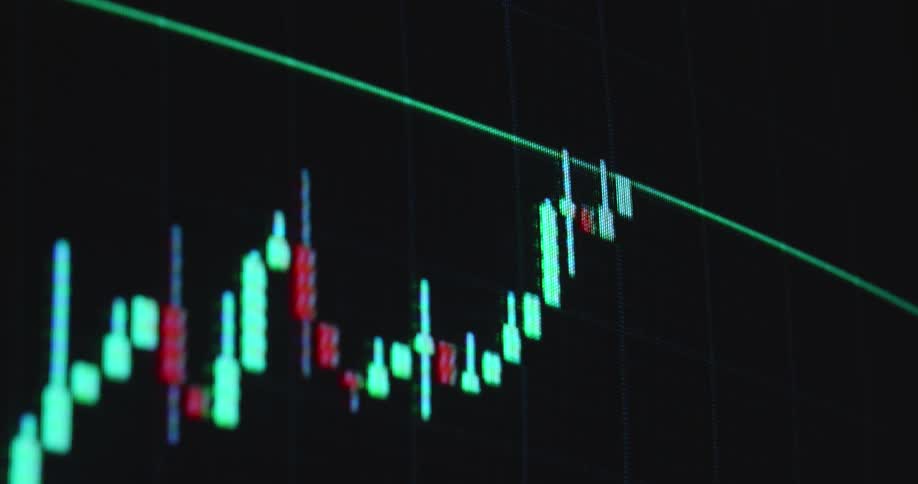
Green trend line drawing candles with wicks on dark pc screen creating bullish candlestick graph or pattern with upward tendency and positive price development symbolizing successful trade with profits via online trading platform or broker application
An abstract, out-of-focus digital stock market display shows red and green numbers rapidly fluctuating
Screen of a portable electronic with numbers and graphs
A stylus pen navigates a stock market app displaying a fluctuating graph on a tablet screen
A financial graph with an upward trend arrow and bar chart rises on a digital screen, with smoke effects adding a mysterious atmosphere
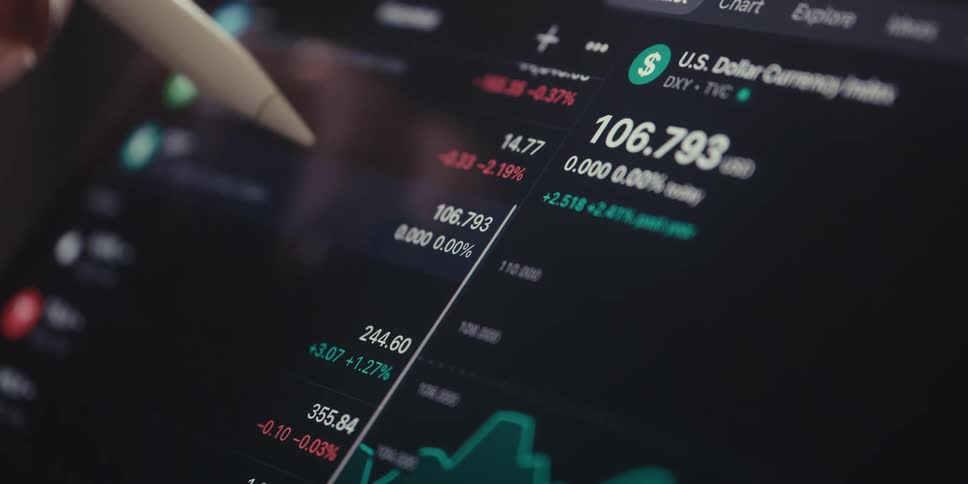
A digital pen hovers over a screen displaying financial data including the us dollar currency index suggesting analysis of exchange rates and market trends
A screen where there is a trading chart with red and green lines that are going up and down and there are numbers on the right side
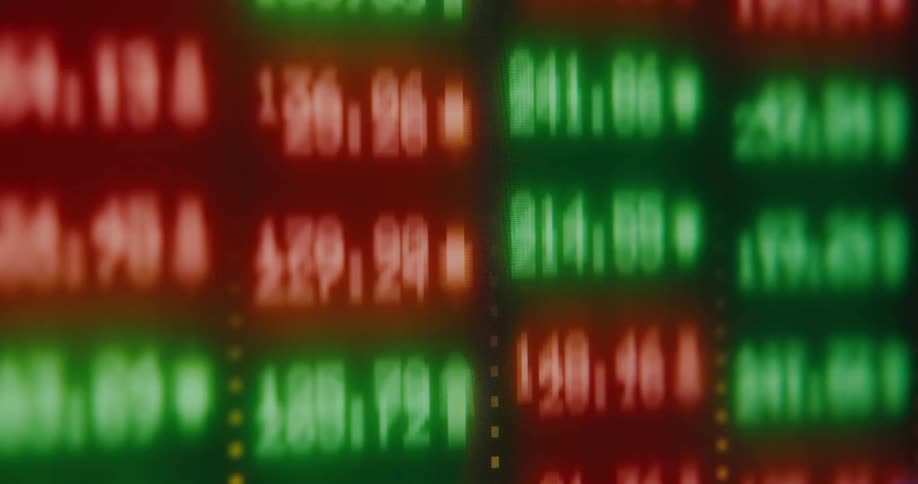
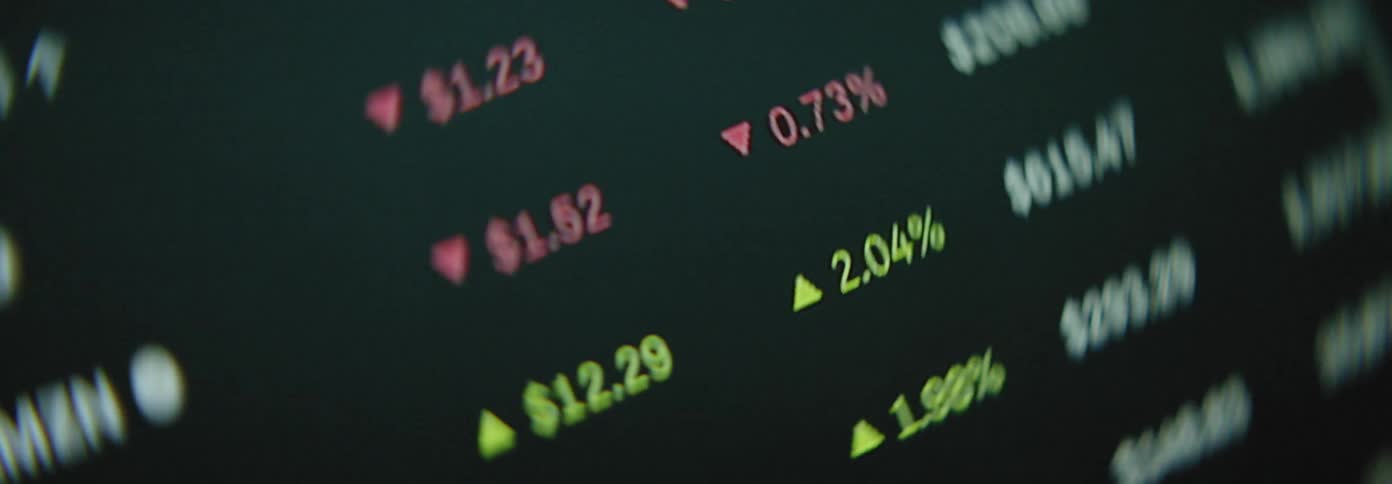
Stock numbers and ticker symbols in red and green displayed with blur effect
Two people point at the plot displayed on a laptop while collaborating
The pixelated computer screen shows the financial market reacting to a black swan event such as 9/11 causing a global economic crisis and crash followed by recession and great depression as the stock market collapses
Screen shows ai chat replying to a finance query in dim tech setting
A man points and draws on a graph on a laptop while sitting in a room next to a window
Glowing green and red digital line graphs display financial data on a dark background
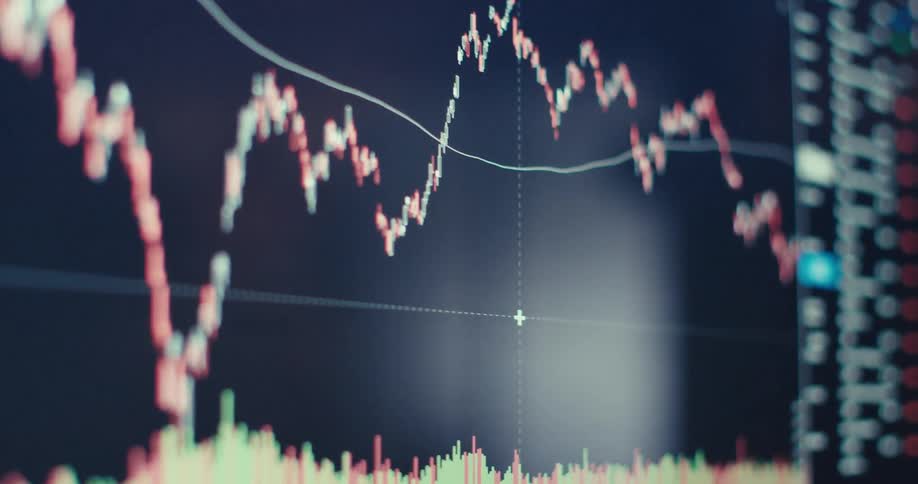
A graph on a screen with a black background and the graph has red and green ripples going up and down
A closeup view of a trading screen highlighting bitcoin btc prices and trends
A financial trader analyzes cryptocurrency charts on a laptop, zooming in to track market fluctuations
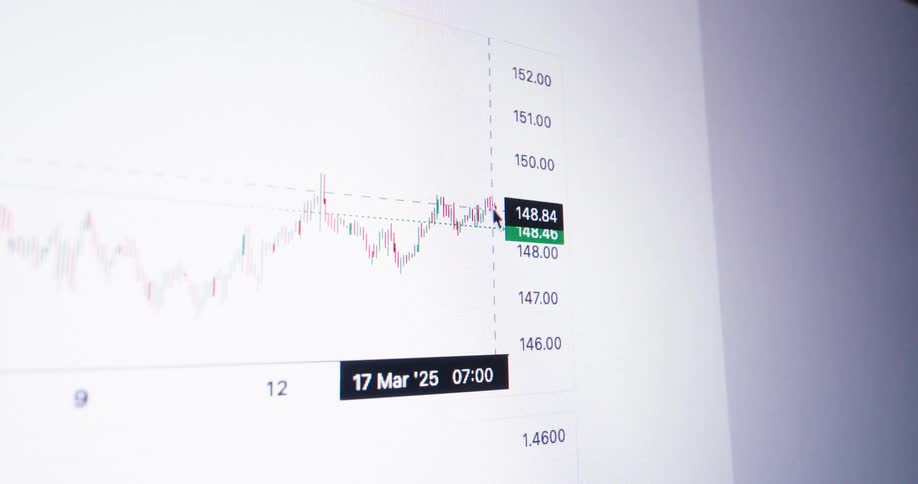
A display showing charts of a stock price
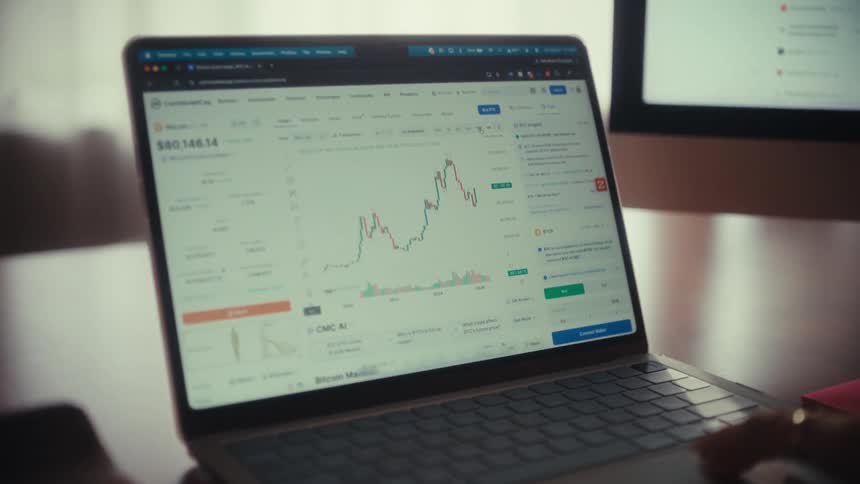
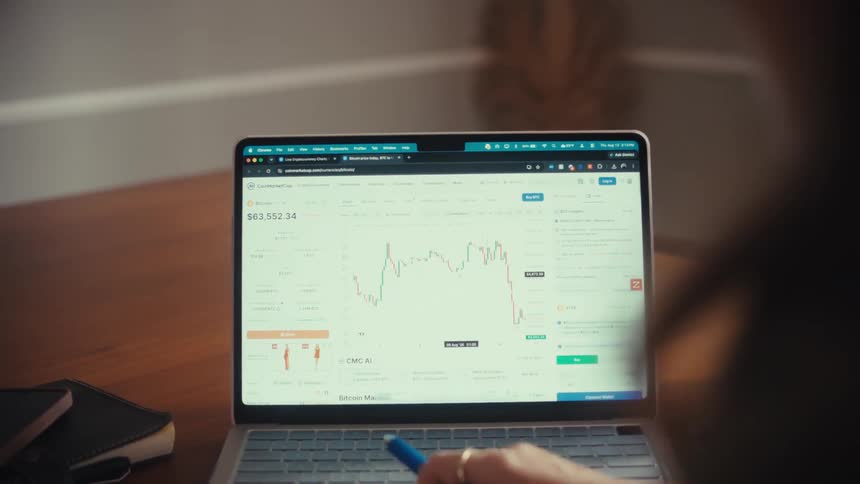
Over-the-shoulder view of a person monitoring the Bitcoin cryptocurrency price chart on a laptop screen
A clip of a digital trading chart
An abstract and distorted close-up of a rising green stock market chart on a digital screen
A close view shows blurry digital graphs and stock market data with red and green bars moving quickly across a dark screen
A woman dancing with an excited expression looking at a computer monitor
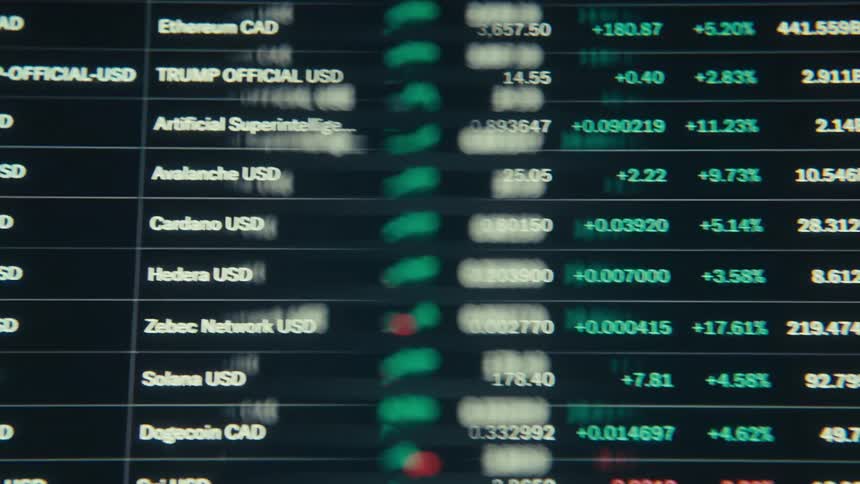
Cryptocurrency quotes display positive and negative variations in usd and cad
A slow zoom shot focuses on a laptop screen displaying a dynamic cryptocurrency trading chart as a person analyzes the financial data
A woman closely monitors stock market data and analytics on a large computer screen
A man is looking at a light graph on his monitor
Looking at a pixelated computer screen or monitor displaying a trading interface of an online platform as the bullflag pattern breaks out and the long green candles move rapidly to the upside causing gains and profits with shaky camera movement
Frontal macro close up of computer monitor or screen panel displaying the user interface of a stock broker or crypto currency trading exchange as a financial investment chart or data graph is going down with a negative price development
A closeup view of a stock market chart with red and green candlesticks fluctuating
A person is scrolling through a line graph on the cell phone
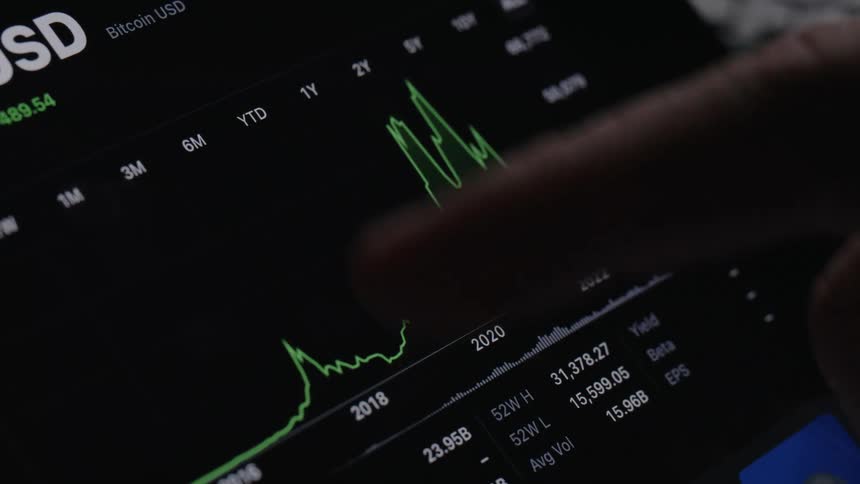
A persons finger touching a graph on a tablet screen
A person analyzes a cryptocurrency market graph on a laptop, using a pen to track the fluctuating data
A person is touching their tablet
Bullish and bearish financial market candle chart
Mouse scrolling over a graph of the value of a currency
A candlestick chart or trading graph animation showing a stock price or crypto currency rising over time with exponential growth and a positive trend or development on a dark computer screen with RGB pixels as symbol for a growing shares or bond market
Red and neon green glowing candles create a bullish candlestick chart pattern with upward movement and positive price development as symbol for a healthy commodity or equity market or profitable stock or crypto trades via online broker app
Extreme close up of a computer screen displaying two green sound decibel bars
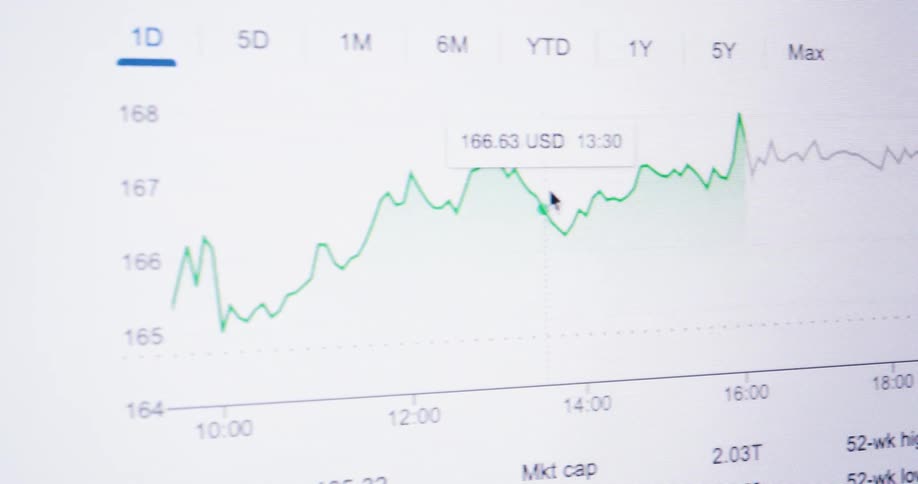
Scrolling on a chart showing the fluctuation in a stocks price
A closeup view of a stock market ticker displaying various stock symbols prices and percentage changes
Close up of a screen displaying a trading interface with candlesticks and other trading indicators
A pile of coins on a reflective surface with lit up arrows
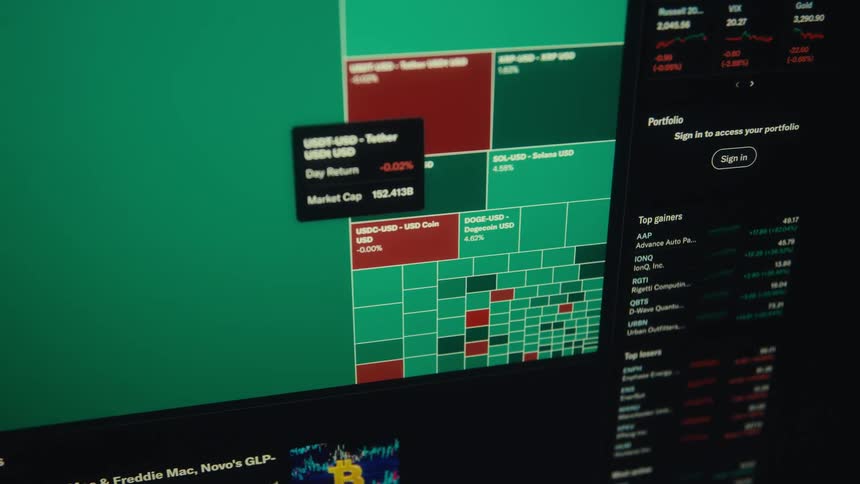
A tight greenandred treemap of market tiles with a hovering tooltip packed with tiny blocks and numeric panes conveys brisk watchful trading activity
Trend line drawing red or green trading candles on monitor creating a candle stick chart pattern with upward tendency and great price development showing a successful trade with good performance and profit on black screen with grid
Volatile candlestick chart rises and falls to bottom of screen due to dramatic market crash or collapse causing panic and global economic recession providing great trading opportunities for day-traders that view volatility as opportunity and buy the dip
A financial analyst tracks cryptocurrency price movements on a laptop in their office, with the camera slowly zooming in on the chart
Digital pixelated graph with positive trendline going up showing growth and financial strength of the global or US economy or an economical upward trend while making progress and profiting from business opportunities
A man is sitting at a desk using a laptop computer with a graph on the screen
A closeup view of a trading dashboard showing live financial data

Need help finding the
right footage?

Have it delivered to your account within 1 business day.

This is Filmsupply

Our StoryOur FilmmakersArticlesFilmsPopular SearchesAll Categories

FM

A family of brands dedicated to empowering the creative.

FILMSUPPLY

Footage licensing for productions

MUSICBED

Music licensing for filmmakers

STILLS

Image licensing for creatives

© 2026 FM LLC.

Privacy PolicyLicense TermsTerms & ConditionsCareers