Musicbed
Filmsupply
Stills
Contact Us(800) 805-6802
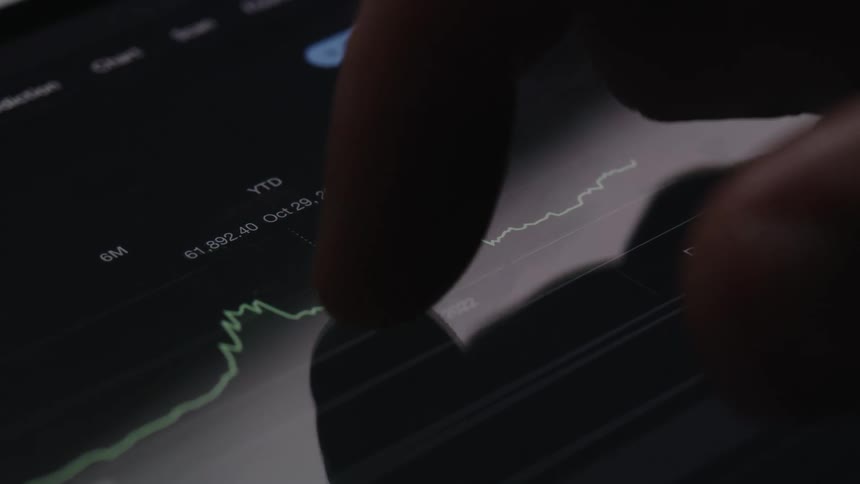
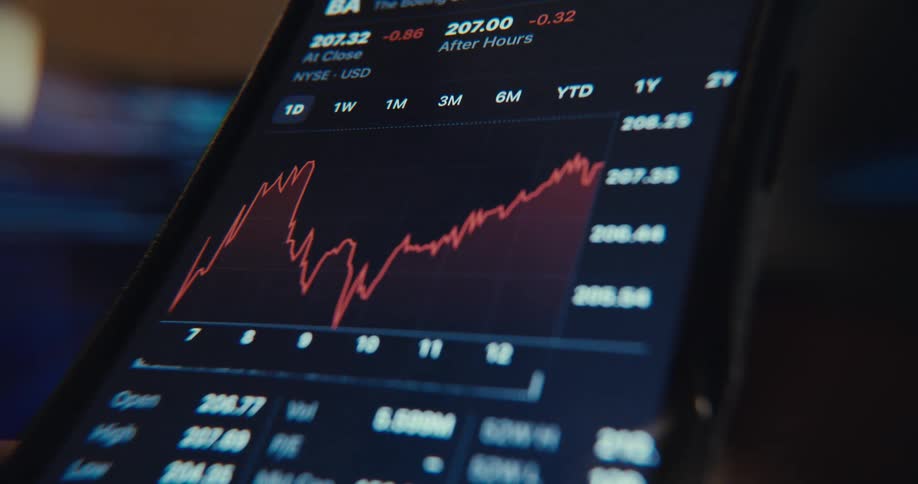
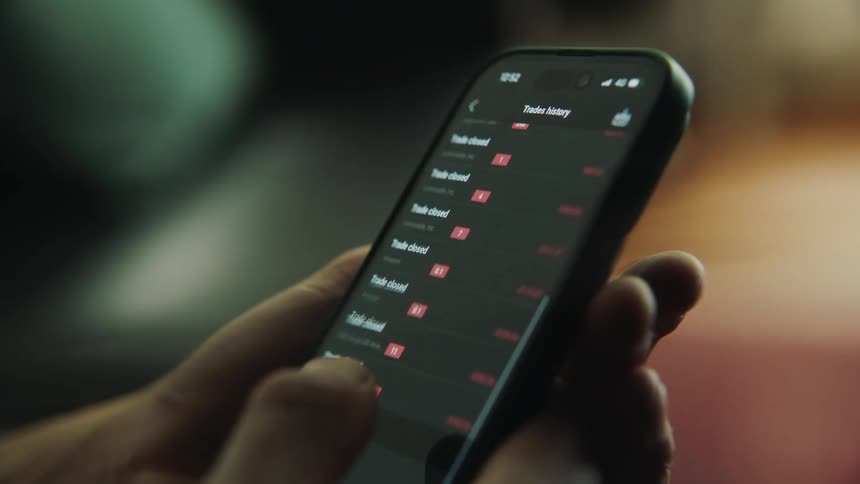
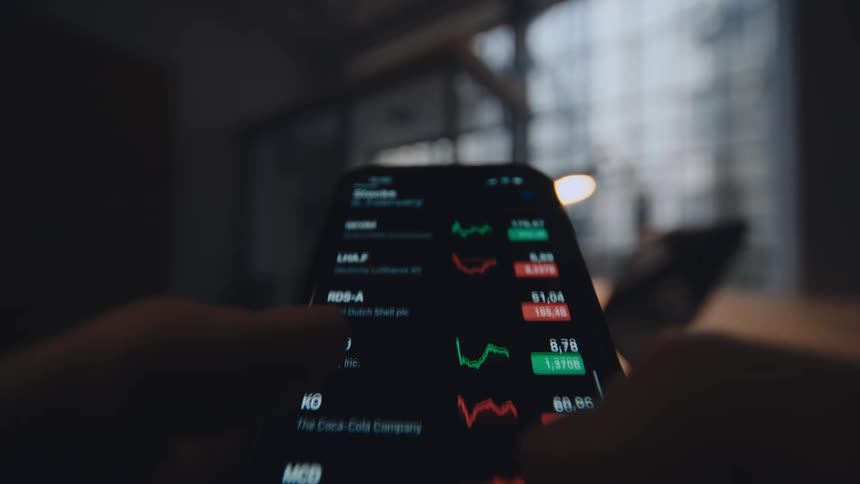
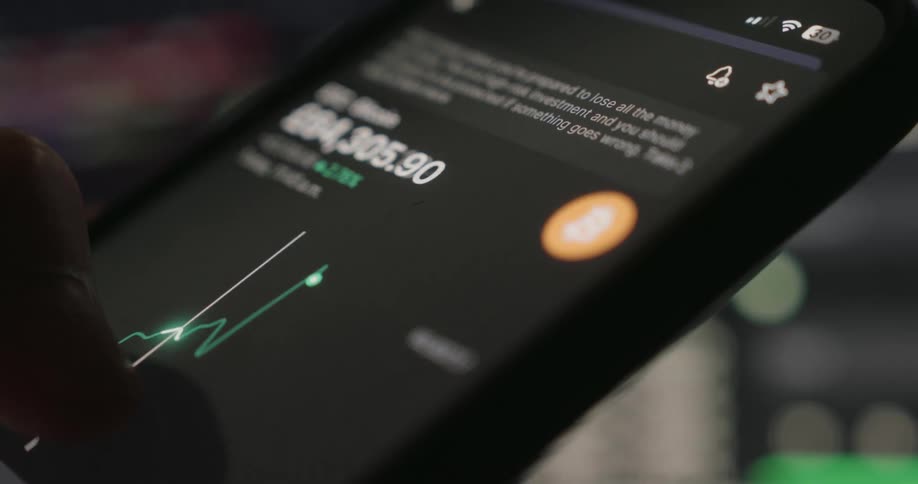
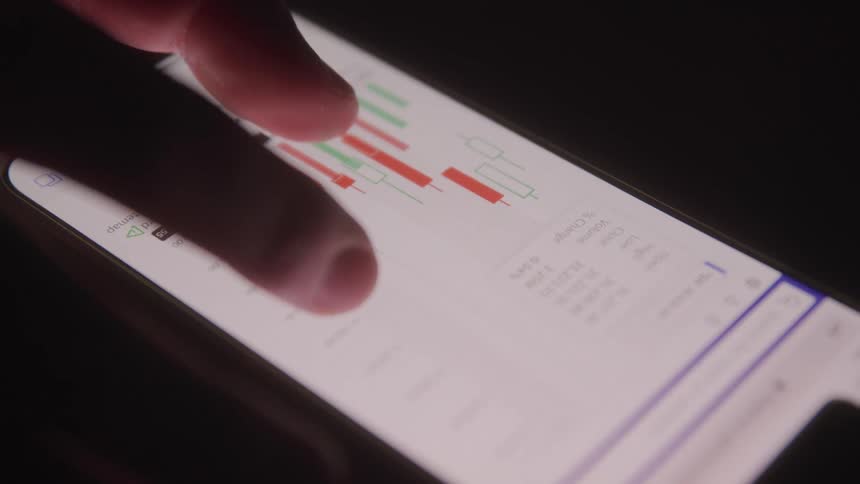
Close up view of a person browsing on their phone
A close up of some bar graphs and charts
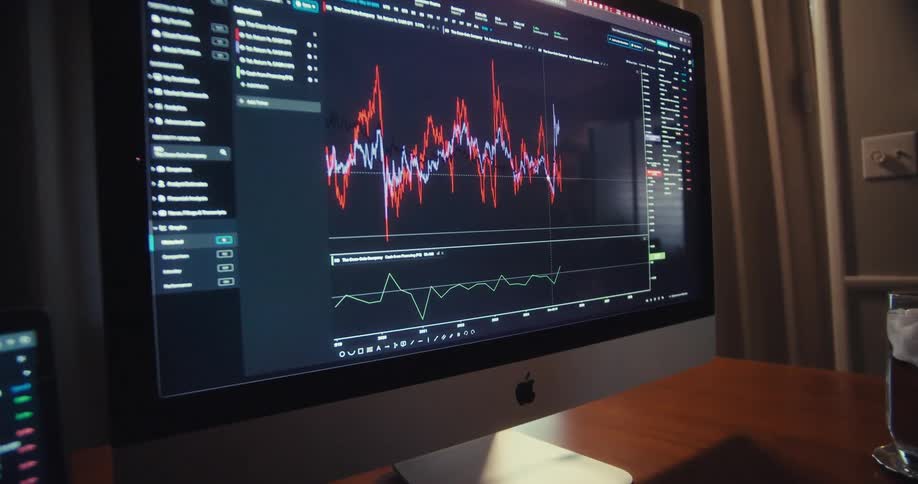
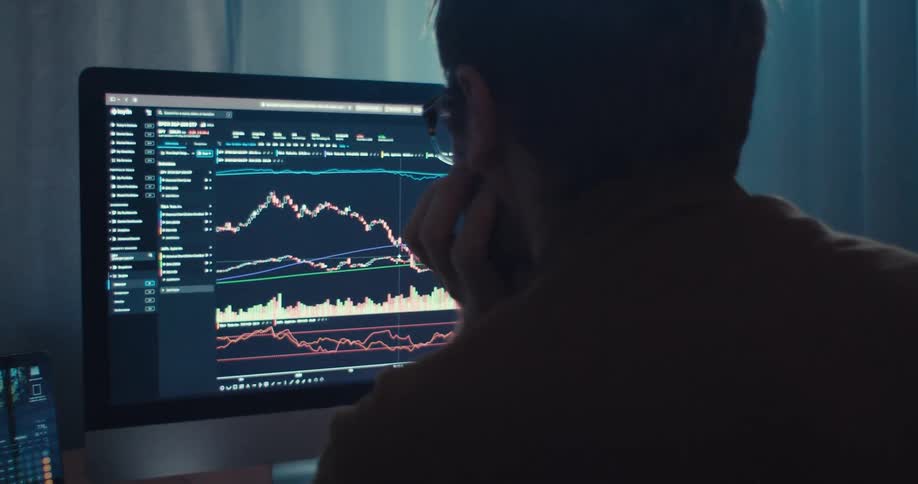
Person sits at a table at home and uses a computer displaying a graph related to trading
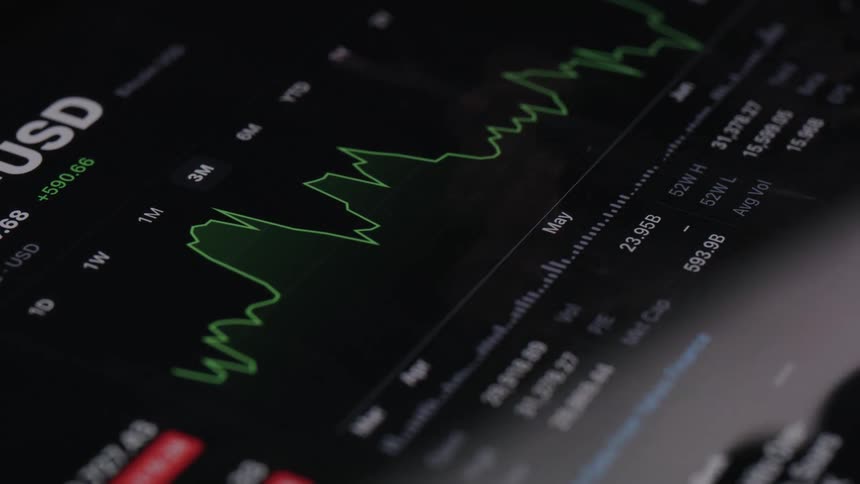
A blurry close-up of a green stock market chart on a digital screen showing fluctuating data and an upward trend
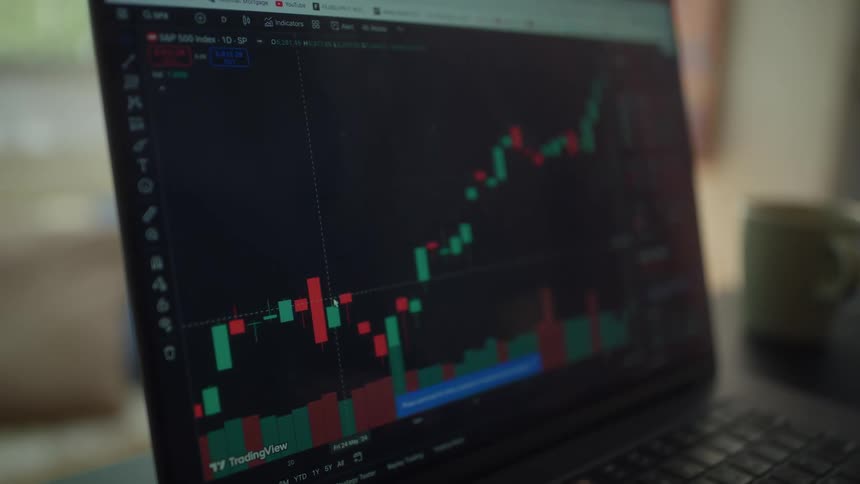
A man is sitting at a desk looking at a laptop computer with a graph on the screen
The animation is playing on the television screen
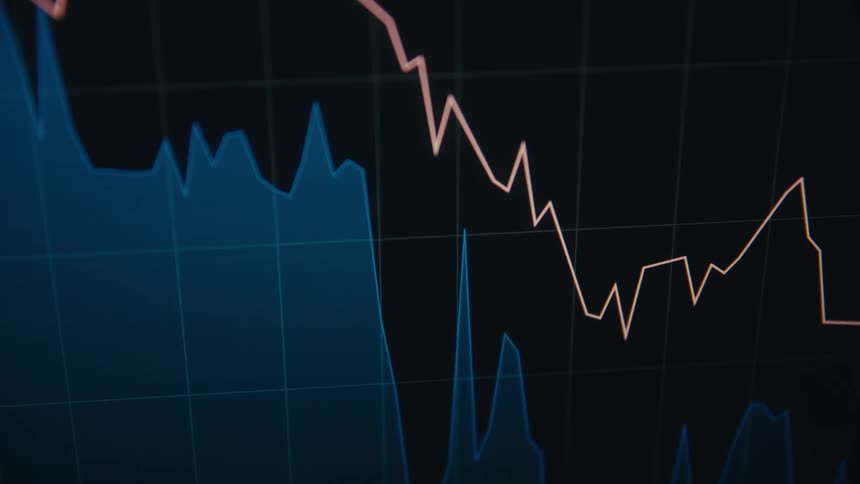
The line graph goes up and down on the monitor
Close up of man trading on a laptop and desktop computer in a room
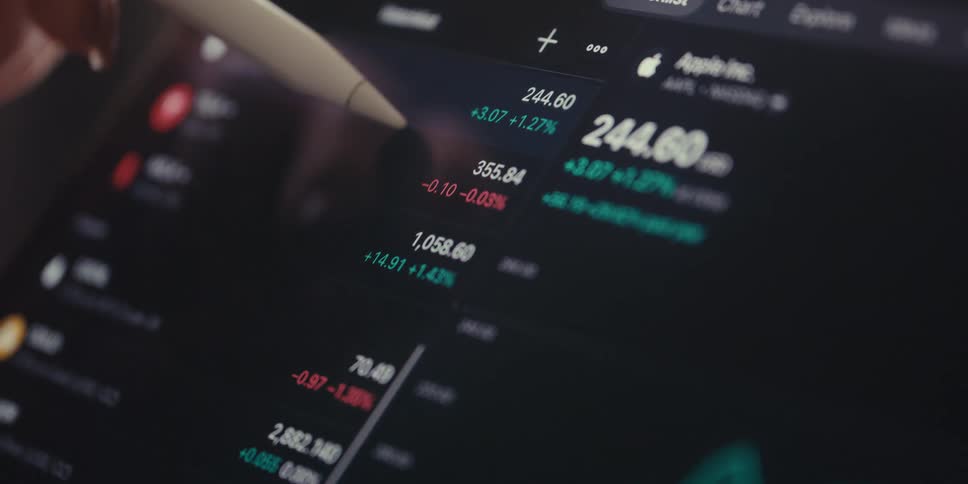
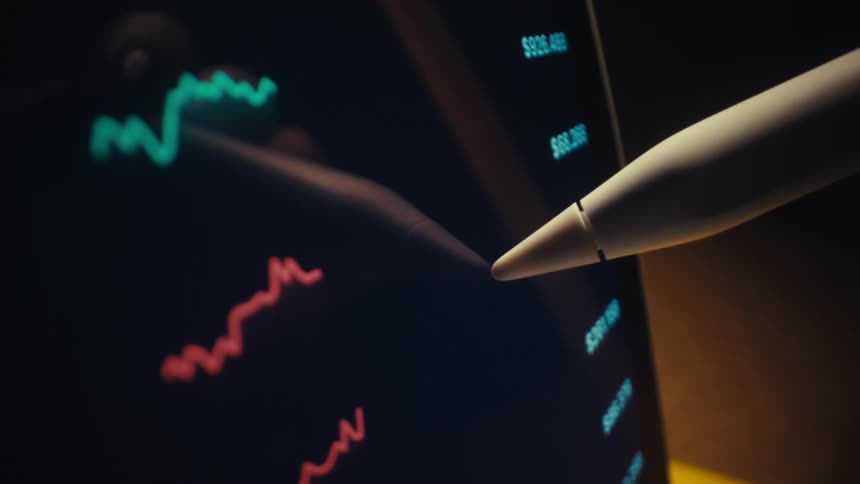
A stylus pointing at a glowing financial chart on a dark digital screen emphasizing data analysis and market trends
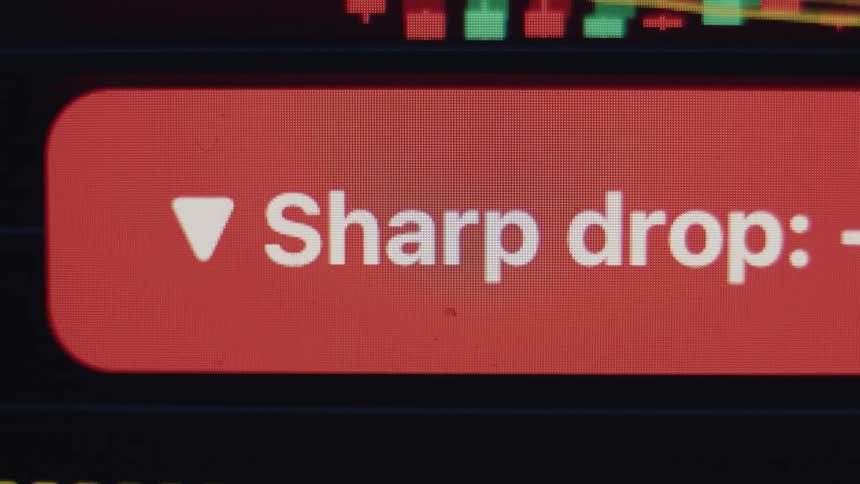
A macro shot of a financial chart on a screen displaying a red 'Sharp drop' notification indicating a market crash
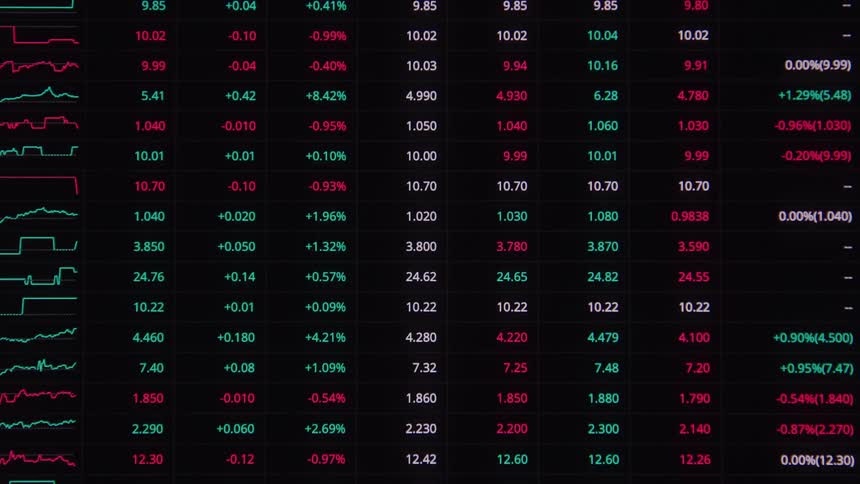
A closeup shot of a screen displaying fluctuating stock market graphs and numerical data
A smartphone screen displays various stock market charts rapidly changing between green upward trend and red downward trend graphs for different companies and indices
Information is scrolling on the screen
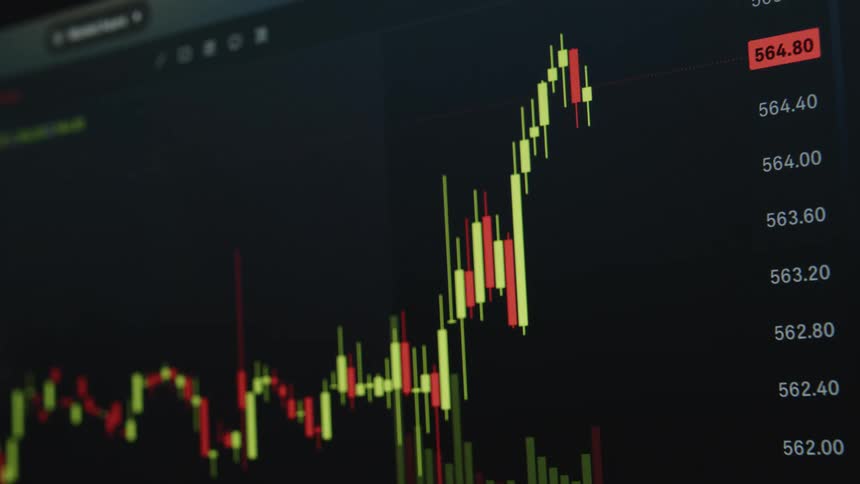
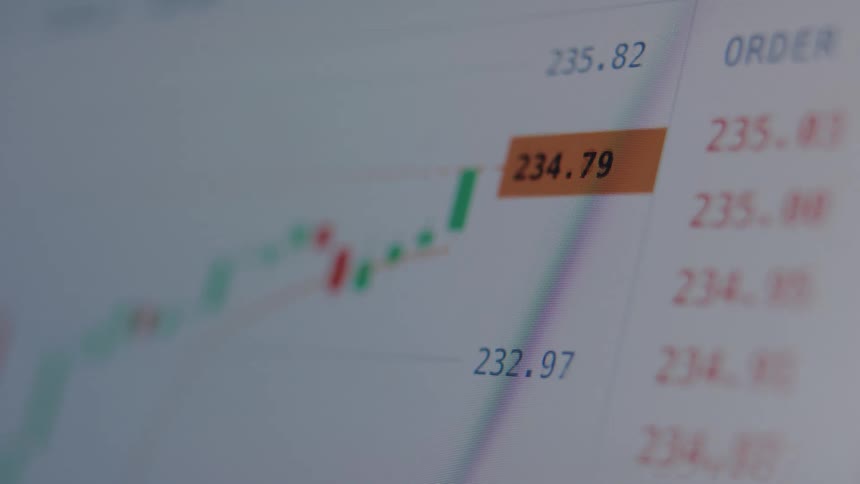
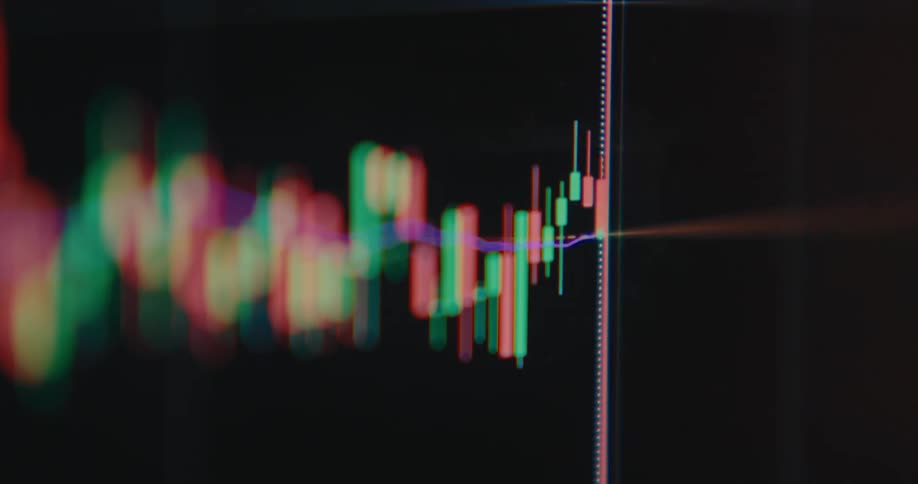
A shallow depth of field close-up captures a vibrant, fluctuating candlestick chart on a digital financial trading screen
A red arrow moves upwards across the screen as a bar graph animation is forming beneath it presenting statistical data and visualizing the dramatic increase of prices and production costs
Thats a close up shot of a stock ticker or financial data display showing fluctuating numbers and possibly candlestick charts
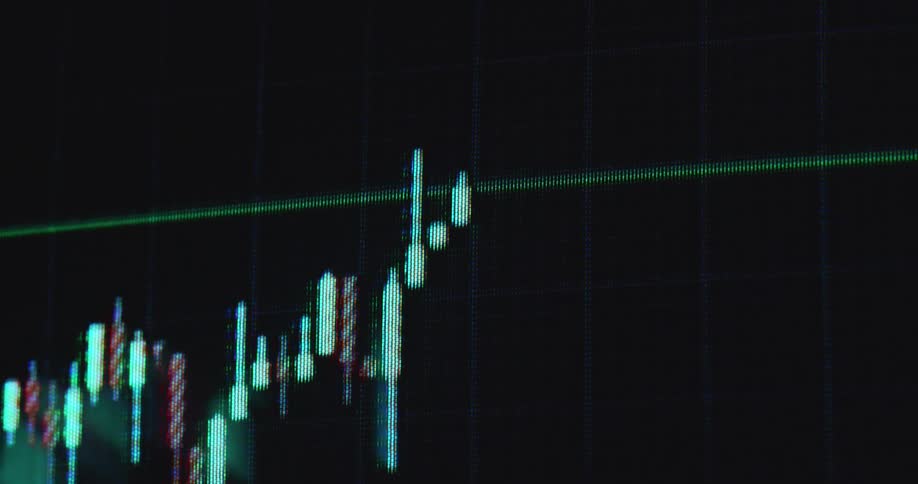
A bullish bull flag chart pattern is displayed on a dark monitor as the red and green candlestick candles form sideways consolidation before breaking resistance for a massive move to the upside with positive price development and profit in a bull run
Numbers of different colors flash on the screen
A person is scrolling stocks on his cell phone
Financial candlestick chart against a gray screen
A woman uses a pen to point out trends on a cryptocurrency chart displayed on a laptop to a colleague
A close up of numbers on a screen
Candlestick chart of ETF or exchange-traded fund with steady growth and positive price performance over a long time span or years as the price of the asset steadily increases with an uptrend and successful value development symbolizing good investment
An abstract, out-of-focus animation of a digital stock market chart shows fluctuating data and glowing trend lines
Woman makes selections on a touchscreen using a stylus
Someone uses a smart phone app to check stock prices
A digital pen pointing to financial data displayed on a screen with stock information for apple and other companies visible suggesting market analysis or trading
Green rectangles form a plot against a black background on a digital screen
A finger scrolls through a touchsceen
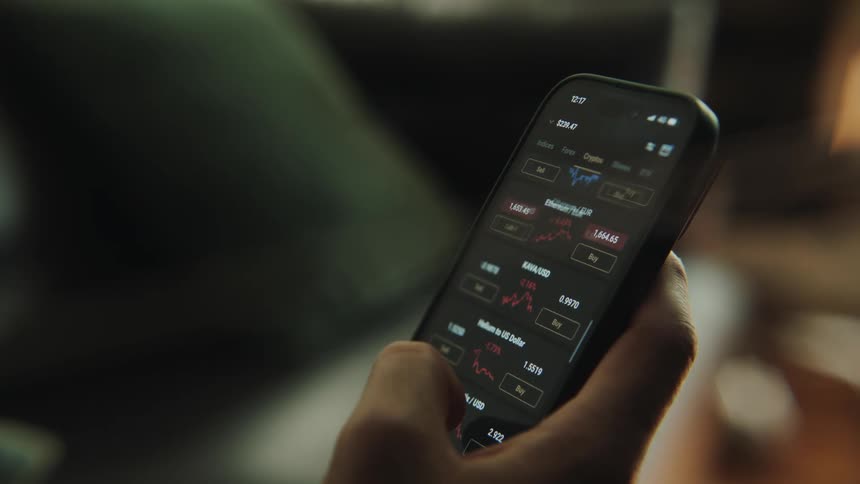
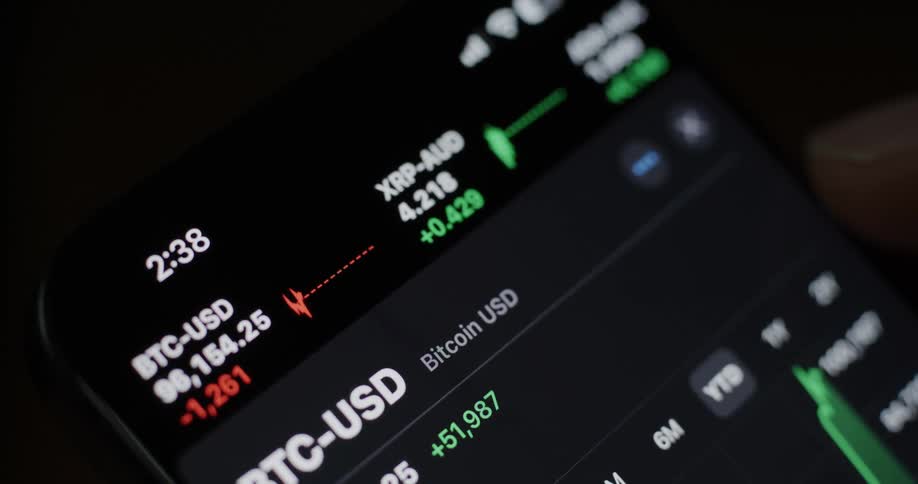
pov close up of smartphone screen while person is scrolling through stock market data
A stylus points at colorful fluctuating line graphs displayed on a digital screen suggesting data analysis or market tracking
A bullish candlestick chart pattern moves on the computer monitor with visible pixels as the bull flag breaks resistance to the upside causing massive surge and gain for investors and traders trading stocks and crypto currency coins or tokens online
A person scrolling on a smartphone
A binary options chart showing rising and falling movements
A woman looking at graphs and numbers on a laptop screen
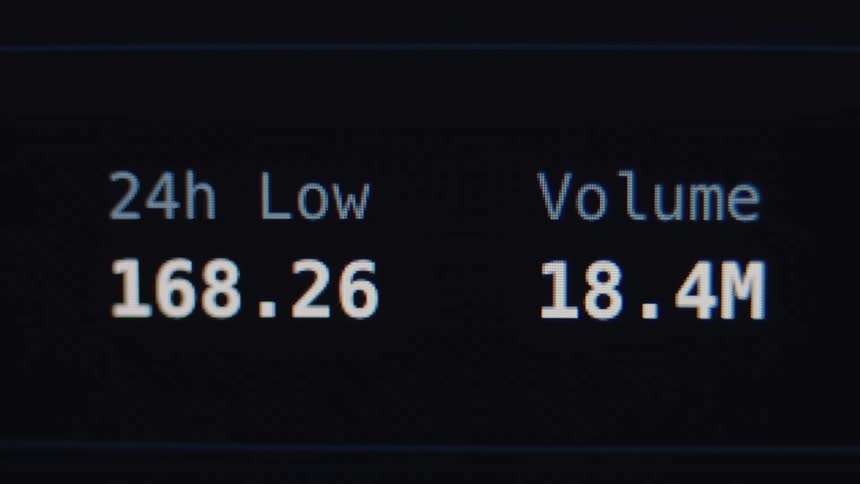
Close up of a financial trading screen displaying the 24-hour low and volume data for a stock or cryptocurrency
Over the shoulder shot of two people analyzing a fluctuating stock market or cryptocurrency chart on a laptop screen
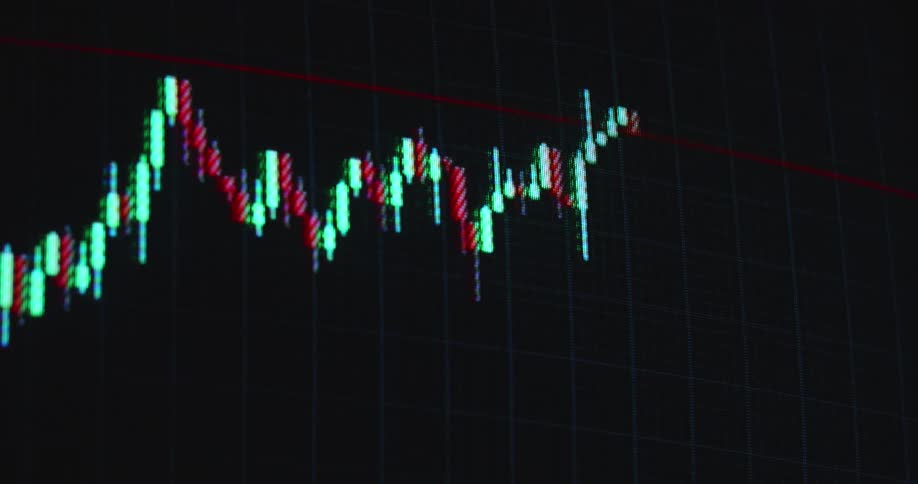
Financial market candlestick chart against a dark background
Fingers touching a touchscreen displaying a stock market graph with red and green bars
Stock related data is scrolled over on a screen
A close-up of a digital stock market chart on a screen displaying real-time, fluctuating share prices
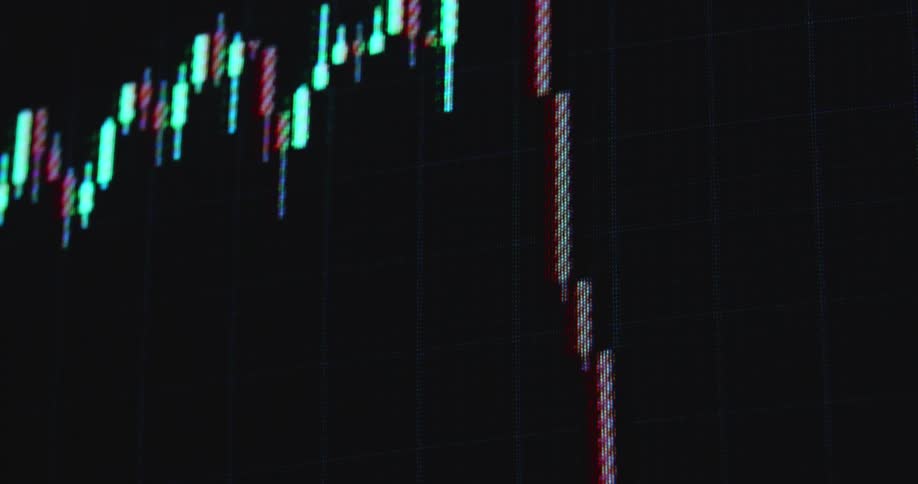
Handheld macro shot with dynamic camera movement of stock or crypto currency trading candlestick chart going up before crashing due to unexpected black swan event causing recession and economic depression on screen with grid and red candles
The financial markets get hit by a black swan event causing a massive crash or recession leading to a global economic crisis and great depression symbolized by a trading chart or graph that sharply falls into the red digits with dramatic downward movement
Dynamic dramatic macro footage with shaky movement of a stock trading chart or data graph animation moving upwards with a positive trend line indicating a stock market or crypto bull run and the increase in value of different assets
Person scrolls data and graphs on smartphone screen
The screen is full of line graphs
Grid and white lines displayed on a screen with blur effect
The view is of someone scrolling through there phone in the day time
A dark video shows blue green and red stock market line graphs on a computer screen against a grid
An abstract, out-of-focus close-up of a live cryptocurrency or stock market candlestick chart with flickering red and green bars on a dark screen
Closeup of an iphone screen displaying stock market data
A person is pressing the tablet
A person drags their finger across the graph on the phone
Closeup of a screen displaying a financial market graph
A man analyzes stock market charts on a computer screen in a dimly lit room
The financial markets are crashing due to a recession making stocks and shares drop and go down in price with decreasing value symbolized by a falling candlestick chart with red candles on a RGB pixel screen with black background
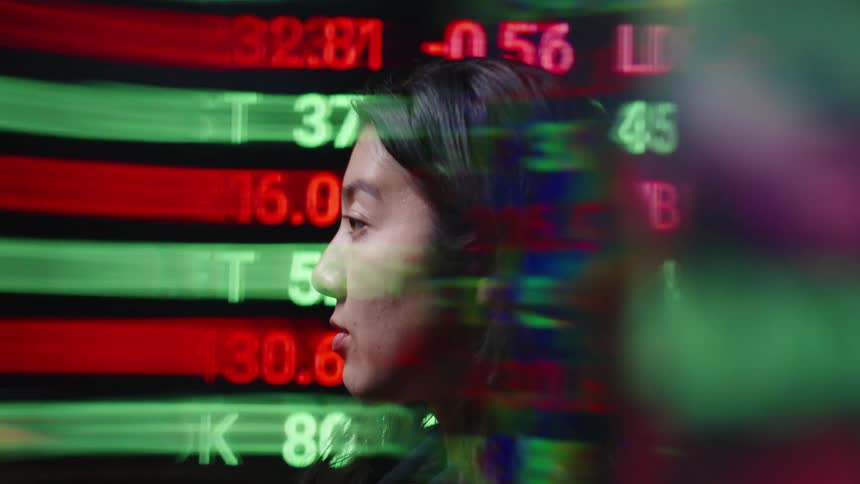
Human profile overlaid with market data in red and green
An over-the-shoulder shot captures a financial trader analyzing real-time stock market charts on a laptop
A line drawing trading candles on a monitor either red or green depending on the trade before breaking resistance to the upside while the stock or crypto currency goes on price discovery making a new All-Time High or ATH with upward trend
The line chart on the computer has different shades of color
Finger pressing the buy button on a cell phone
A large computer monitor shows a graph with zigzag lines and numbers
A close up of a cell phone screen with a graph displayed and numbers

Need help finding the
right footage?

Have it delivered to your account within 1 business day.
This is Filmsupply

Our StoryOur FilmmakersArticlesFilmsPopular SearchesAll Categories

FM

A family of brands dedicated to empowering the creative.

FILMSUPPLY

Footage licensing for productions

MUSICBED

Music licensing for filmmakers

STILLS

Image licensing for creatives

© 2026 FM LLC.

Privacy PolicyLicense TermsTerms & ConditionsCareers