Musicbed
Filmsupply
Stills
Contact Us(800) 805-6802
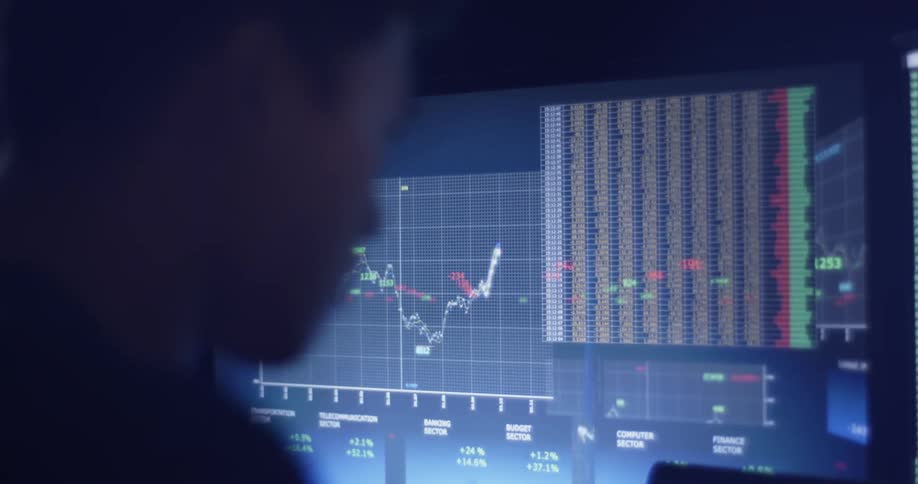
Graphs and stock prices are on the computer screen
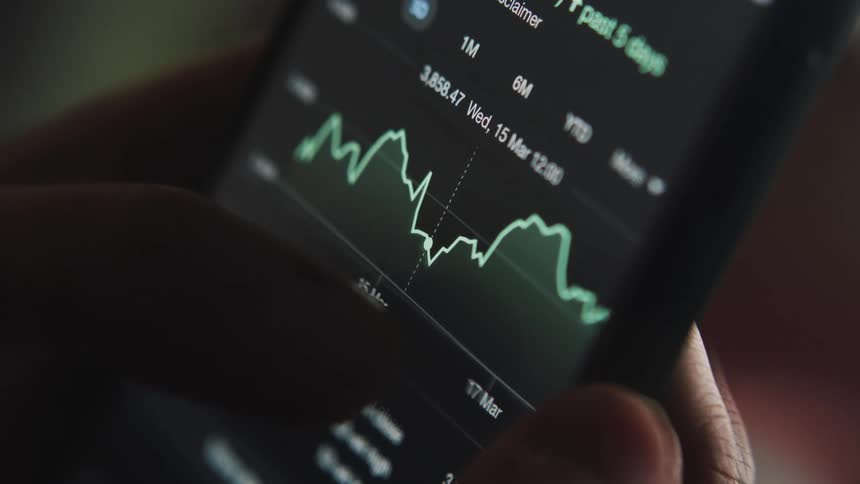
Close-up of a person's hand scrolling through a stock market trading app on a smartphone, analyzing financial charts and data
A person is browsing on their electronical device
Computer program creates a red line graph on a PC monitor going up and down and falling after being rejected by the trend line as a symbol for financial meltdown and losing money in the stock and crypto investment market
A man creates a graph on his laptop
A stock market candlestick chart projected with a golden light on a display screen
Macro close up of laptop screen showing bullish candlestick pattern or financial market chart as Bull Flag breaks resistance to the upside creating massive gains and profits for successful traders and brokers using online service platform or application
Vibrant blue and orange neon lines move across a dark digital screen with a grid pattern and soft light leaks creating a modern and tech focused background
A digital investment graph trend line shifting between going up and down as a stock trading market prognosis or index of the finance sector affected by the global economy in the darkness on black flickering retro computer screen
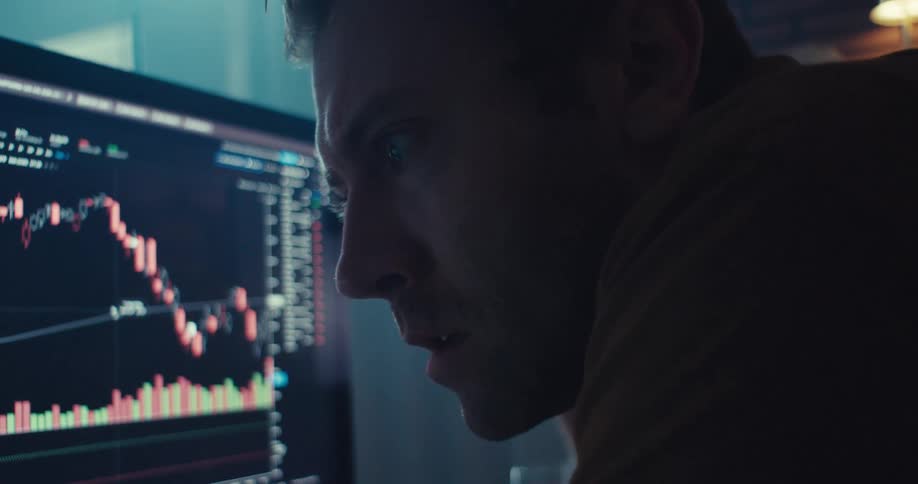
A man watches the stock market chart on a monitor and computer screen with serious focus
A man and woman collaborate while analyzing financial market trends on a laptop computer
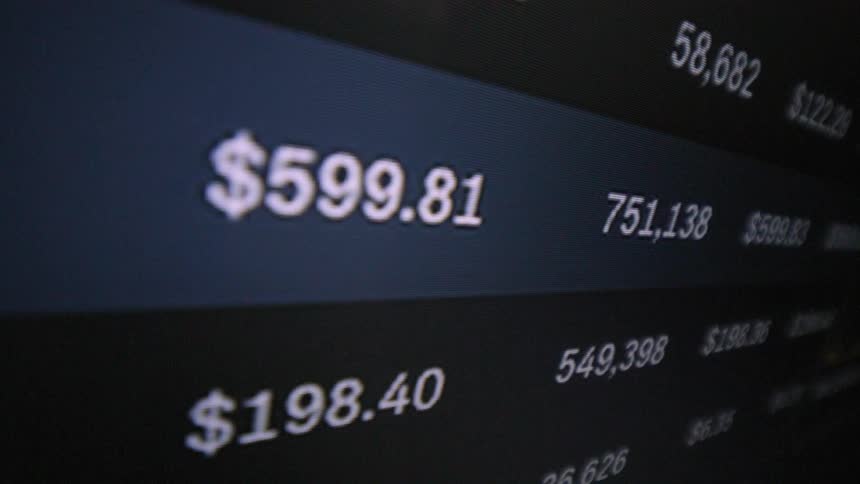
A close-up macro shot of a digital display shows financial figures rapidly increasing into the millions of dollars
Several wet golden coins with the bitcoin logo printed on them
Close-up of a digital analytics dashboard showing a rapidly fluctuating counter for web traffic requests on a dark screen
A close up of numbers and text on a scren
A person that is looking at graphs on a computer
The view is of someone using there phone in the day time
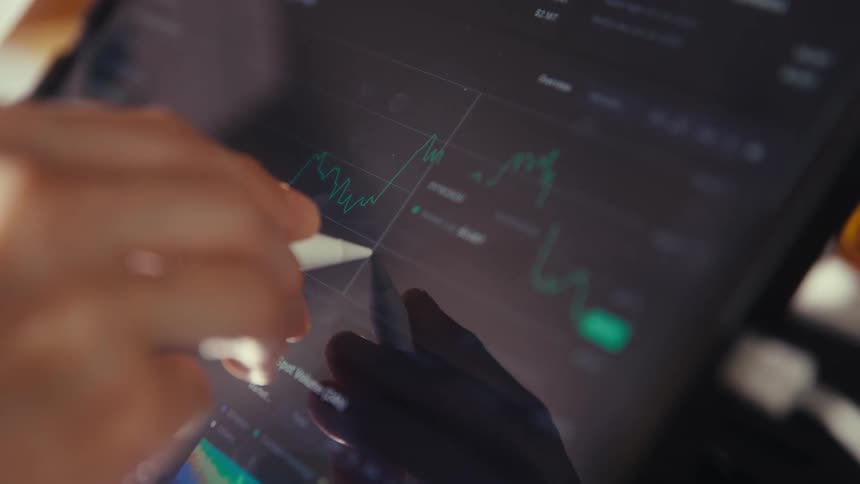
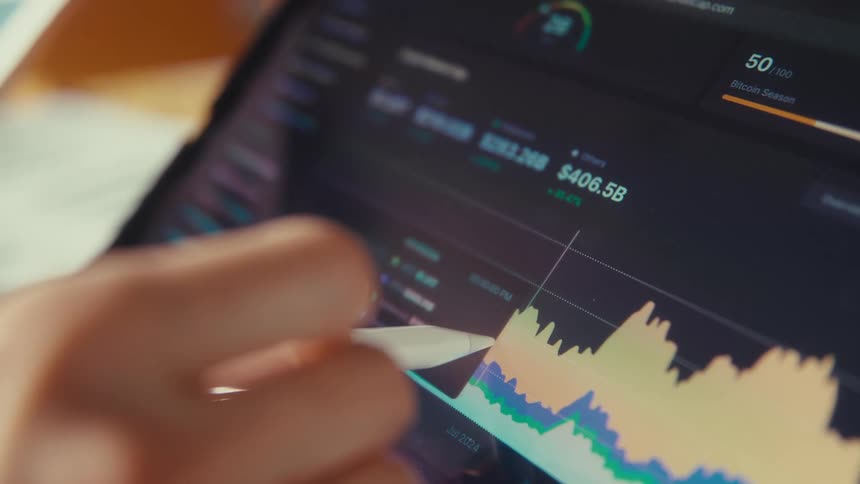
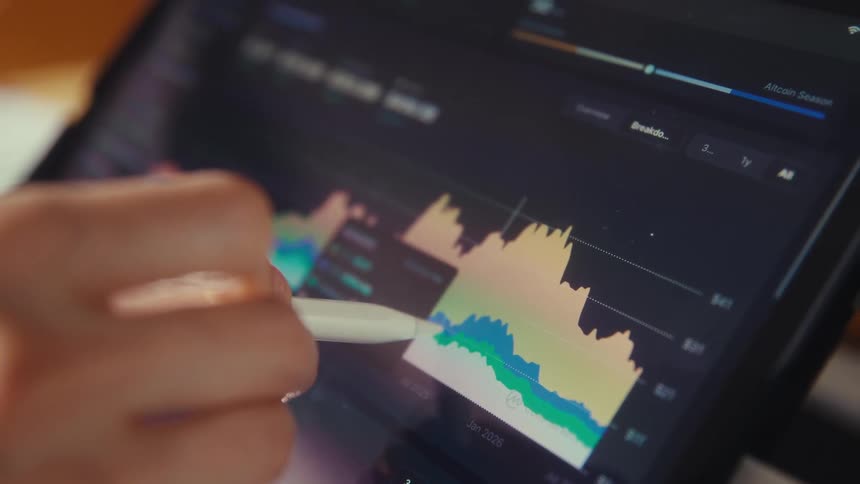
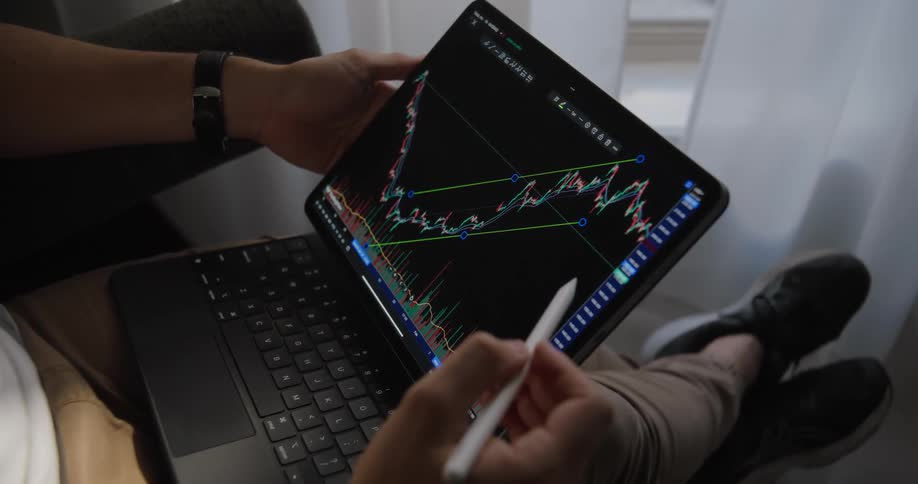
A close-up view of a person's hand using a stylus to analyze fluctuating financial market charts on a tablet screen
A real-time digital trading chart fluctuates on a screen, with the line graph indicating financial gains and losses
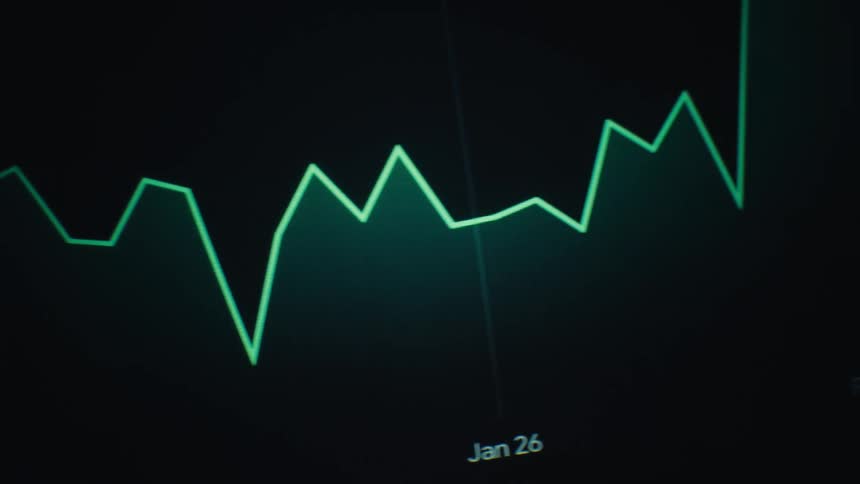
The primary visual is a dynamic jagged trend line that changes color and style throughout the clips in the initial shots it appears as a sharp white line tracing rapid price fluctuations later it shifts to a vibrant green glowing line that follows
Candlestick chart against a gray background
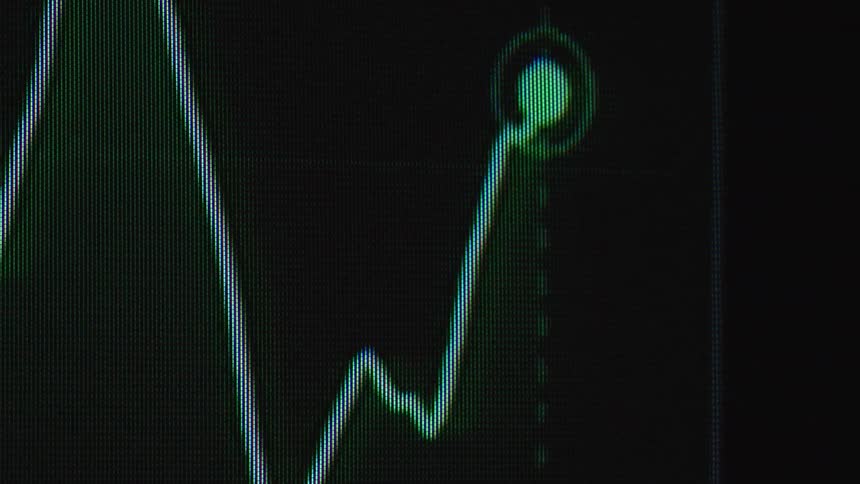
A macro close-up of a digital screen shows an animated financial chart with a positive upward trend
A close-up of a person using a stylus to analyze a fluctuating financial market chart on a digital tablet
A neon green retro monitor displays a chart showing the movement of a stock price with an arrow crashing with a dramatic downward or negative tendency or direction causing investors to lose money presented by data visualization
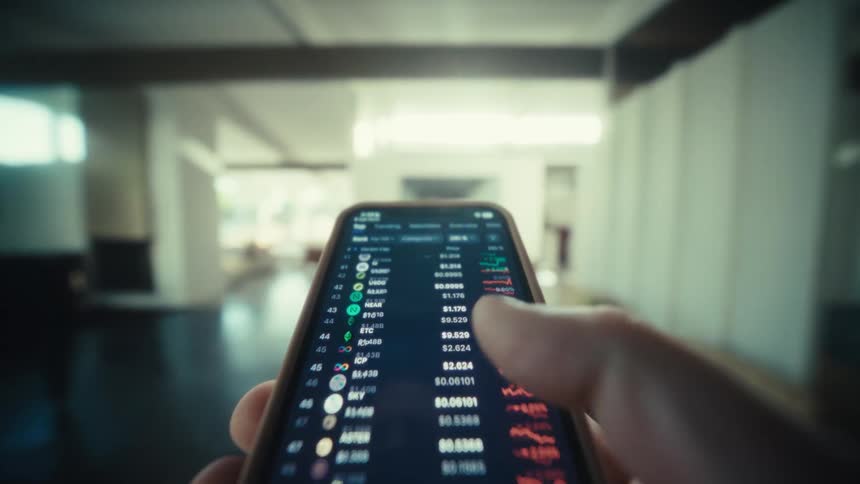
A person uses their thumb to scroll a list of stocks on a smartphone while sitting at a table
Stacked gold bitcoins are on a mirror and a single bitcoin is tilted in front of the stacks
Man scrolls stock information on a smartphone that reflects his face
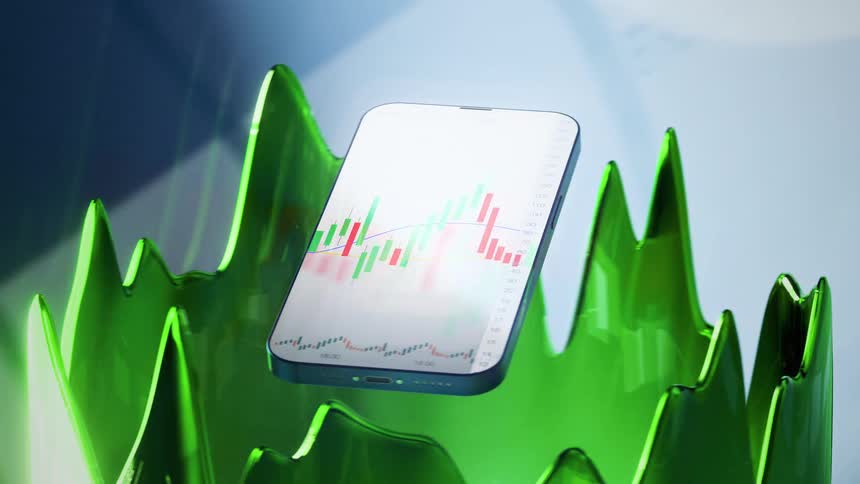
A floating phone with a graph on its screen
A financial chart on a screen shows a sharp daily drop highlighting market volatility and loss
Blue lines crisscross along a screen
A man in a recording studio works on a sound board
Finger touches a smartphone screen displaying a line financial chart on a dark interface
Two workers looking at a screen
Computer screen shows financial candlestick trading chart consisting of glowing neon green and red candles with wicks as prices goes up with positive trend and little volatility while the stock asset or ETF increases in value over time as good investment
A close up of numbers and letters
The video features a closeup cinematic shot of a digital stock market ticker displaying fluctuating financial data green and red numbers scroll across the screen highlighting various stock symbols and their realtime price changes
Dynamic handheld close-up of animated trend line graph moving up and down from positive to negative price performance on a dark pixelated screen with green grid in the background
Closeup of hands typing on a laptop with a stock market screen visible
A financial analyst uses a stylus to trace a rising cryptocurrency chart on a laptop screen in a slow-motion close-up
A black screen with a trading chart with green and red lines going up and down
Dramatic macro close up with shaky camera movement of a screen showing animated financial trading chart or business statistic with negative outlook prediction or development in neon green retro colors
Numbers and graphs are displayed on a computer screen
A close up of numbers on a screen
Financial market candle chart against a gray screen
The video features a blurry fastmoving display of stock market tickers and financial data shown in red and greenfamiliar company symbols like aapl and msft flicker across the screen alongside fluctuating numbers and percentage changes
An abstract, out-of-focus digital stock market ticker scrolls rapidly, showing fluctuating financial data in red and green
A soft-focus close-up of a digital stock market board shows fluctuating red and green numbers, symbolizing market volatility and trading
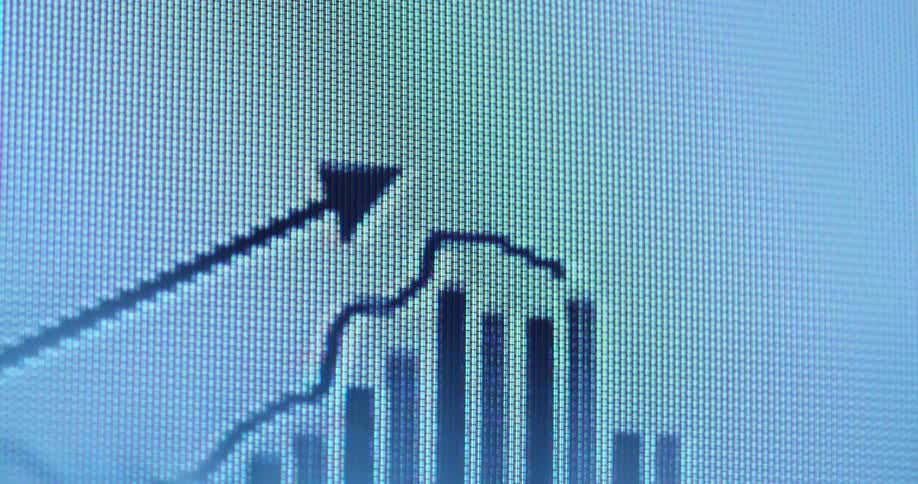
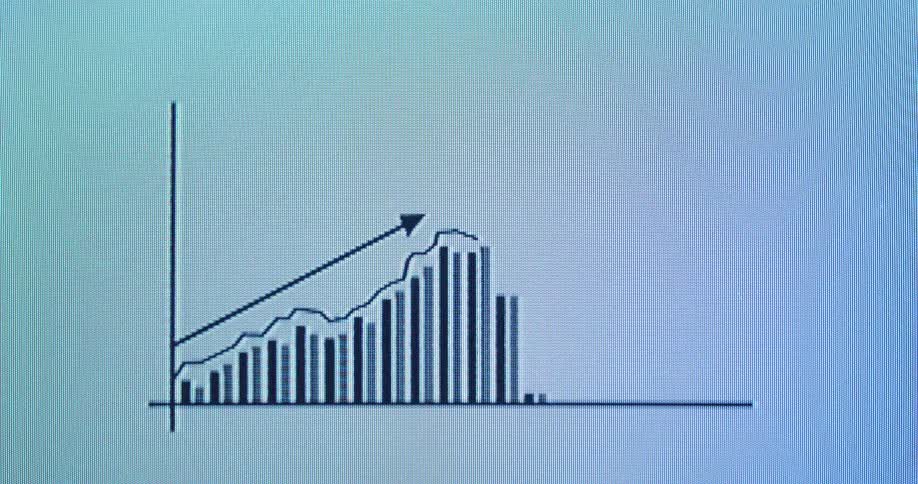
A macro shot of a blue bar graph on a computer screen with a white arrow indicating an upward trend of growth and success
A view of a screen with graphs and numbers on it
Person wearing glasses looks at a lit screen with colorful charts
Red falling financial market chart
Shaky handheld dynamic closeup of a neon red stock graph line falling and going down causing stress and panic sales due to downward portfolio tendency caused by wrong decisions and bad investment mistakes on old pixelated computer screen
Macro close-up view of a digital screen shows an animated graph with a rising line chart and an upward pointing arrow overlaying vertical bar charts representing market growth or financial success on a white computer screen background
Closeup of a monitor displaying financial data
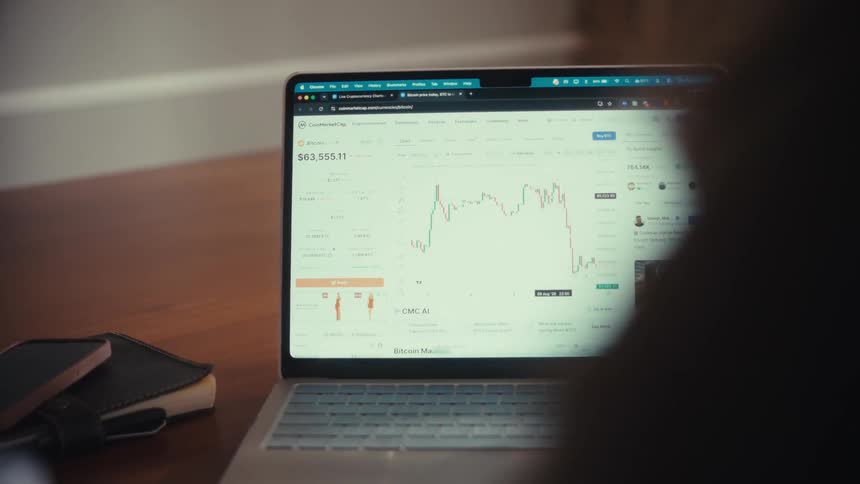
A man is sitting at a desk using a laptop computer with a graph on the screen
Close up of a device screen displaying an interactive trading interface in red on a dark background
Close-up of a trader's hand using a stylus to analyze a cryptocurrency price chart on a tablet's screen
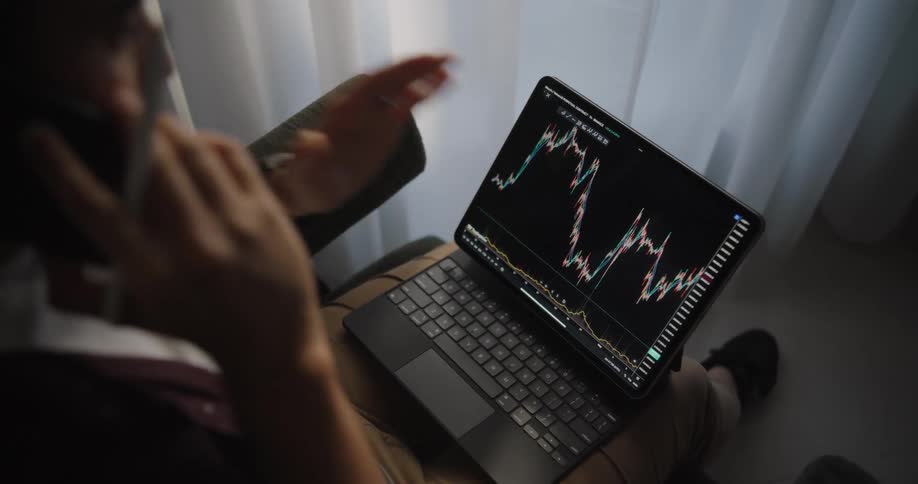
A man is sitting in a chair with a computer in his lap as he talks on the phone and moves his hand near the screen
A man is using a stylus on his tablet
A man looks up a chart on his smart phone and jots down notes
List of dollar amounts scroll on device display
Pixelated bar animation or sales chart with an upward line represents continuous growth over time as the value increases during financial data presentation due to positive development or great business performance with economic success
The person runs the stylus over the tablet

Need help finding the
right footage?

Have it delivered to your account within 1 business day.

This is Filmsupply

Our StoryOur FilmmakersArticlesFilmsPopular SearchesAll Categories

FM

A family of brands dedicated to empowering the creative.

FILMSUPPLY

Footage licensing for productions

MUSICBED

Music licensing for filmmakers

STILLS

Image licensing for creatives

© 2026 FM LLC.

Privacy PolicyLicense TermsTerms & ConditionsCareers