Musicbed
Filmsupply
Stills
Contact Us(800) 805-6802
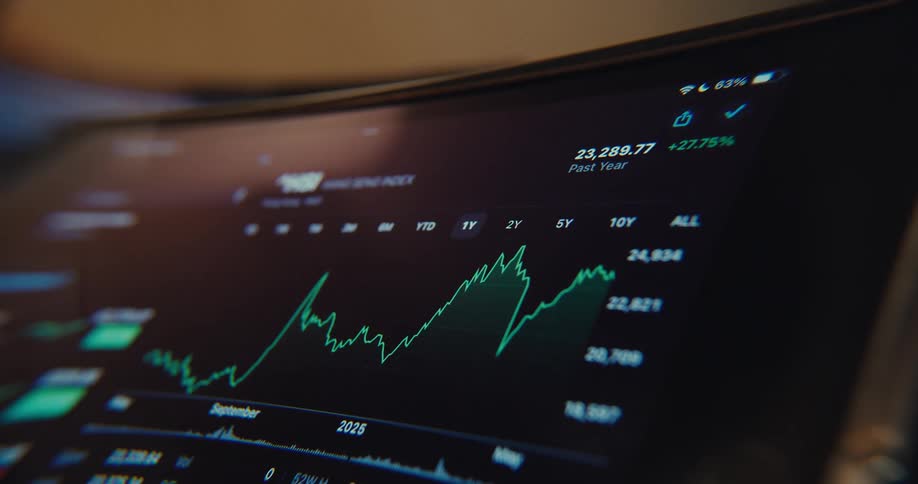
Close up of a blurry device screen displaying a trading interface in green over a dark background
Some lines of a trading chart with green and red lines and the green line is going up
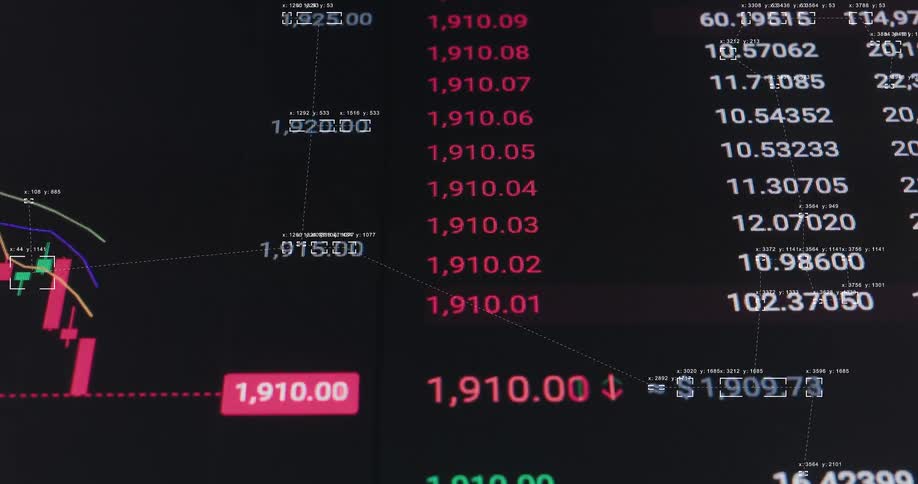
Screen showing numbers scrolling and switching between red and green due to the stock market
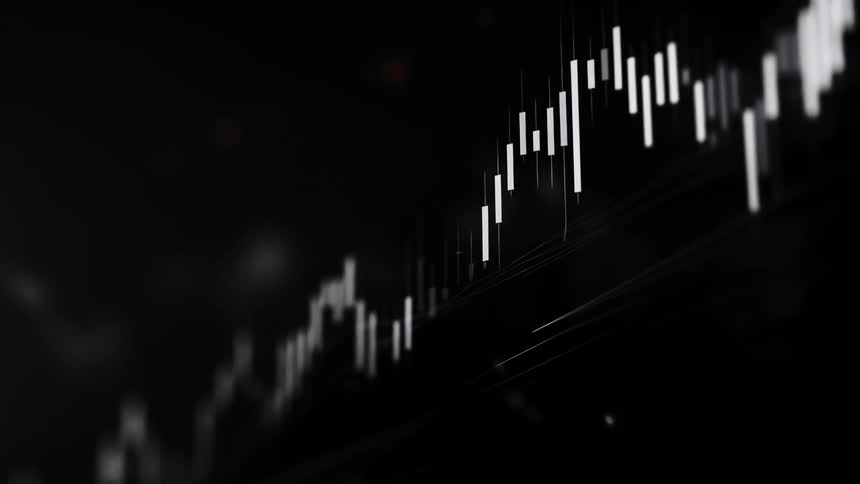
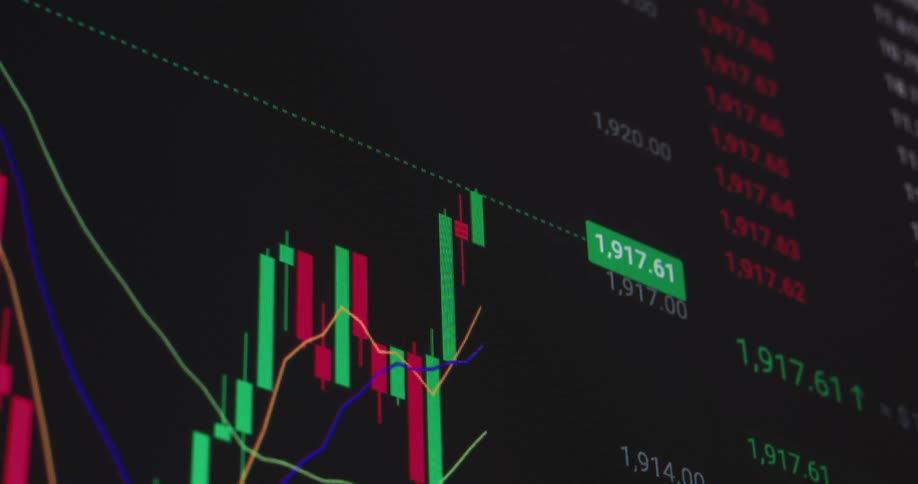
Close-up of a real-time digital stock market candlestick chart showing a bullish upward trend on a computer screen
An abstract, out-of-focus animation of a digital stock market chart shows fluctuating data and glowing trend lines
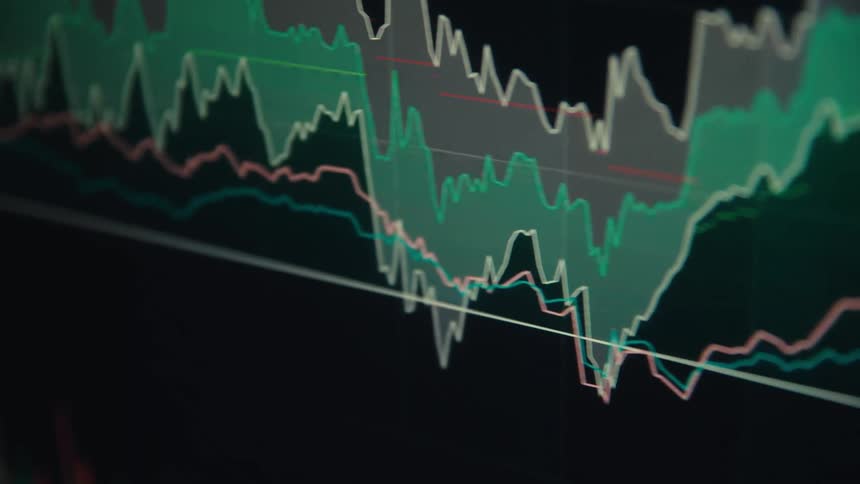
Multi line plot and a candlestick chart share a computer screen
Macro close up of a red arrow that moves up across a pixelated screen as a financial trading graph is building beneath it symbolizing economic growth or rising stock prices or crypto currency trading as successful investment
A blurry close-up of a green stock market chart on a digital screen showing fluctuating data and an upward trend
Closeup of a screen displaying a stock market chart
A computer monitor displays a stock market candlestick price chart
Overlapping line and candlestick charts display intense financial fluctuations
A close-up view of a digital candlestick stock market chart displaying fluctuating price data and market volatility
Green line displays digital information against a black background
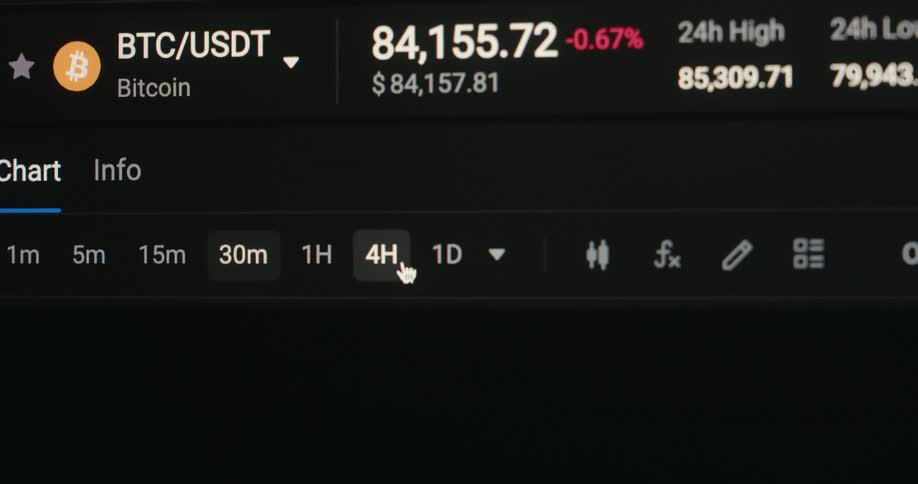
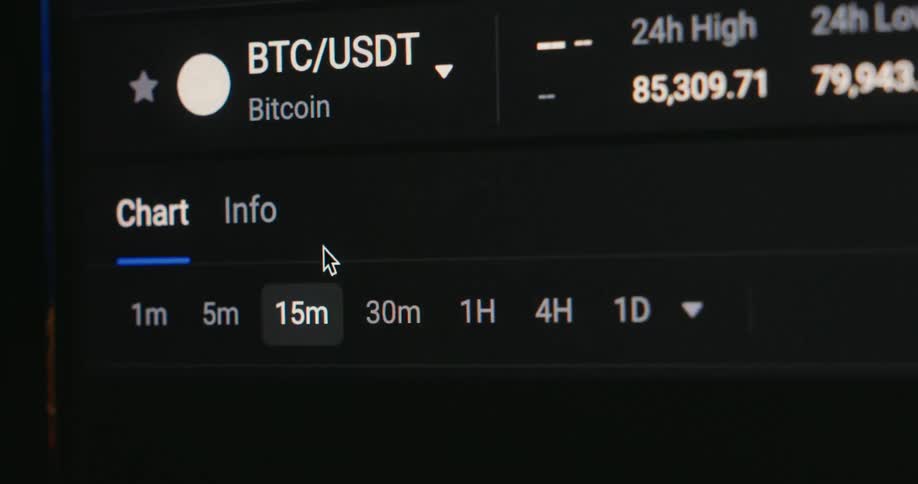
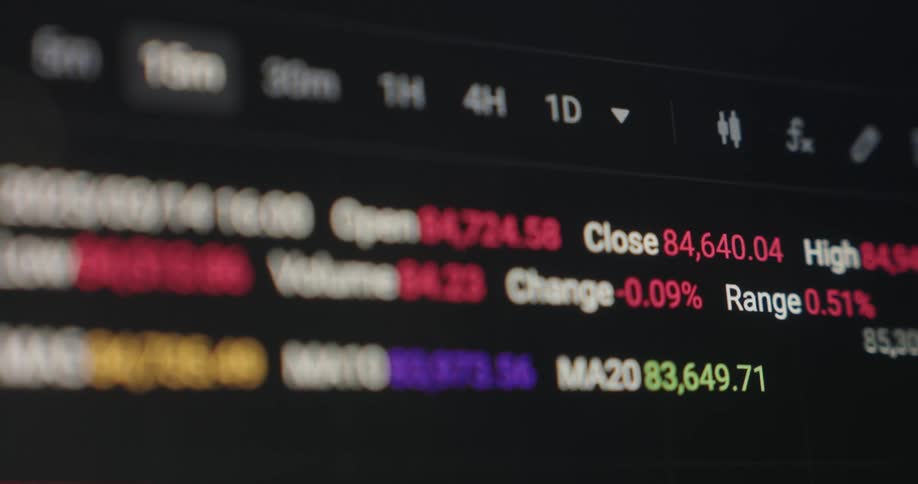
A cryptocurrency app screen transitions between trading views showing btcusdt market data chart intervals and detailed price movement stats
A blurred, close-up, and stylized animation of a digital stock market chart with glowing lines and fluctuating data
Price variation chart with green and red lines showing financial values
The neon green graph forms an old 90s computer screen showing a vintage user interface of a stock trading platform or exchange as the commodity and equity prices crash and a global recession hits the finance markets
Scrolling on a chart showing the fluctuation in a stocks price
A blurry, abstract close-up of a green stock market chart on a digital screen, with graphs and data showing upward trends and growth
The screen is full of line graphs
Blue and orange financial chart lines displayed on a digital screen
A closeup shot of a screen displaying fluctuating stock market graphs and numerical data
The numbers on the monitor change frequently
A finger scrolling on aglowing market chart on a screenthat shows fluctuating prices with sharp dips and recoveries
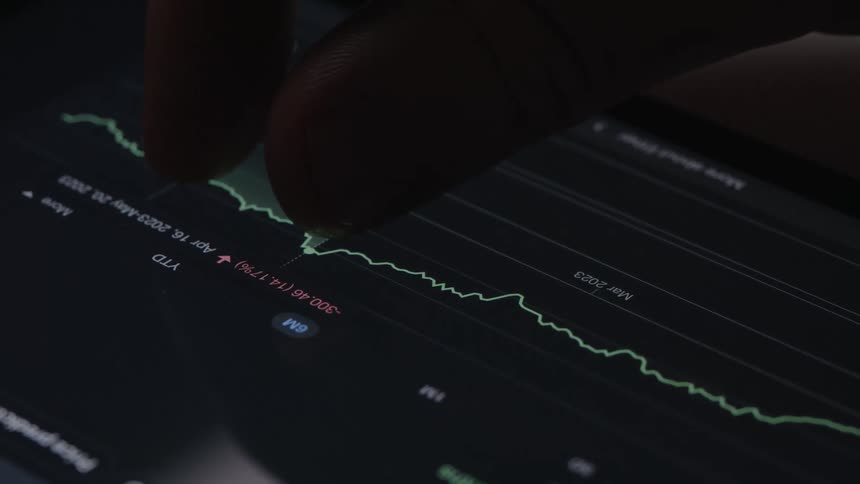
Person uses a finger to follow the plot of stock data on a device screen
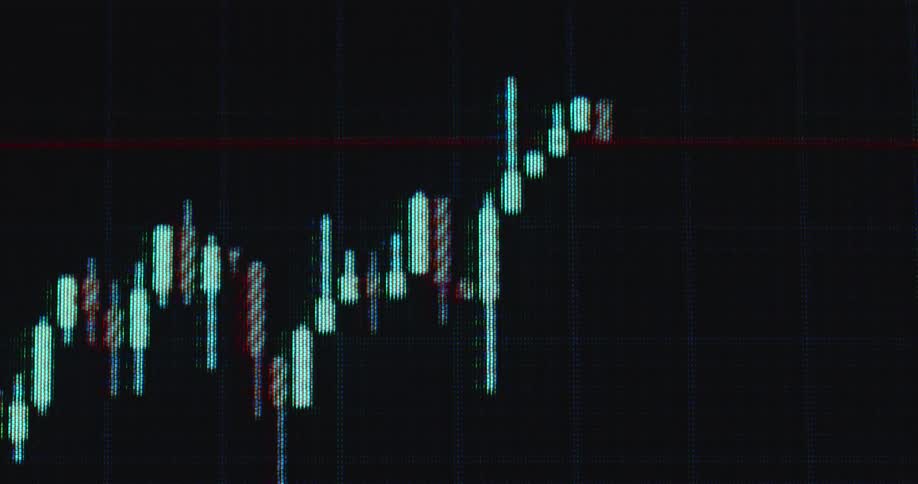
Financial candlestick chart on a screen indoors
Dramatic upward perspective of Bull Flag chart pattern as the green candles break resistance to the upside and the stock or crypto currency goes on price discovery with positive upward movement and trend displayed on monitor of a professional broker
A stylized 3d animation shows a glowing candlestick stock chart with a strong upward trend on a futuristic digital interface
A digital screen shows a volatile stock market or cryptocurrency candlestick chart with a line graph fluctuating up and down
The bar graph goes up and down across the entire computer screen
Closeup of a computer screen displaying realtime stock market charts and financial data
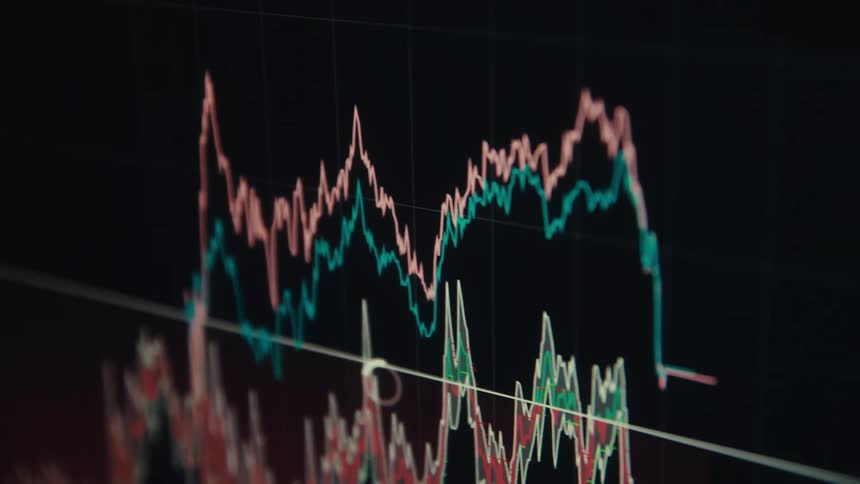
A financial trading graph with colorful lines displaying market trends
A futuristic animated stock market or cryptocurrency trading chart displays real-time fluctuating values and data analysis
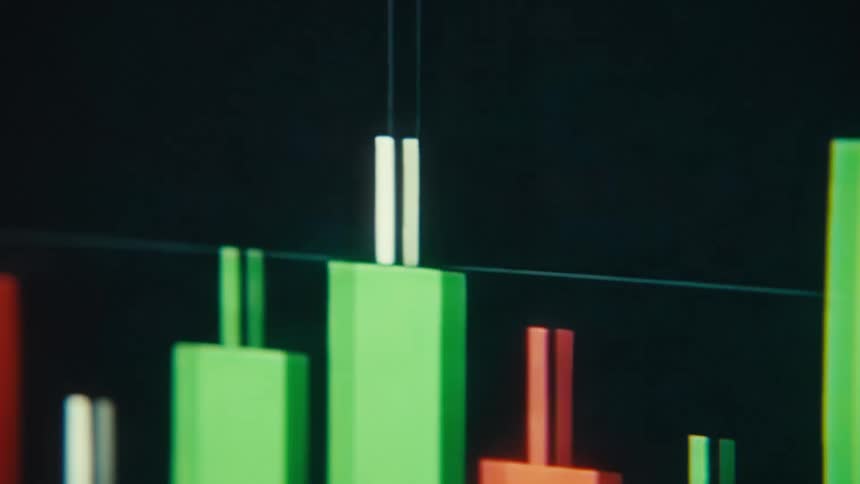
Green rectangles form a plot against a black background on a digital screen
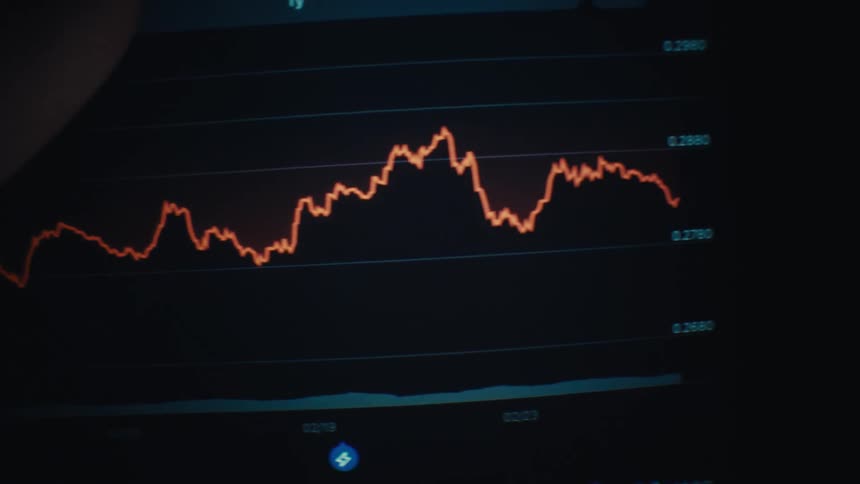
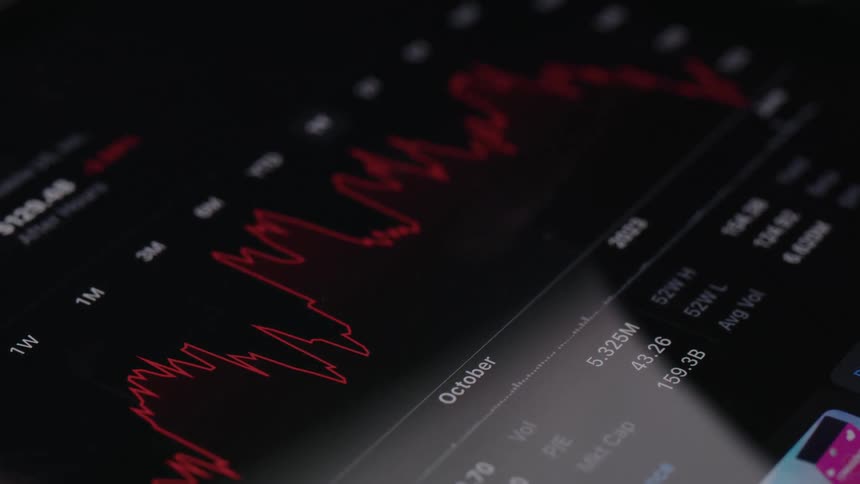
A close up view of a computer screen displays fluctuating orange and red line graphs against a dark background
A digital display shows multiple lines of data graphing price fluctuations over time
A vintage-style animation of a red bar graph on a black screen shows a positive upward trend
A person uses their tablet to check stocks
A closeup shot shows a digital screen displaying a financial graph with multiple colored lines representing different market trends the camera pans slowly from right to left revealing the volatile jagged movements of the lines as they shift up and dow
Close up of an electronic screen displaying a trading interface in white and black
A screen shows a financial chart with lines and bars moving up and down
Person scrolls through stock information on a tablet
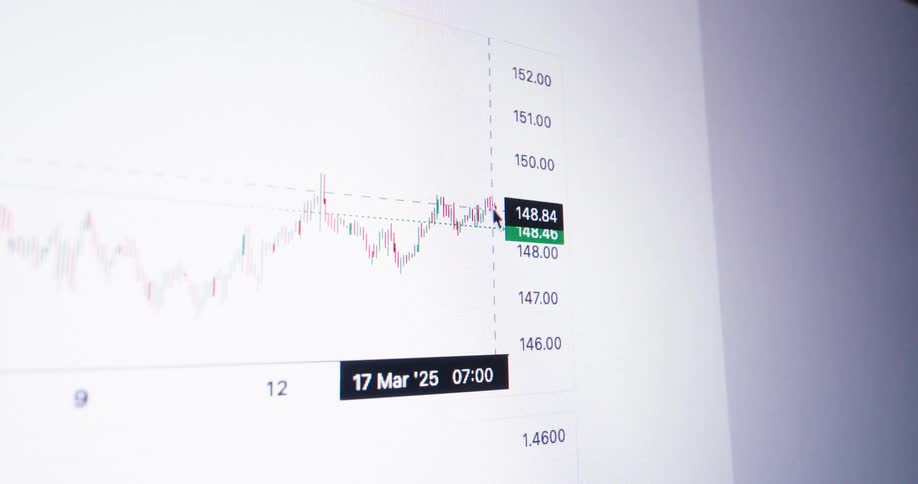
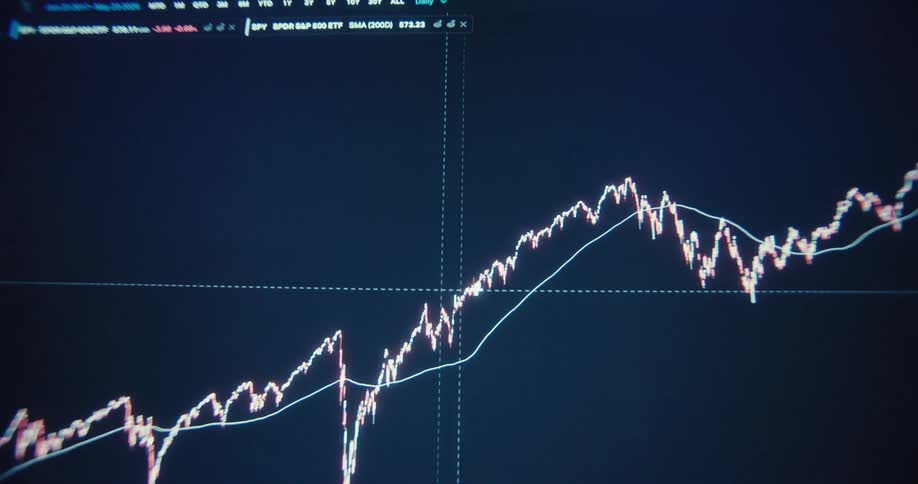
Graph of the price of a currency
Screen showing the value of bitcoins
A footage of a trading chart screen
The primary visual is a dynamic jagged trend line that changes color and style throughout the clips in the initial shots it appears as a sharp white line tracing rapid price fluctuations later it shifts to a vibrant green glowing line that follows
Digital pixelated graph with positive trendline going up showing growth and financial strength of the global or US economy or an economical upward trend while making progress and profiting from business opportunities
A close up view of financial data charts and graphs displayed on a screen with light distortions
A buy button is on the cryptocurrency screen
A close view shows blurry digital graphs and stock market data with red and green bars moving quickly across a dark screen
Informational graphs cover the computer screen
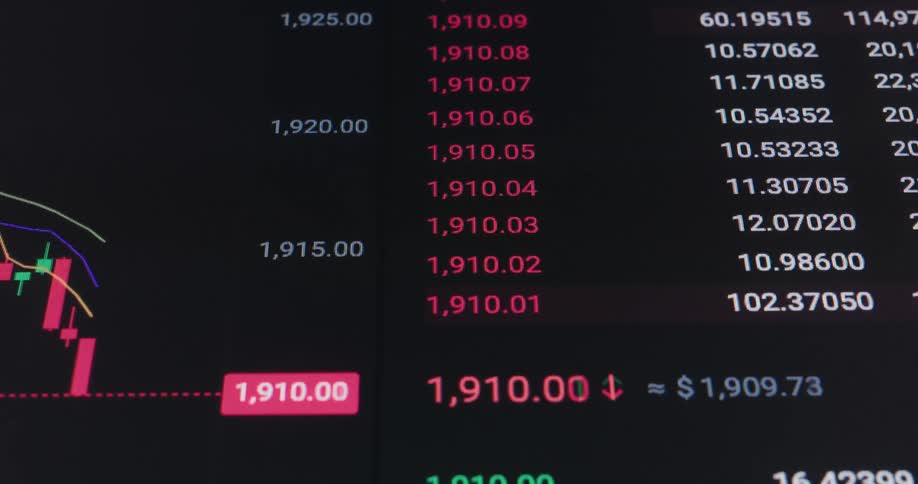
Close up of a screen displaying a trading interface with candlesticks and other trading indicators
Numbers grow on the graph displayed
Price variation chart with a red line followed by a green line over time
Blue colors the area under the line in a graph contrasting with the black background on a computer screen
A close up of numbers and charts on a screen
The animated trading graph or candlestick chart is moving on the computer display as a recession hits the global finance markets and the prices crash as red candles symbolize the end of a market cycle and the beginning of a financial crisis or depression
Red and blue candle chart
People walk by the line graph on the monitor
Tall green candlestick bars with thin white wicks rise against a dark background their sharp tops and bottoms hinting at sudden bullish spikes and shortterm volatility
Person touching a tablet screen with their fingers to check stock prices
A closeup view of a stock market chart with red and green candlesticks fluctuating
A red and green line graph depicting a sharp decline is prominently displayed on a dark background suggesting a financial downturn and loss

Need help finding the
right footage?

Have it delivered to your account within 1 business day.

This is Filmsupply

Our StoryOur FilmmakersArticlesFilmsPopular SearchesAll Categories

FM

A family of brands dedicated to empowering the creative.

FILMSUPPLY

Footage licensing for productions

MUSICBED

Music licensing for filmmakers

STILLS

Image licensing for creatives

© 2026 FM LLC.
Privacy PolicyLicense TermsTerms & ConditionsCareers