Musicbed
Filmsupply
Stills
Contact Us(800) 805-6802
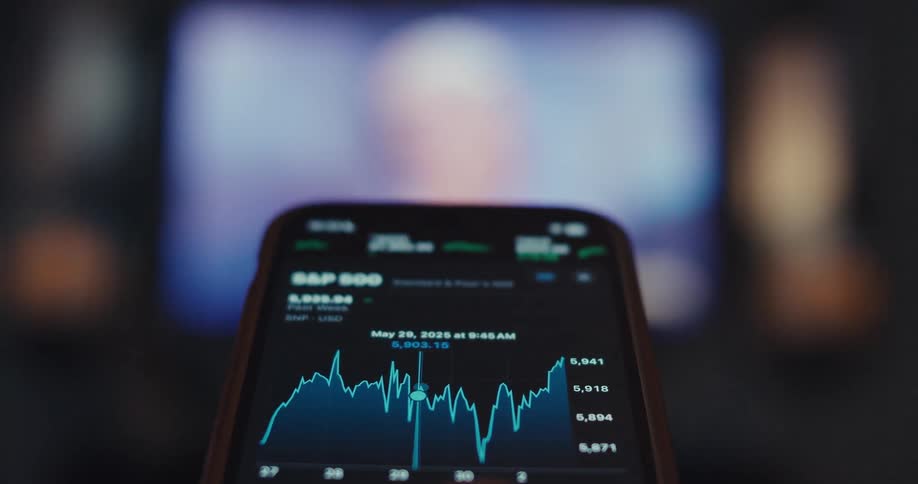
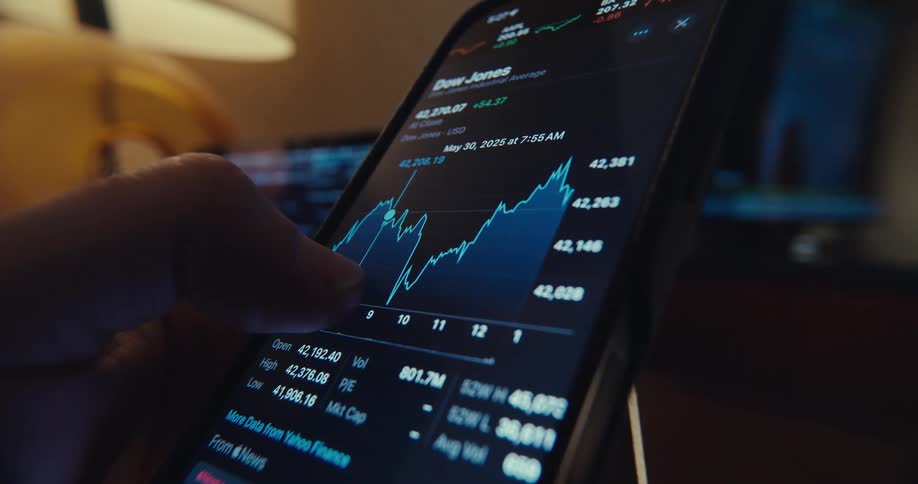
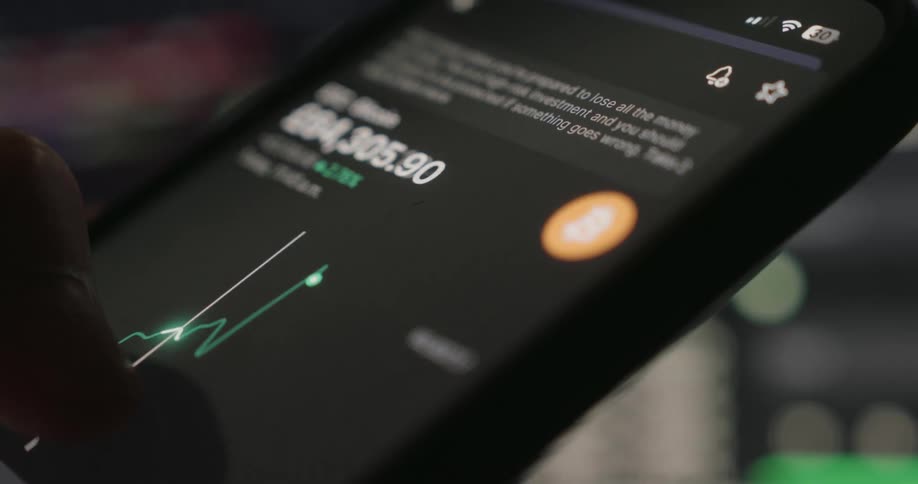
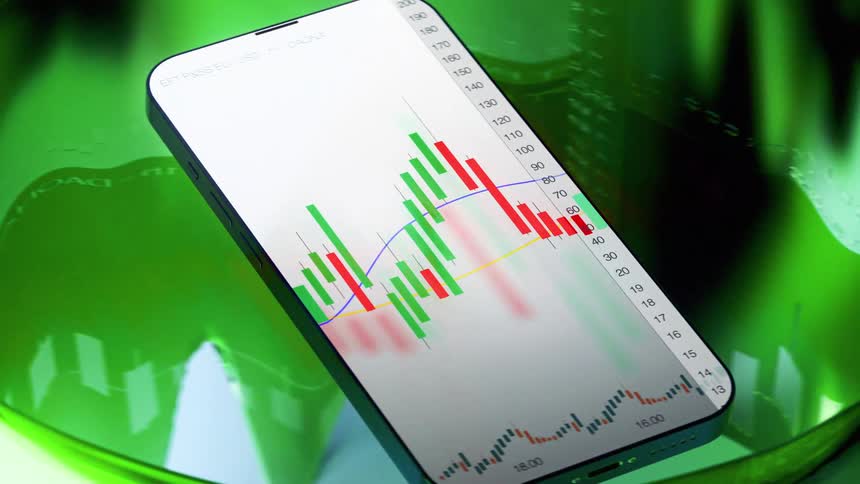
A smartphones screen
A red and green line graph depicting a sharp decline is prominently displayed on a dark background suggesting a financial downturn and loss
A screen with red and blue graphs
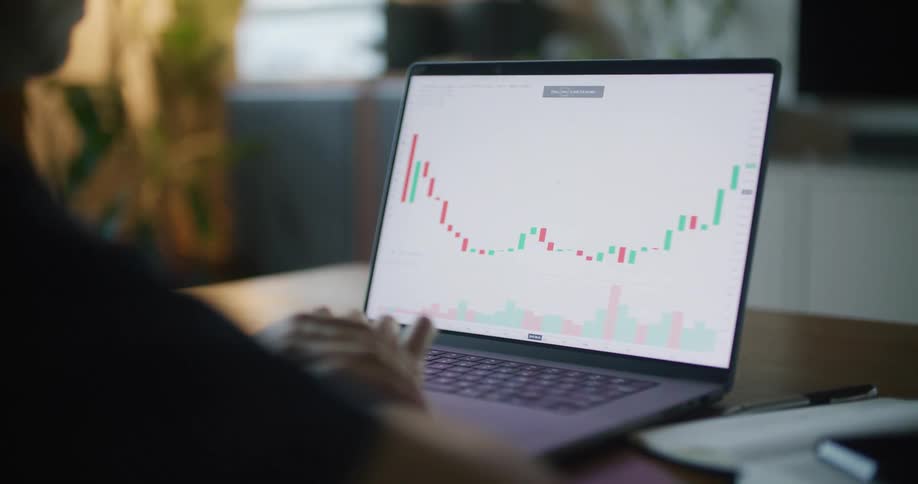
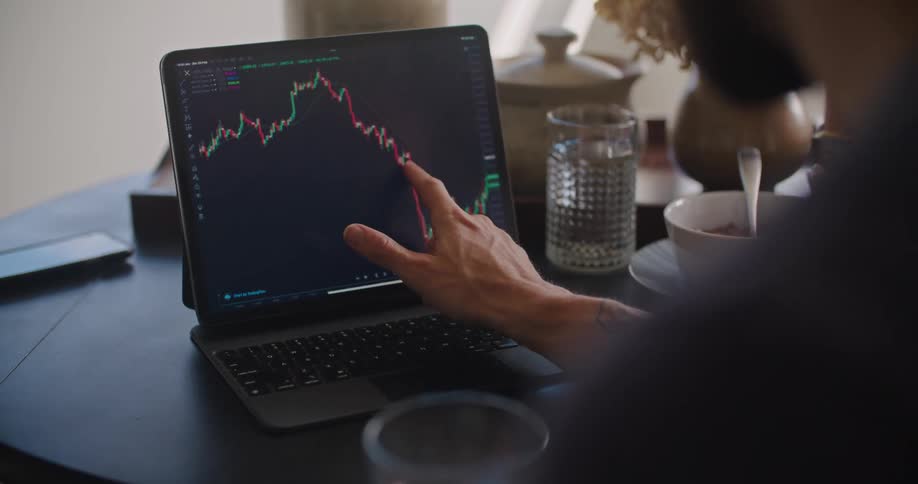
A man is sitting at a desk working on a laptop computer with a graph on the screen
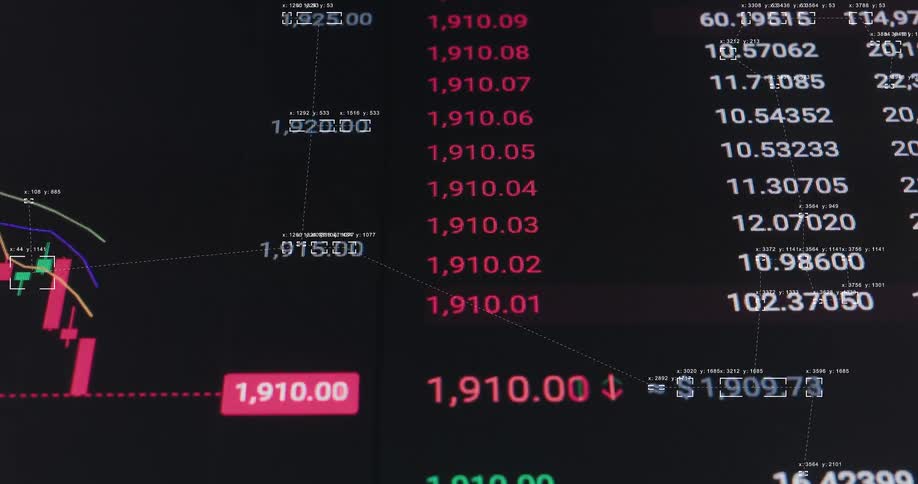
A close-up of a digital screen showing a real-time stock market chart with fluctuating numbers and candlestick patterns
A look at a screen of stock market prices
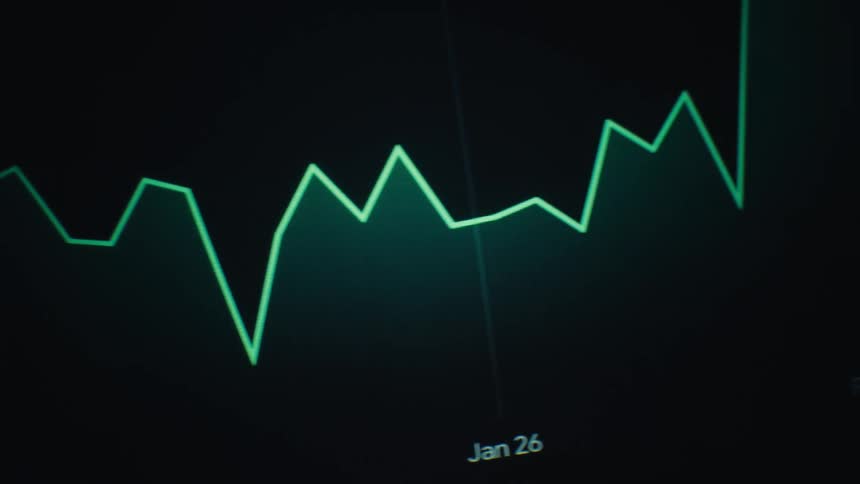
The line graph is moving on the screen
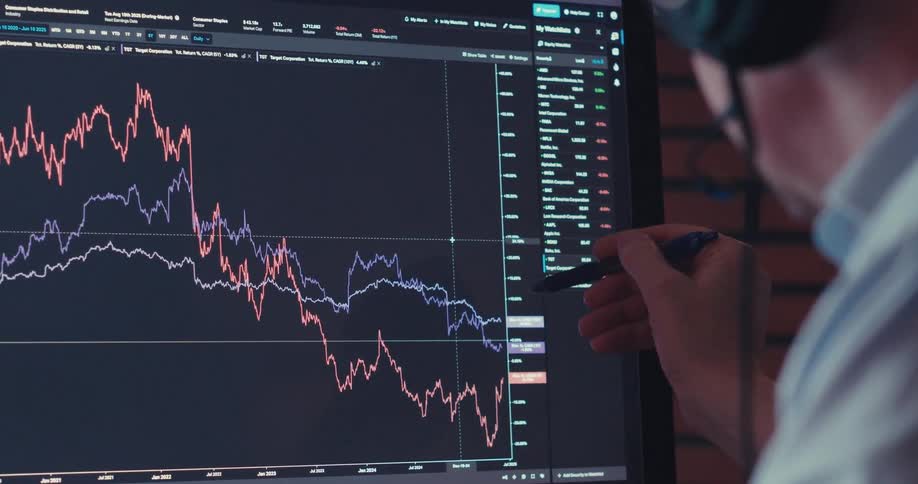
A stylus points at colorful fluctuating line graphs displayed on a digital screen suggesting data analysis or market tracking
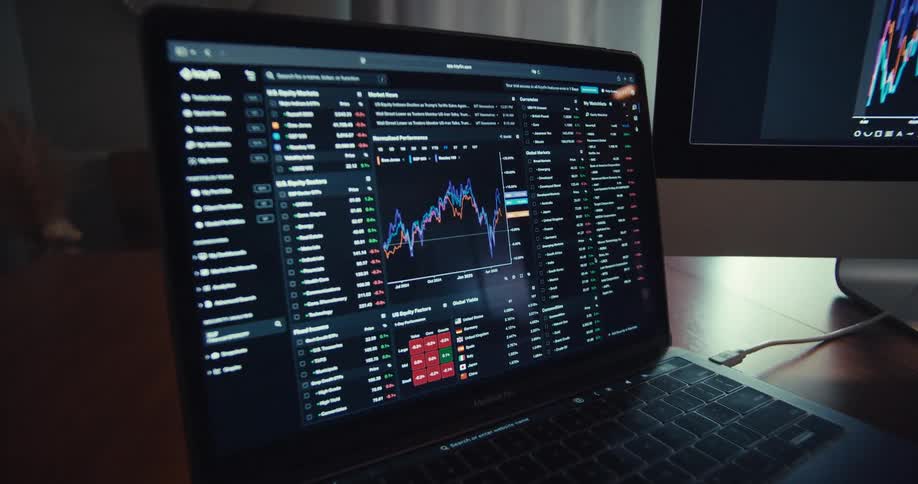
A man is sitting at a desk using a laptop computer with a graph on the screen
Numbers of different colors flash on the screen
An abstract, out-of-focus close-up of a digital candlestick stock market chart shows financial data fluctuating over time
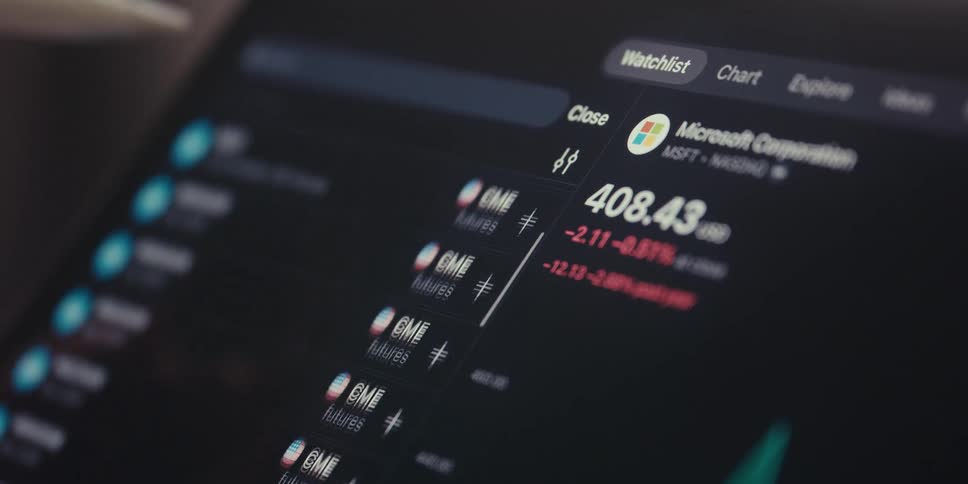
A digital stock trading interface displaying microsofts stock performance with a negative change along with a watchlist containing cme futures and a stylus interacting with the screen
Multiple plots in blue and red are scrolled over against a black background
Screen displaying a chart and transaction buttons for stocks
Financial information is displayed on a screen as it is scrolled
A computer screen displaying a stock price chart with green and red candlestick patterns
A person is scrolling through stock prices on their phone
A person puts their fingers on their cellphone screen
An extreme close-up of a digital display shows columns of rapidly changing financial or statistical data with visual glitches
A person is pressing the tablet
A stylus pen resting against a computer screen displaying a stock market chart with red and green lines
Stacks of money on fire on the floor in a dark room
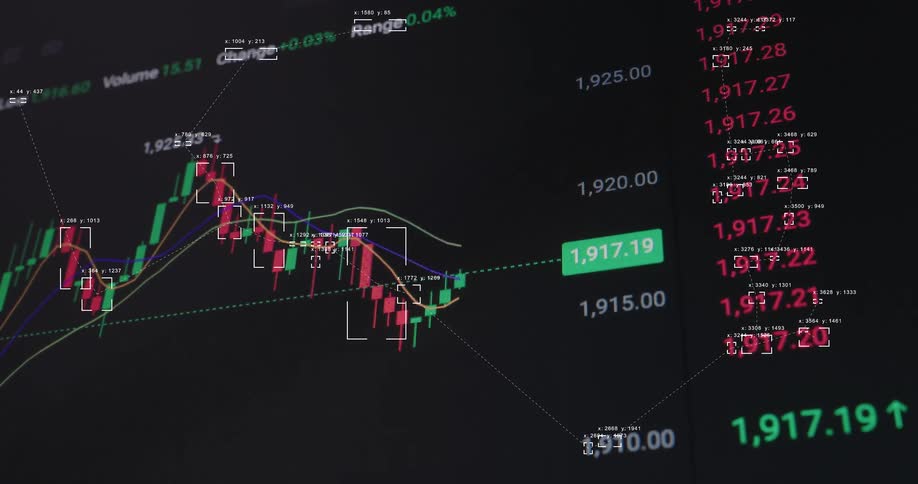
A futuristic animated stock market or cryptocurrency trading chart displays real-time fluctuating values and data analysis
A person drags their finger across the graph on the phone
A line graph is on the computer monitor
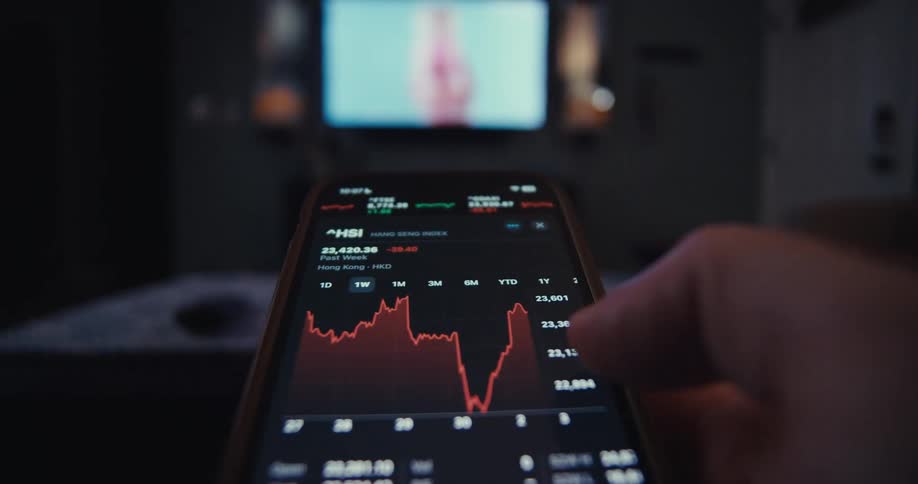
In a dimly lit room a finger scrolls through a fluctuating red stock market graph on a smartphone with a television glowing in the background
The line graph goes up and down on the monitor
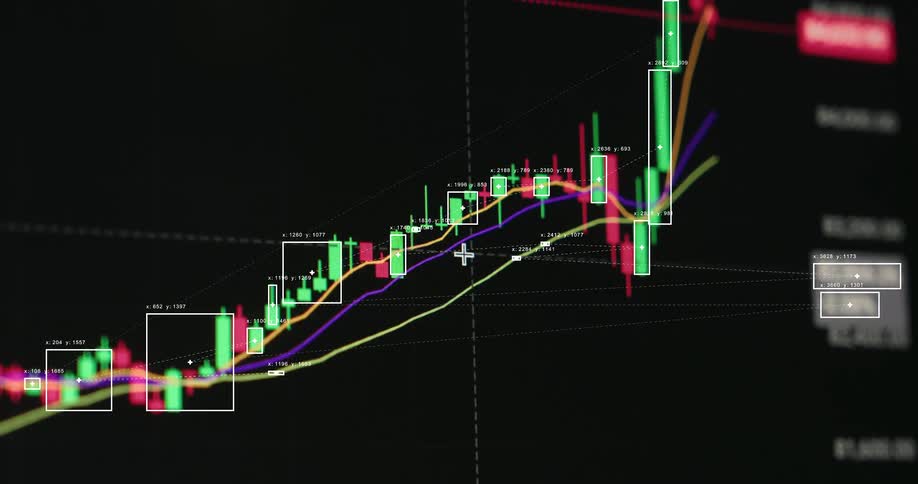
Digital candlestick chart displays rising financial market trends with animated technical analysis overlays
Red and green candlestick chart on a pixelated screen with RGB pixels as the bearish graph breaks resistance to the downside and the market or asset value collapses causing massive losses and volatility due to an unexpected crash
A financial graph with an upward trend arrow and bar chart rises on a digital screen, with smoke effects adding a mysterious atmosphere
The video features a stylized glowing bitcoin symbol prominently displayed on a circuit boardlike background with digital connections radiating outwards the focus periodically shifts creating a dynamic visual of cryptocurrency in action
The primary visual is a dynamic jagged trend line that changes color and style throughout the clips in the initial shots it appears as a sharp white line tracing rapid price fluctuations later it shifts to a vibrant green glowing line that follows
Negative statistical data presented on a pixelated display device as the bars and arrow trend line follow a declining price development symbolizing a failure of the financial system and recession of the global economy
A close up of red and green lines on a graph
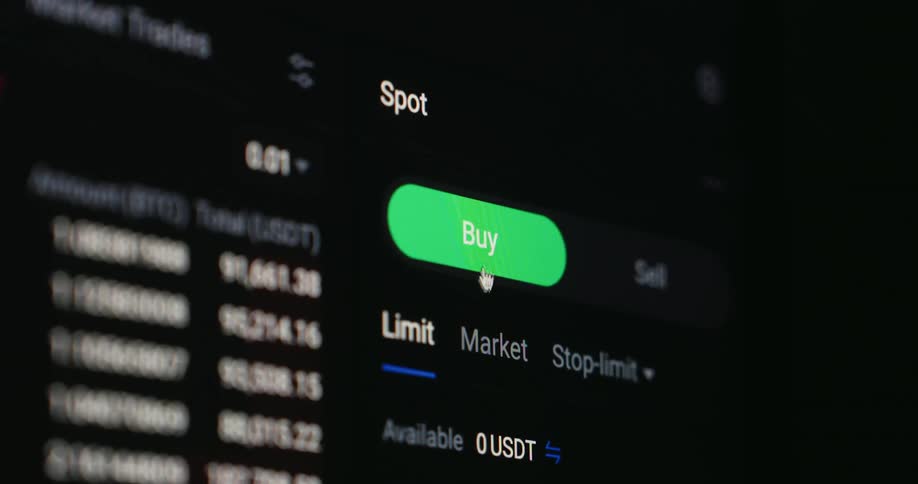
The buy button is clicked on the screen
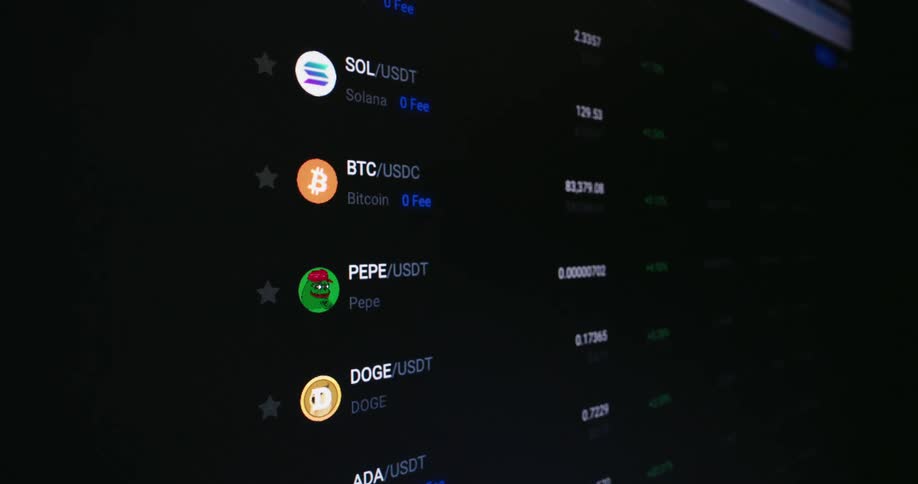
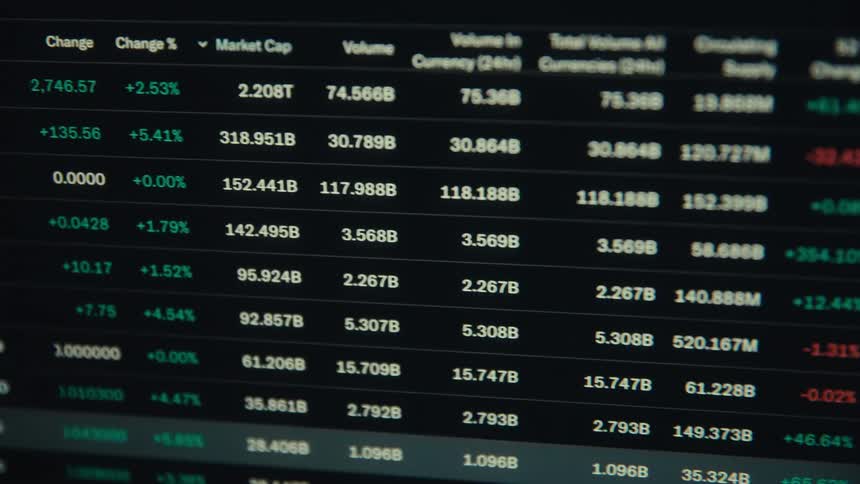
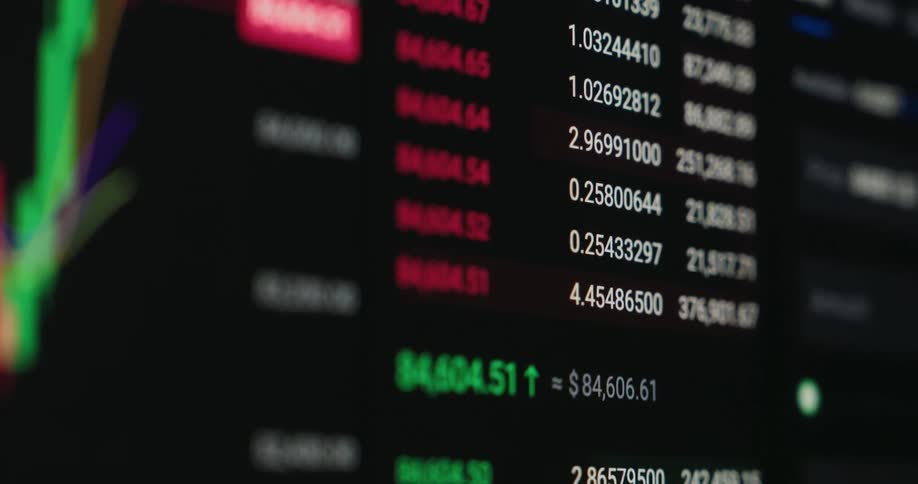
A series of cryptocurrency price lists displayed on a stock market website on a computer screen
Handheld macro close-up of bullish financial market chart or candlestick trading graph on black screen displaying the UI of stock or crypto broker application or platform as the price surges and the value of the asset increases during investment bull run
Close up of a device screen displaying a scrolling trading interface
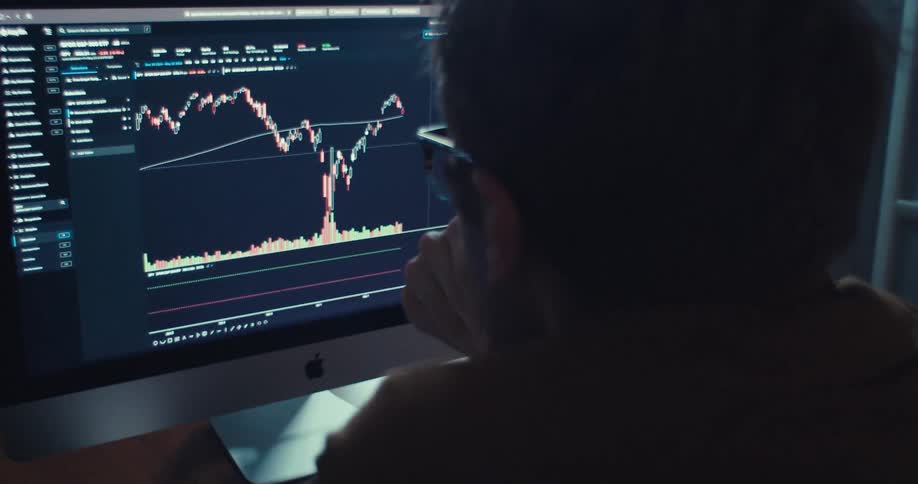
Man puts on his eyeglasses and concentrates on a plot displayed on his computer
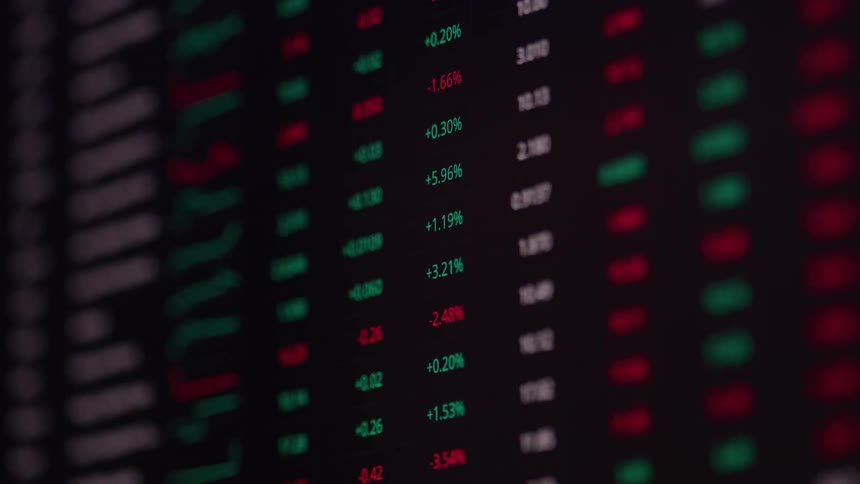
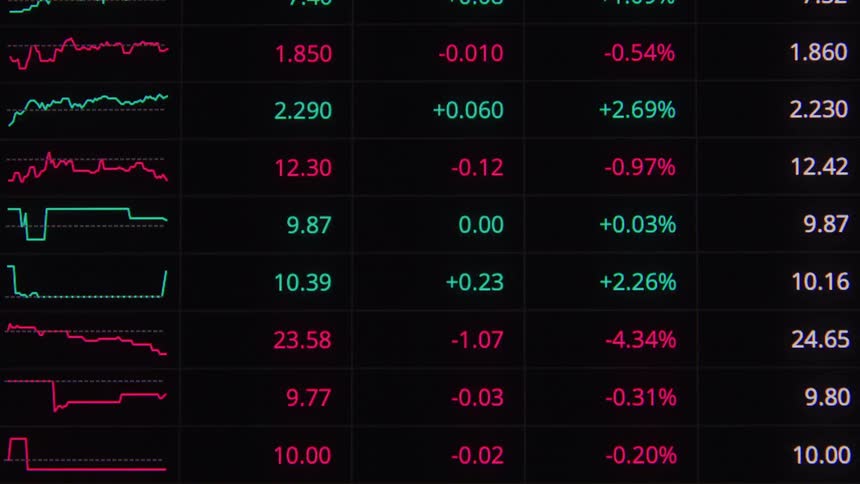
The screen displays numbers and percentages
Futuristic digital display shows a dynamic candlestick chart of stock market or cryptocurrency trading with algorithmic analysis
A blurry, out-of-focus close-up of a digital stock market ticker with fluctuating numbers on a dark screen
A digital display shows multiple lines of data graphing price fluctuations over time
Red and neon green glowing candles create a bullish candlestick chart pattern with upward movement and positive price development as symbol for a healthy commodity or equity market or profitable stock or crypto trades via online broker app
The pixelated computer screen shows the financial market reacting to a black swan event such as 9/11 causing a global economic crisis and crash followed by recession and great depression as the stock market collapses
Man and woman sitting at the table looking to and browsing through a candle chart on the laptop screen
A bullish candlestick chart pattern moves on the computer monitor with visible pixels as the bull flag breaks resistance to the upside causing massive surge and gain for investors and traders trading stocks and crypto currency coins or tokens online
Numbers representing stock information change on the screen
A man looks at a graph on a computer
Tube TV screen displaying pixelated finance animation of trading chart pattern with long green bar and red candles as the price of the asset or stock retraces after a pump or move to the upside followed by a consolidation and sideways movement
Computers screens are full of information
A financial analyst tracks cryptocurrency price movements on a laptop in their office, with the camera slowly zooming in on the chart
The information on the monitor is shaking and blurry
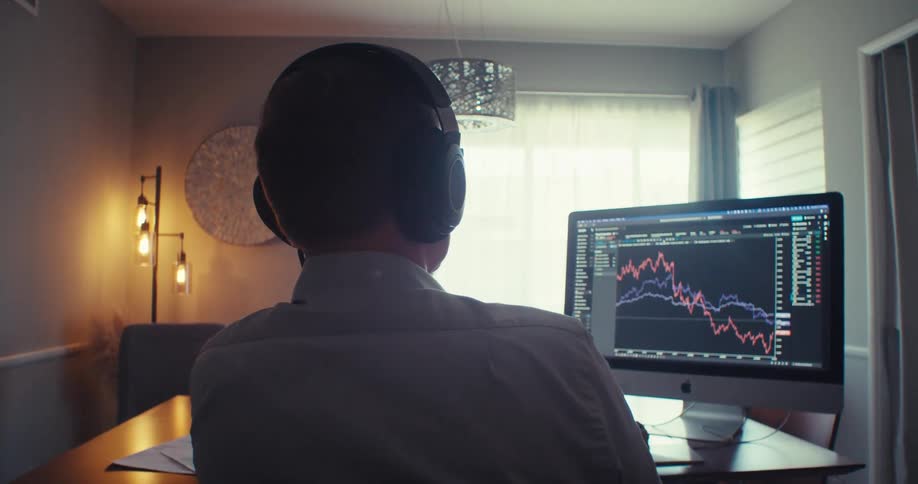
A man wearing headphones and analyzing a stock chart on a monitor
Man looking at stock exchange graphs on a laptop
Candlestick chart of ETF or exchange-traded fund with steady growth and positive price performance over a long time span or years as the price of the asset steadily increases with an uptrend and successful value development symbolizing good investment
A financial chart with red and green bars and colored lines is displayed on a dark screen
A closeup view of a stock market ticker displaying various stock symbols prices and percentage changes
A man talks while pointing to graphs on his computer
Computer monitors on a desk are displaying graphs
Candlestick chart against a gray background
Two individuals are reviewing a trading strategy flowchart printed on a black surface with one person pointing at a central node with a pen
A phone floats in a colorful ring

Need help finding the
right footage?

Have it delivered to your account within 1 business day.

This is Filmsupply

Our StoryOur FilmmakersArticlesFilmsPopular SearchesAll Categories

FM

A family of brands dedicated to empowering the creative.

FILMSUPPLY

Footage licensing for productions

MUSICBED

Music licensing for filmmakers

STILLS

Image licensing for creatives

© 2026 FM LLC.

Privacy PolicyLicense TermsTerms & ConditionsCareers