Musicbed
Filmsupply
Stills
Contact Us(800) 805-6802
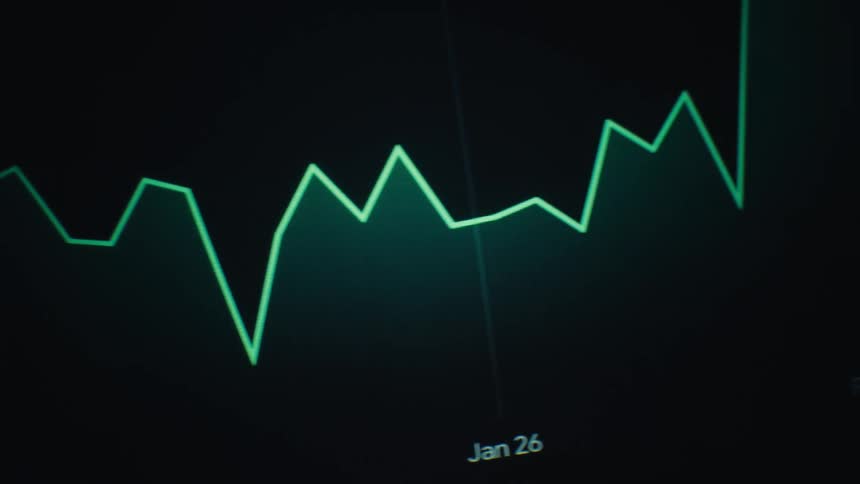
The primary visual is a dynamic jagged trend line that changes color and style throughout the clips in the initial shots it appears as a sharp white line tracing rapid price fluctuations later it shifts to a vibrant green glowing line that follows
Grid and white lines displayed on a screen with blur effect
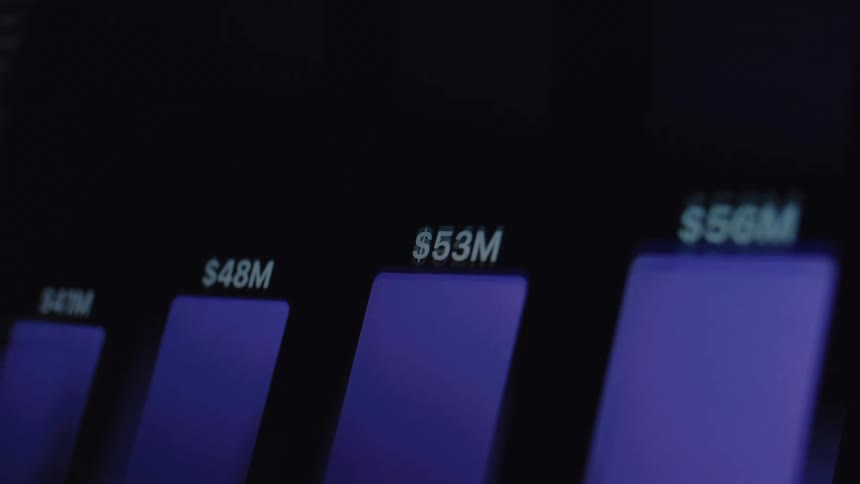
A close-up of a digital screen showing an animated financial bar graph with increasing monetary values
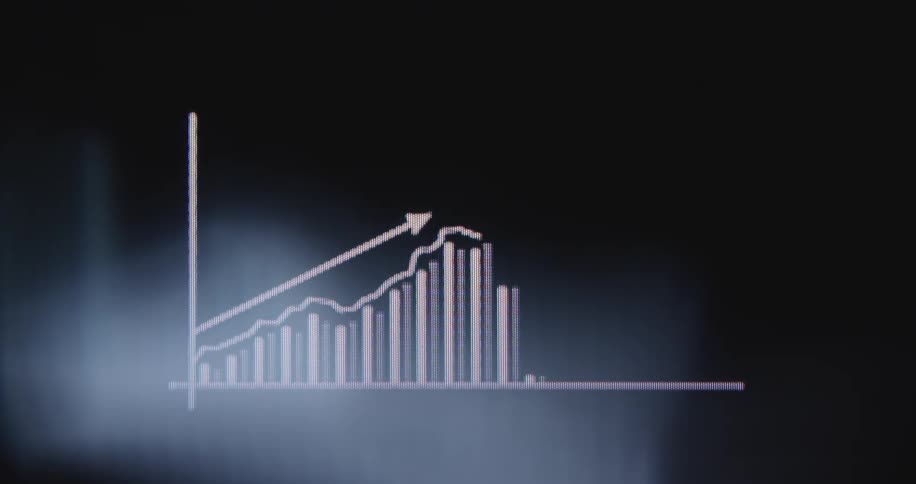
A simple animated bar and line graph illustrates positive growth and increasing profits on a black digital screen
Numbers grow on the graph displayed
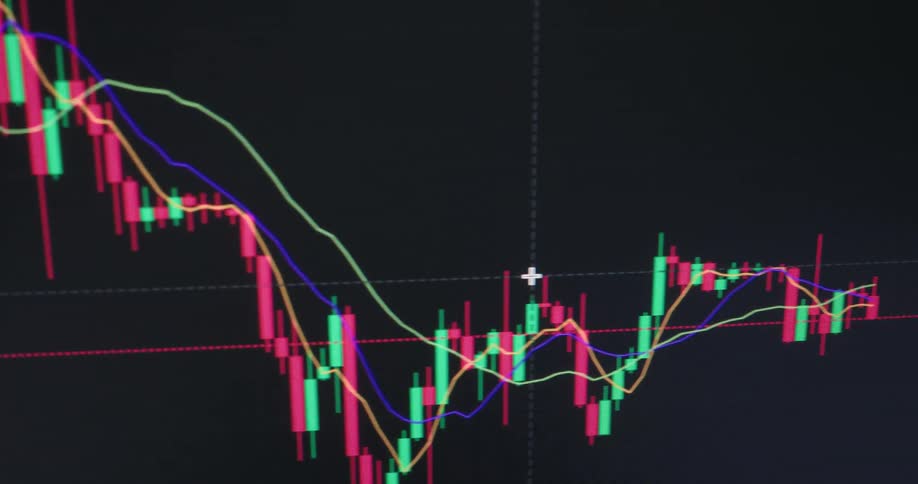
Bullish and bearish financial market candle chart
Hands of two people pointing at a laptop screen displaying a graph
Three variations of an animated digital bar graph show a downward trend, symbolizing financial loss or decreasing statistics
A closeup digital screen displays a fluctuating stock or financial chart
A closeup shot reveals multiple stacks of one hundred dollar bills each held together by a tenthousanddollar currency band
Macro shot of a computer screen showing a red bar chart and arrow indicating a positive, upward trend in financial data
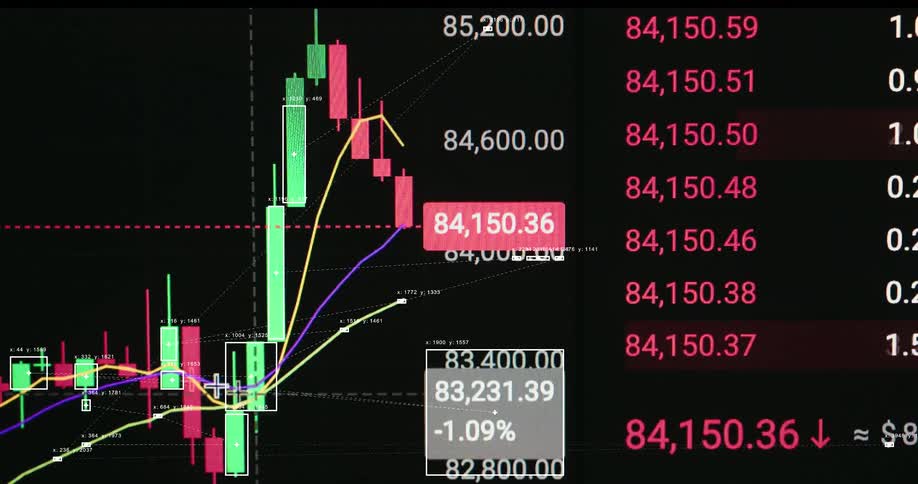
A detailed view of a real-time cryptocurrency exchange interface with candlestick graphs and financial data
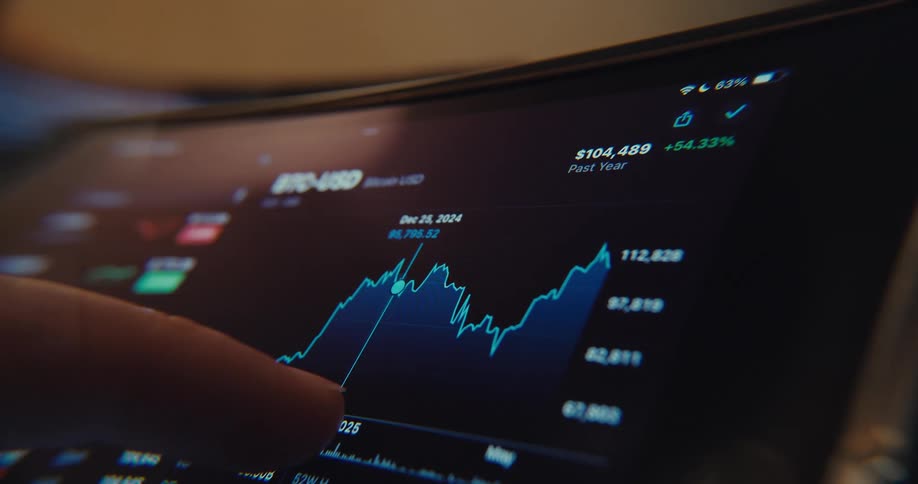
Person uses a finger to follow the plot of stock data on a device screen
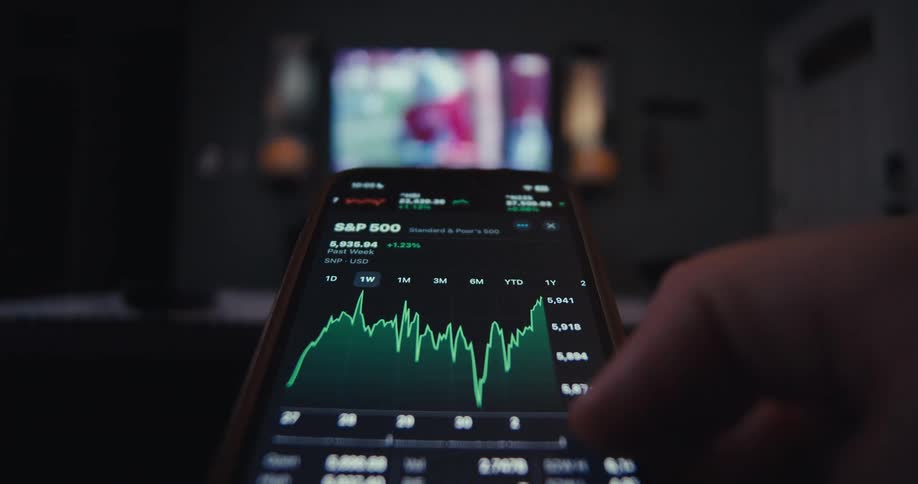
Swiping on a phone to see different charts
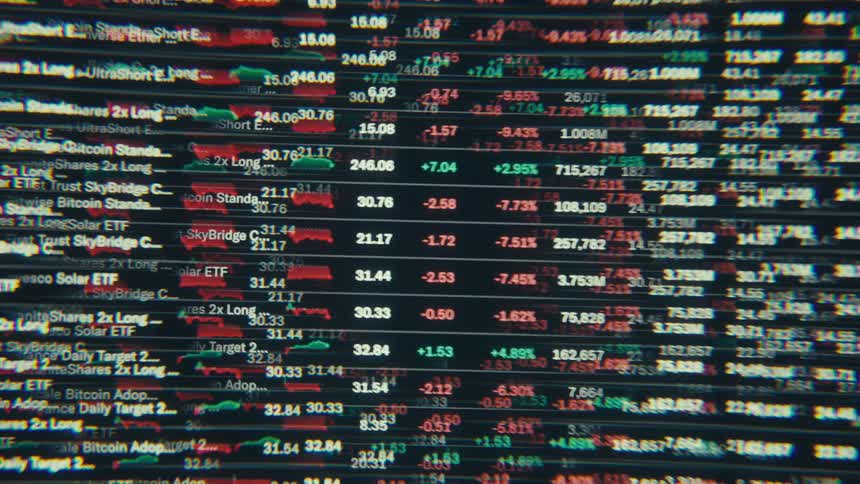
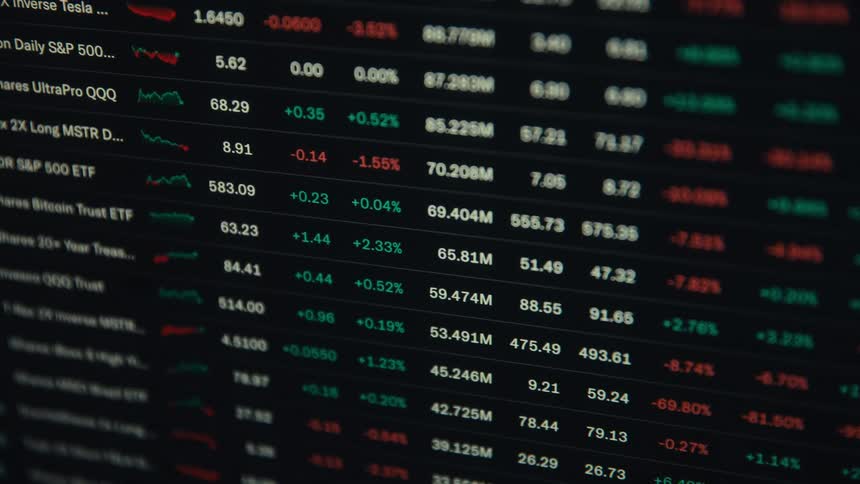
A digital screen shows rows of fluctuating stock market data
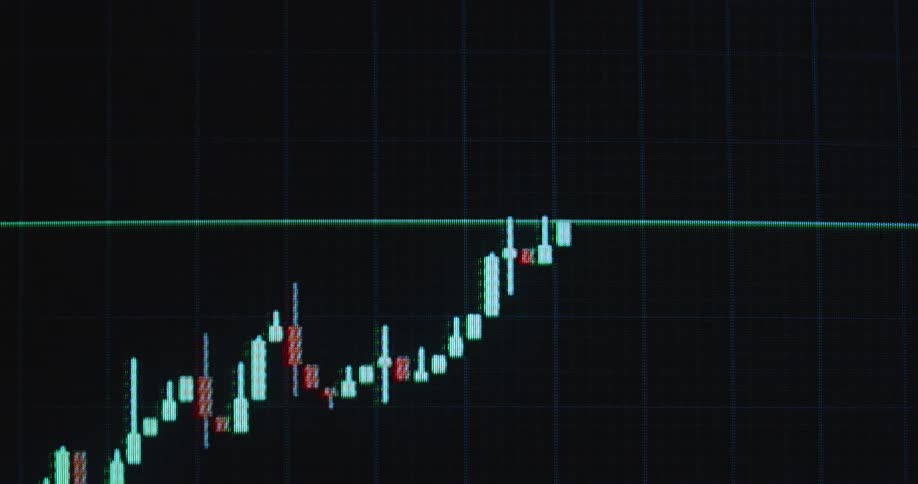
A bullish candlestick chart pattern moves on the computer monitor with visible pixels as the bull flag breaks resistance to the upside causing massive surge and gain for investors and traders trading stocks and crypto currency coins or tokens online
Glowing charts and financial data move across the screen in a blur of colors
Red falling trading chart of an online stock broker or crypto exchange in a downward trend during a bear market crash and financial crisis symbolizing failure bankruptcy insolvency and losses caused by declining international and global economy
Candlestick chart of ETF or exchange-traded fund with steady growth and positive price performance over a long time span or years as the price of the asset steadily increases with an uptrend and successful value development symbolizing good investment
Glowing green and red digital line graphs display financial data on a dark background
An animated blue bar graph on a black screen shows a downward trend, representing financial loss or recession
Stocks scrolling vertically on a screen
A man is typing on his laptop
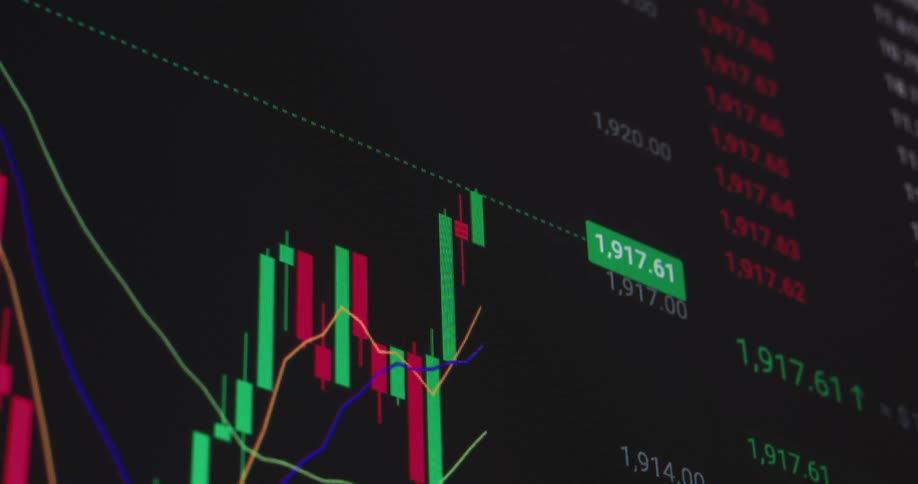
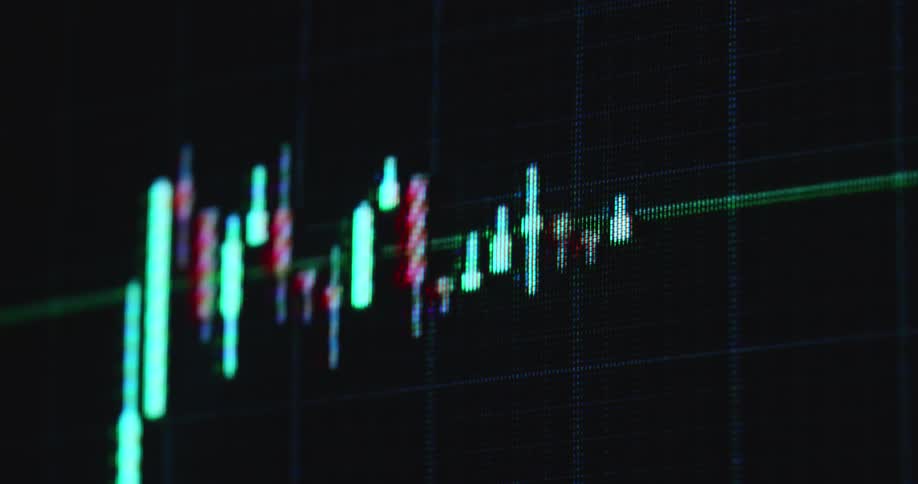
A close-up of a digital stock market chart shows fluctuating asset prices with candlestick patterns and changing numbers
The pixelated computer screen shows the financial market reacting to a black swan event such as 9/11 causing a global economic crisis and crash followed by recession and great depression as the stock market collapses

A rapid montage of online news headlines highlights the word 'Biotechnology' in a fast-paced stream of information
A price chart of stocks is displayed on a computer screen
Aerial View of Busy Commercial Shipping Port and Cargo Container Terminal
A chart showing the change in stock prices
Swiping on the smartphone
A blurry close-up of a digital stock market ticker shows financial data changing rapidly on a blue screen
Computers screens are full of information
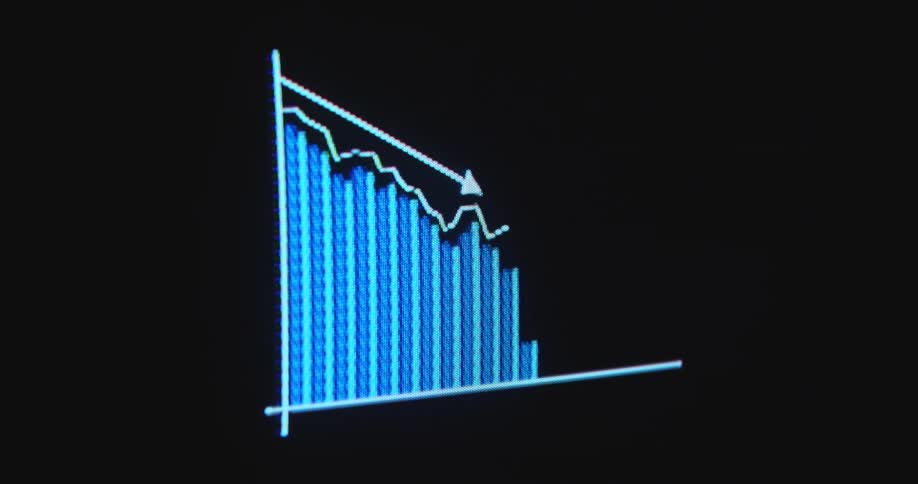
Macro close-up of a digital screen showing a declining blue bar graph with a downward pointing arrow, symbolizing a financial market crash or economic downturn
A close-up of a digital stock market chart displays real-time price fluctuations with candlestick patterns on a screen
A financial chart displaying colorful candlestick patterns indicates market trends and price movements
A blue arrow moves across the screen while a graph with statistic bars builds beneath it with a downward or negative trendline visualizing the lowering or sinking of costs or financial income data during a corporate presentation
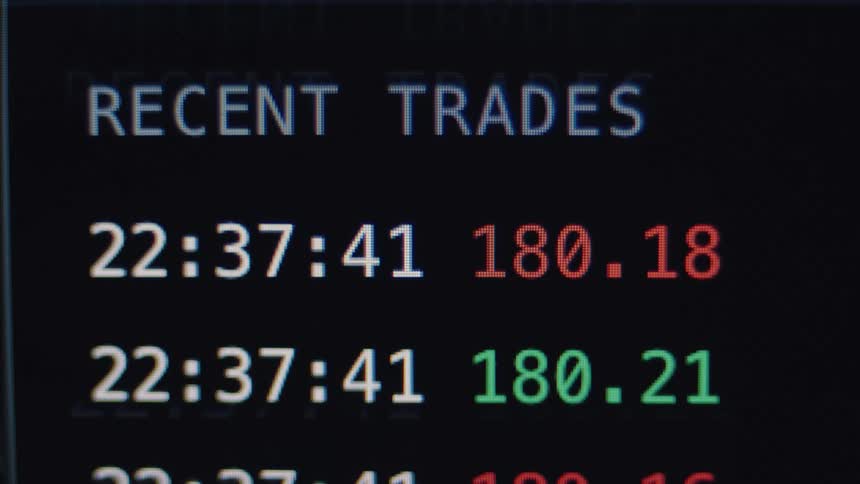
A close-up of a digital stock market ticker shows recent trades with fluctuating prices in red and green
Hockey Puck in rotating motion
Falling financial market chart against a background of abstract numbers
Financial chart bars in green and red tones with blur
Dynamic macro footage with shaky hand-held camera movement of green and red candles of candlestick chart pattern with upward movement on a glowing financial trading graph with positive price development on dark screen or monitor
Red and green candlestick chart on a pixelated screen with RGB pixels as the bearish graph breaks resistance to the downside and the market or asset value collapses causing massive losses and volatility due to an unexpected crash
Handheld macro close-up of bullish financial market chart or candlestick trading graph on black screen displaying the UI of stock or crypto broker application or platform as the price surges and the value of the asset increases during investment bull run
Financial candlestick chart on a screen indoors
The stack of money is on fire
Bundles of banded bills are on fire
The line graph goes up and down on the monitor
Screen displaying prices for cryptocurrenciesincluding bitcoin and ethereumand stocks
A neon green retro monitor displays a chart showing the movement of a stock price with an arrow crashing with a dramatic downward or negative tendency or direction causing investors to lose money presented by data visualization
A glowing red digital graph on a screen shows a sharp downward trend, symbolizing a financial market crash
Computer monitor displaying financial market data
A pile of cash is on fire
A person is checking a graph on their phone
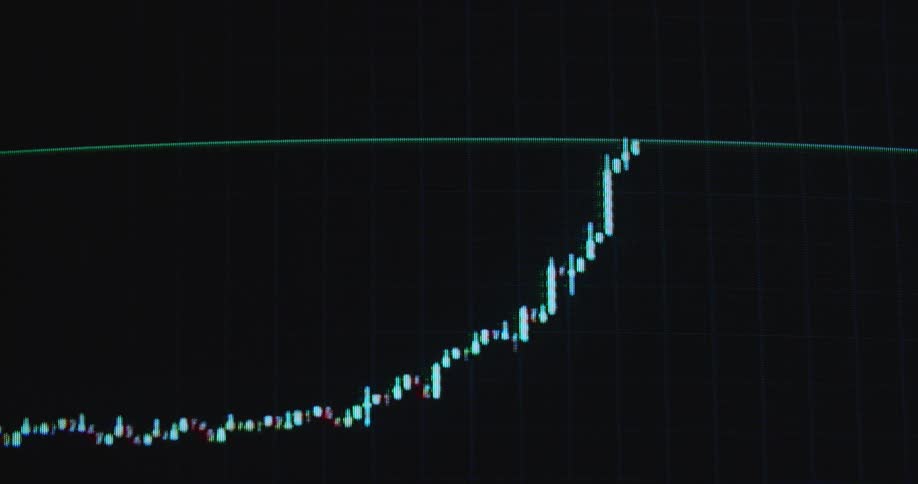
Pixelated RGB computer or display device screen presenting a candlestick trading chart with positive exponential price development as the green candles go up indicating a healthy global economy and stock market reaching new all-time highs
Extreme close up of a computer screen displaying two green sound decibel bars
An animated bar graph with a rising arrow appears on a digital screen in this macro shot, symbolizing positive business statistics and financial growth
Water droplets cover a pile of gold coins on a table
A computer screen has a lot of data on it
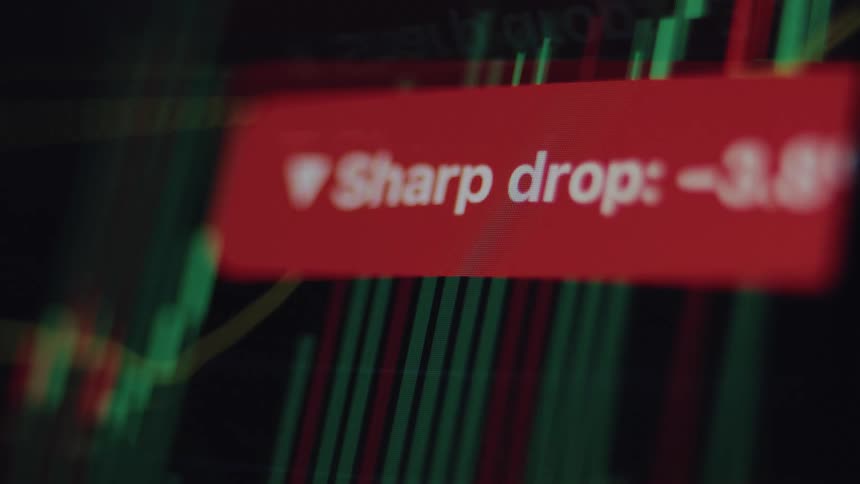
A close-up of a digital stock market chart on a screen shows a red notification alerting to a sharp drop in value
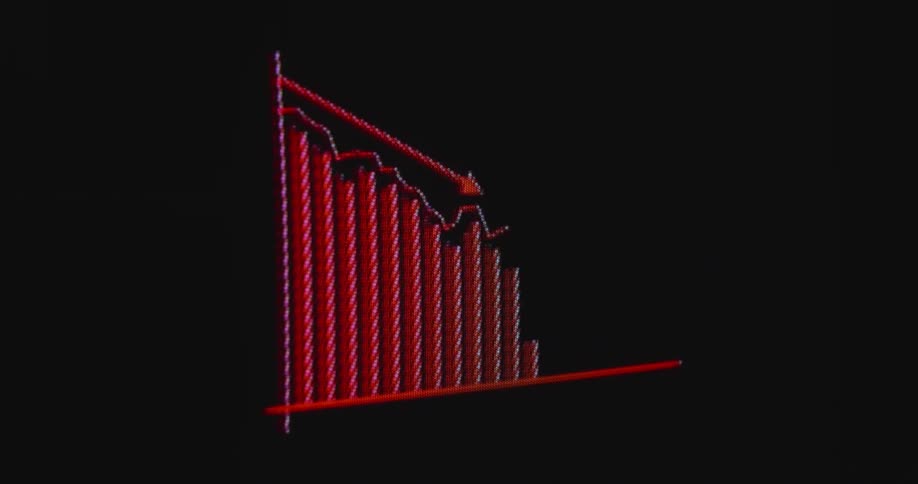
Pixelated computer screen showing animated data in red trend line graph with negative downward movement symbolizing the stock market crash from 1987 or any other financial crisis causing a meltdown of the global economy
Monetary values displayed on a dark digital financial interface
Tall buildings stand out against lit sky with structure under construction on the left
A street light on a silhouetted telephone pole turns on against a moody, dark sky at dusk

Need help finding the
right footage?

Have it delivered to your account within 1 business day.
This is Filmsupply

Our StoryOur FilmmakersArticlesFilmsPopular SearchesAll Categories

FM

A family of brands dedicated to empowering the creative.

FILMSUPPLY

Footage licensing for productions

MUSICBED

Music licensing for filmmakers

STILLS

Image licensing for creatives

© 2026 FM LLC.

Privacy PolicyLicense TermsTerms & ConditionsCareers