Musicbed
Filmsupply
Stills
Contact Us(800) 805-6802
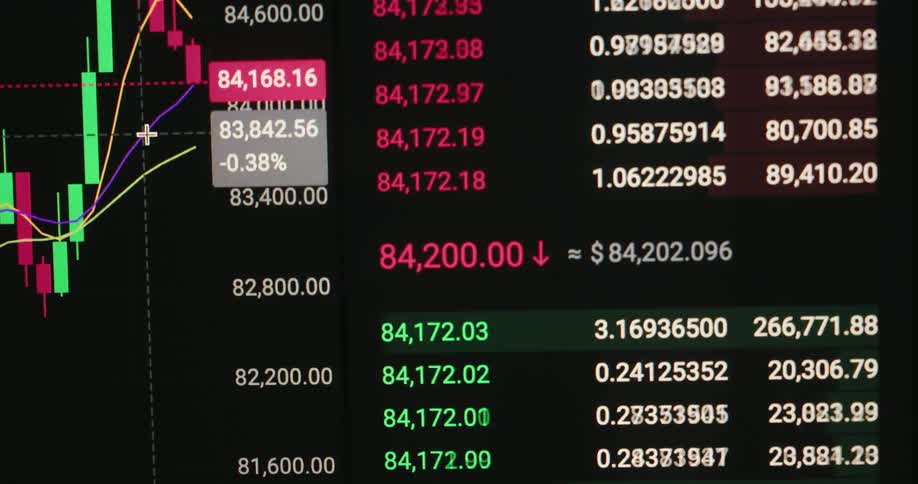
Extreme macro close up of a stock chart candle diagram with red and green candles and increasing and decreasing numbers on a dark digital computer screen with pixelated image and distortion
Falling financial market chart against a background of abstract numbers
A close up of a screen with numbers on it
A neon green retro monitor displays a chart showing the movement of a stock price with an arrow crashing with a dramatic downward or negative tendency or direction causing investors to lose money presented by data visualization
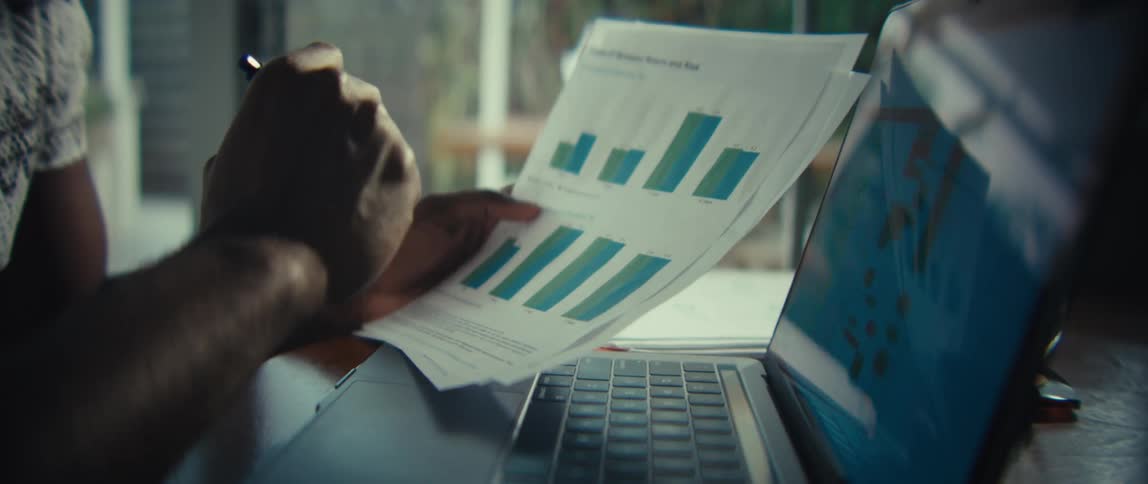
Person analyzing printed and digital charts
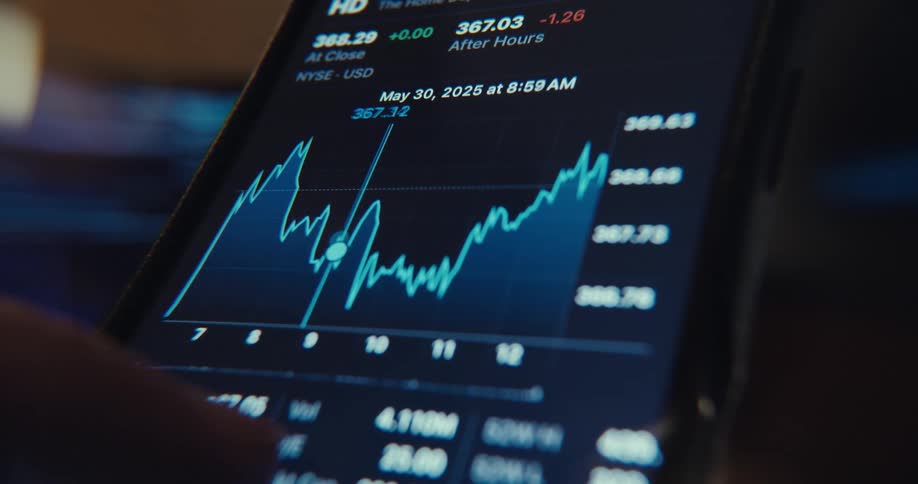
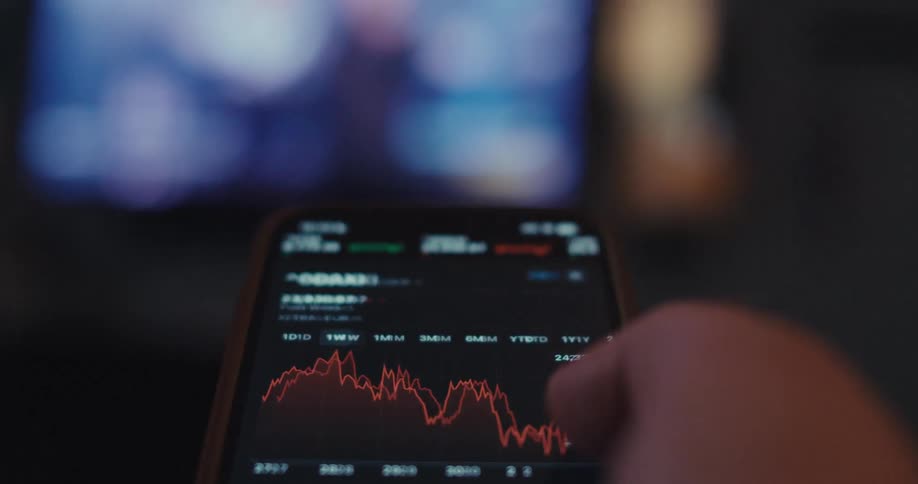
Closeup of a smartphone screen showing a fluctuating stock chart
Glowing charts and financial data move across the screen in a blur of colors
A macro shot of a digital screen reveals a rapidly changing stock market graph, with prices fluctuating and a green line trending upwards
A blurry, out-of-focus close-up of a digital stock market ticker with fluctuating numbers on a dark screen
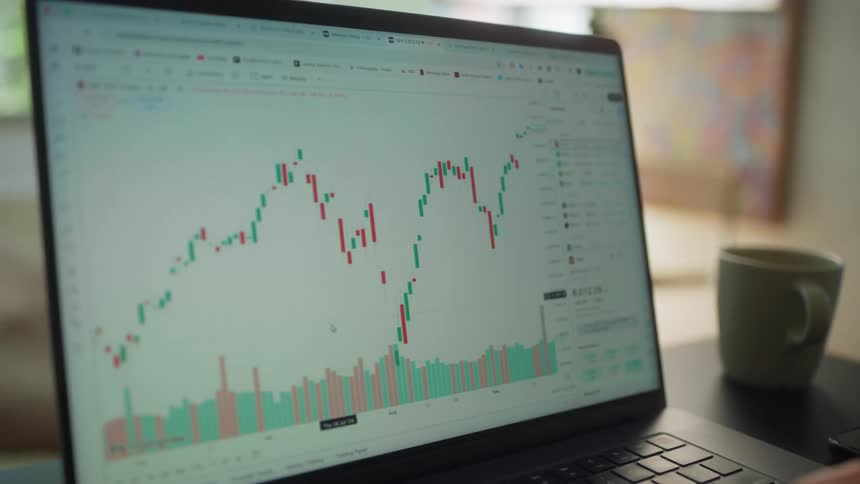
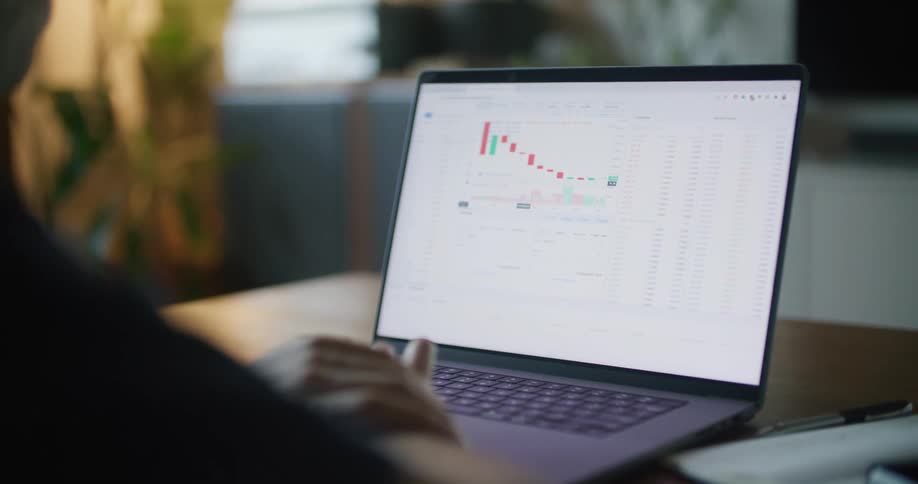
A person scrolls through a graph on his laptop
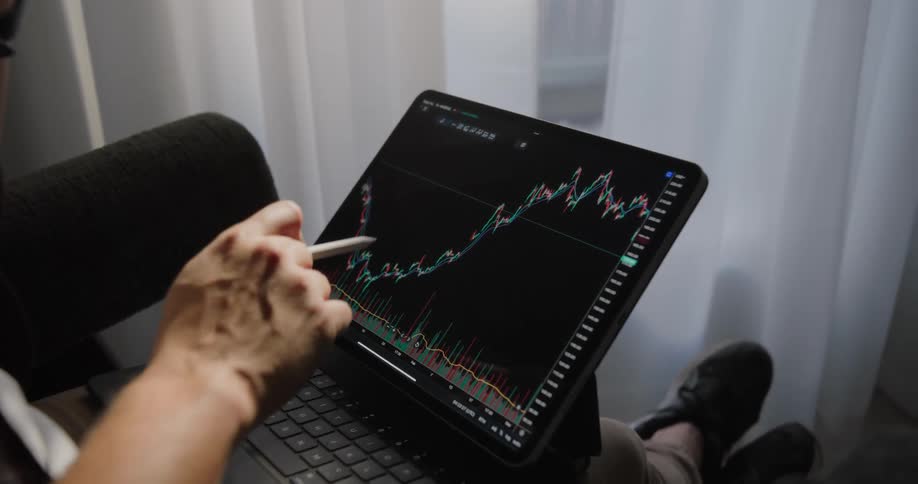
A man points and draws on a graph on a laptop while sitting in a room next to a window
Red falling financial market chart
Golden coins with engraved bitcoin symbol sits in rippling water
A close-up shot of a stock market ticker board on a computer screen displaying real-time financial data
Close up of a line graph on a screen under a blue light while the camera comes on and off focus
Financial market candle chart against a gray screen
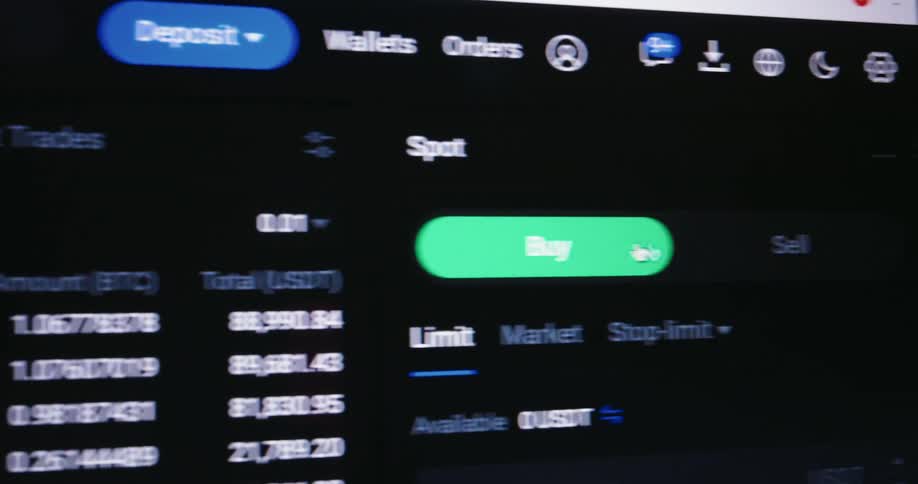
A mouse cursor clicks the green buy button on a cryptocurrency trading app highlighting the digital interface and live price data
Pixelated screen of a vintage 90s computer displaying a green graph with an arrow pointing upwards symbolizing the beginning of the digital financial era and the first online trading platforms for buying stocks in the internet
A person is checking a graph on their phone
The graphs change on the computer display
A close-up of a digital screen showing a real-time stock market chart with fluctuating numbers and candlestick patterns
Green numbers fluctuate rapidly on a dark stock market ticker screen, displaying real-time financial trading data
A computer screen showing a stock chart with indicator lines
A macro close-up of a green 'Breakout' notification with an upward arrow appearing on a digital stock market or cryptocurrency trading chart
A computer screen has a lot of data on it
Close up of the shiny engraved surface of golden bitcoin physical coins over a reflecting surface
Closeup of a monitor displaying a financial market chart
Stack of golden coins with the bitcoin logo printed on them in front of a screen showing a financial graph
Numbers flash on the screen
A person traces the graph on his tablet
A man watches the stock market chart on a monitor and computer screen with serious focus
A digital screen shows rows of fluctuating stock market data
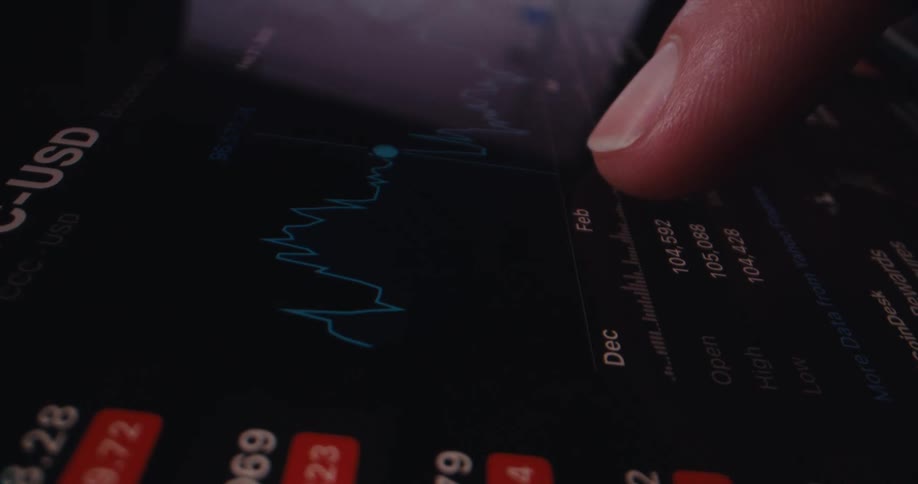
A finger scrolls through a stock market chart on a smartphone in a closeup shot
A woman sits at a desk in an office and works on her laptop
Person uses a finger to follow the plot of stock data on a device screen
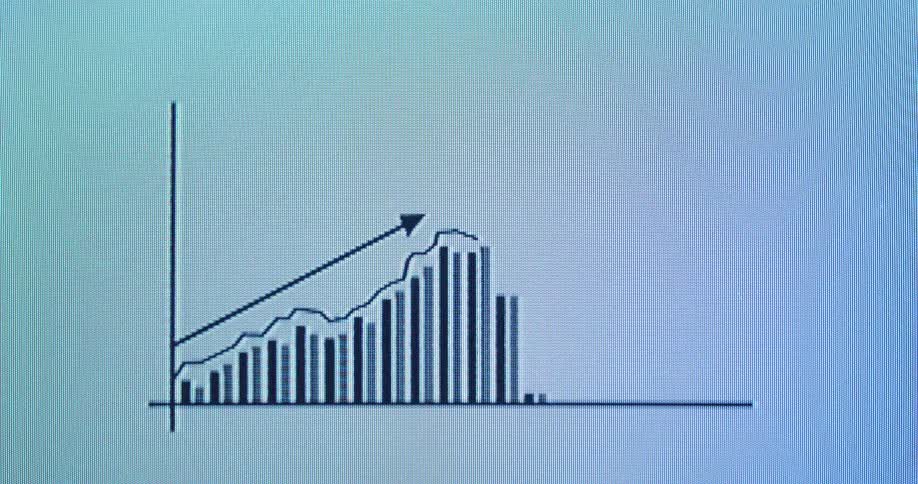
A macro shot of a blue bar graph on a computer screen with a white arrow indicating an upward trend of growth and success
The screen of a mobile trading app shows the interface for purchasing bitcoin highlighting the large green buy btc button
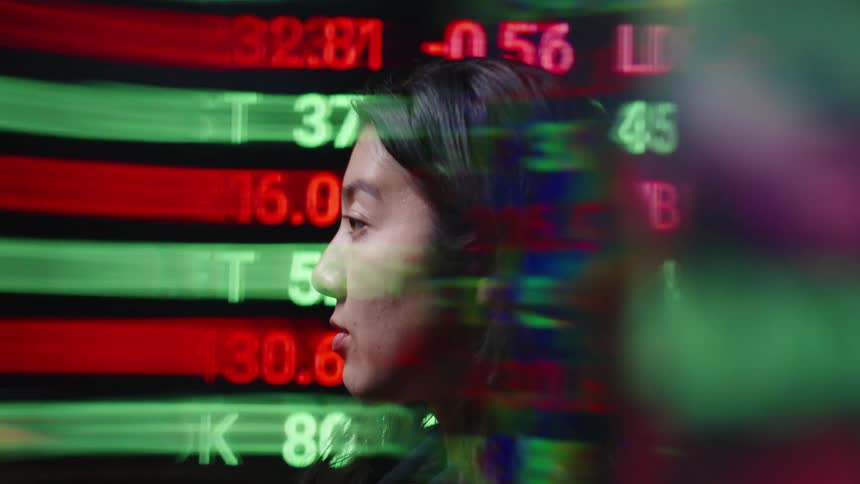
Human profile overlaid with market data in red and green
A closeup view of a stock market chart with red and green candlesticks fluctuating
Financial market candle chart against abstract background
Dramatic macro close up with shaky camera movement of a screen showing animated financial trading chart or business statistic with negative outlook prediction or development in neon green retro colors
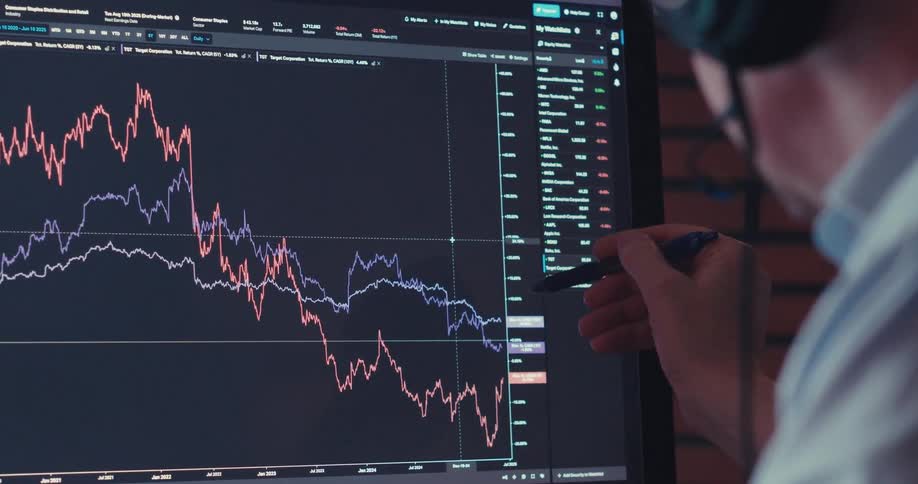
A man talks while pointing to graphs on his computer
A person is scrolling through information on their cell phone
A line graph is displayed on a monitor on the side of a building
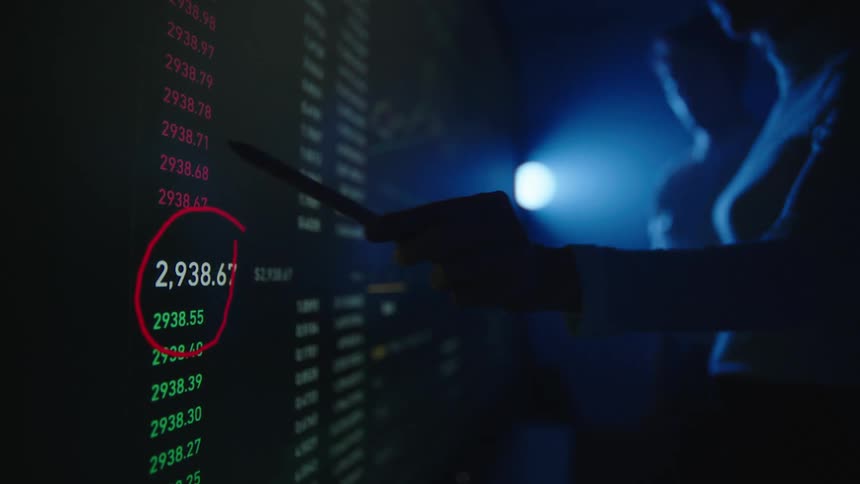
Man and woman discuss stock numbers on large digital display in dark room lit by single bright blue light
Pixelated bar animation or sales chart with an upward line represents continuous growth over time as the value increases during financial data presentation due to positive development or great business performance with economic success
Red and blue candle chart
The information on the monitor is shaking and blurry
Computer monitor displaying financial market data
Chart of rising and falling candles against a blurred background
A digital screen shows a volatile stock market or cryptocurrency candlestick chart with a line graph fluctuating up and down
Static shot of a falling graph from an online trading application in a down trend during critical market cycle entering bear market after a crash and crisis on vintage screen with rgb pixels and glitches and retro digital look
A man is using his laptop
A screen with cryptocurrency market data and tickets that change
A man is sitting down holding his cell phone with both hands as he scrolls
A close-up of a digital stock market chart on a screen displaying real-time, fluctuating share prices
Close up of a device screen displaying a scrolling trading interface
A fastpaced sequence of glowing candlestick charts and fluctuating stock market tickers appears through glitchy transitions and bright light leaks creating a highenergy atmosphere of digital financial trading
A man is sitting at a desk looking at a laptop computer with a graph on the screen
Swiping on a phone to see different charts
Computer screen with numbers and writing and a button with buy written on it
A finger traces a graph on a touchscreen
Digital pen pointing to numeric values displayed on a dark financial interface

Need help finding the
right footage?

Have it delivered to your account within 1 business day.
This is Filmsupply

Our StoryOur FilmmakersArticlesFilmsPopular SearchesAll Categories

FM

A family of brands dedicated to empowering the creative.

FILMSUPPLY

Footage licensing for productions

MUSICBED

Music licensing for filmmakers

STILLS

Image licensing for creatives

© 2026 FM LLC.

Privacy PolicyLicense TermsTerms & ConditionsCareers