Musicbed
Filmsupply
Stills
Contact Us(800) 805-6802
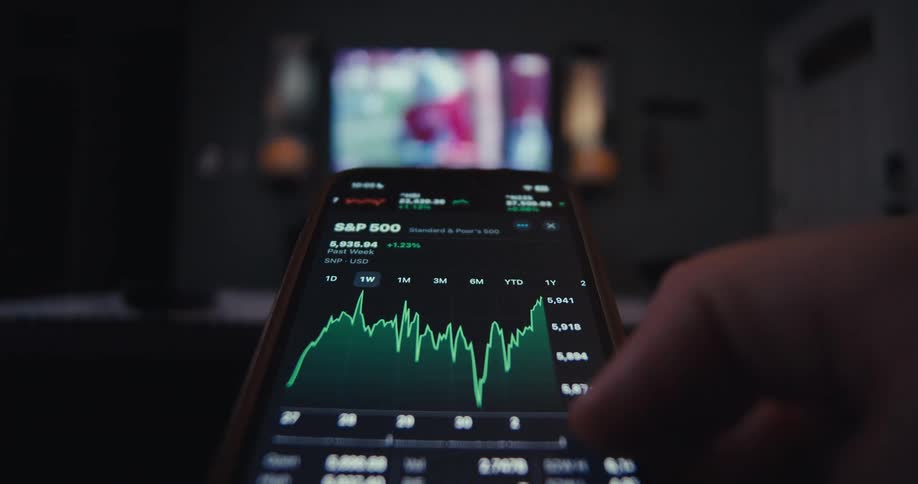
Close up of a device screen as a person swipes through trading charts in a currency trading application
A stylized 3d animation shows a glowing candlestick stock chart with a strong upward trend on a futuristic digital interface
A person uses their tablet to check stocks
A number of shiny coins with the bitcoin logo on them are piled on a wet surface
A cinematic, out-of-focus macro shot of a real-time stock market candlestick chart on a digital screen
The primary visual is a dynamic jagged trend line that changes color and style throughout the clips in the initial shots it appears as a sharp white line tracing rapid price fluctuations later it shifts to a vibrant green glowing line that follows
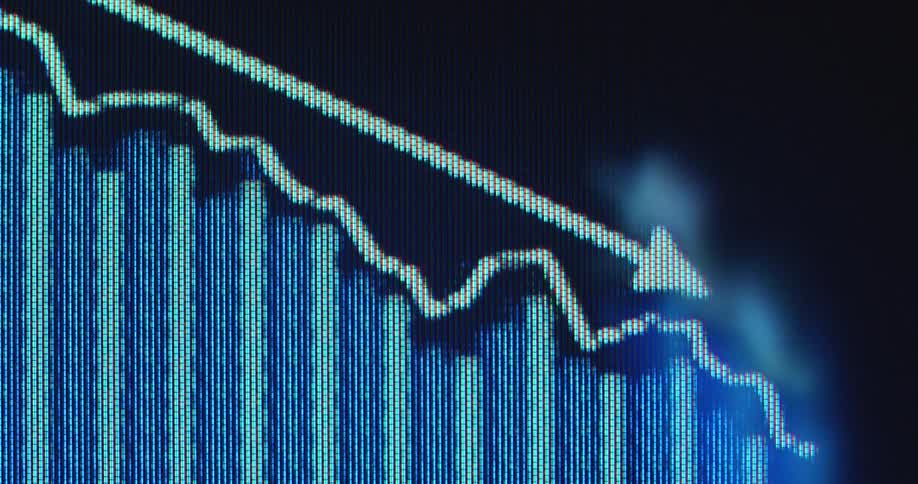
Frontal macro close up of computer monitor or screen panel displaying the user interface of a stock broker or crypto currency trading exchange as a financial investment chart or data graph is going down with a negative price development
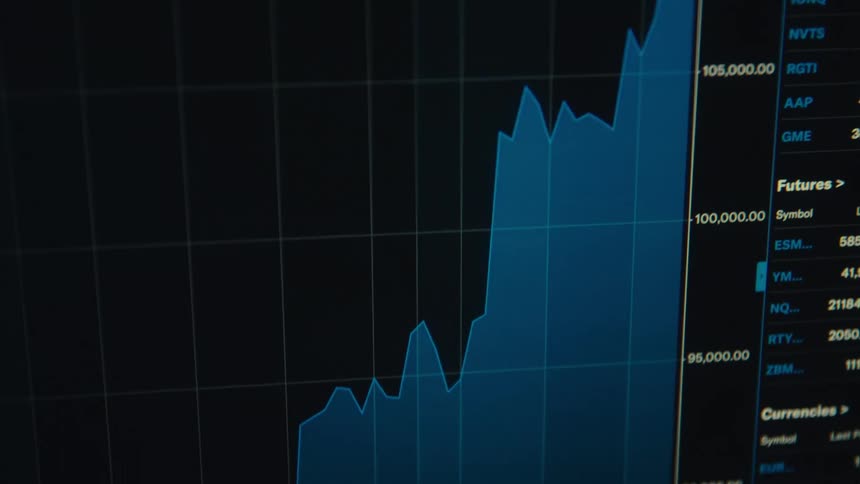
A graph of fluctuating stock data displays on a dark digital screen
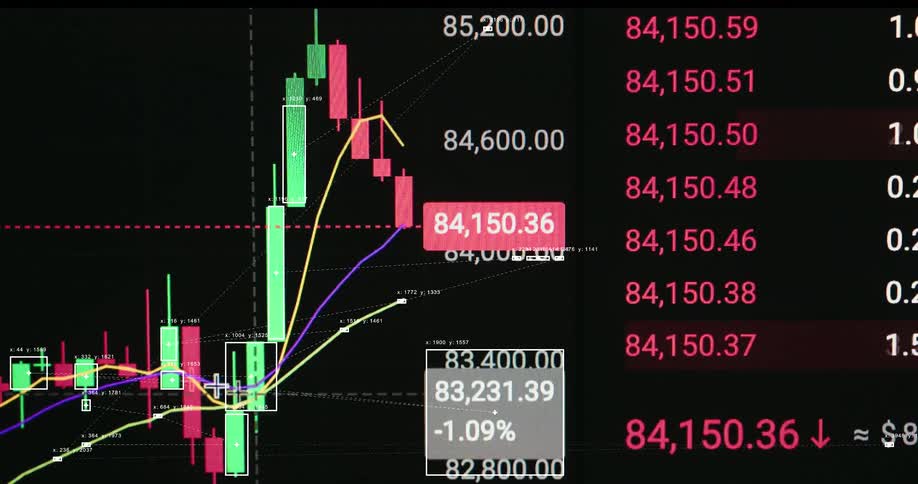
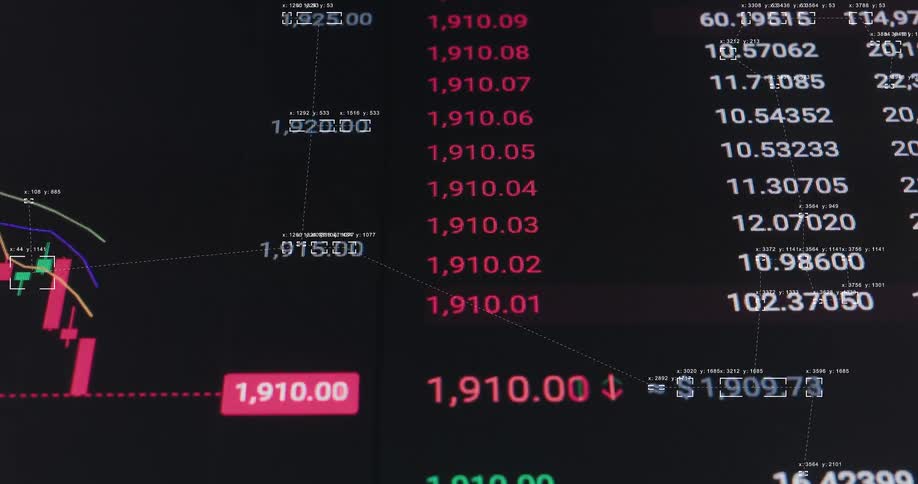
A detailed view of a real-time cryptocurrency exchange interface with candlestick graphs and financial data
A computer monitor displays a stock market candlestick price chart
The distorted image has rainbow colors
A closeup shot shows a digital screen displaying a financial graph with multiple colored lines representing different market trends the camera pans slowly from right to left revealing the volatile jagged movements of the lines as they shift up and dow
Line graphs and numbers move across the monitor
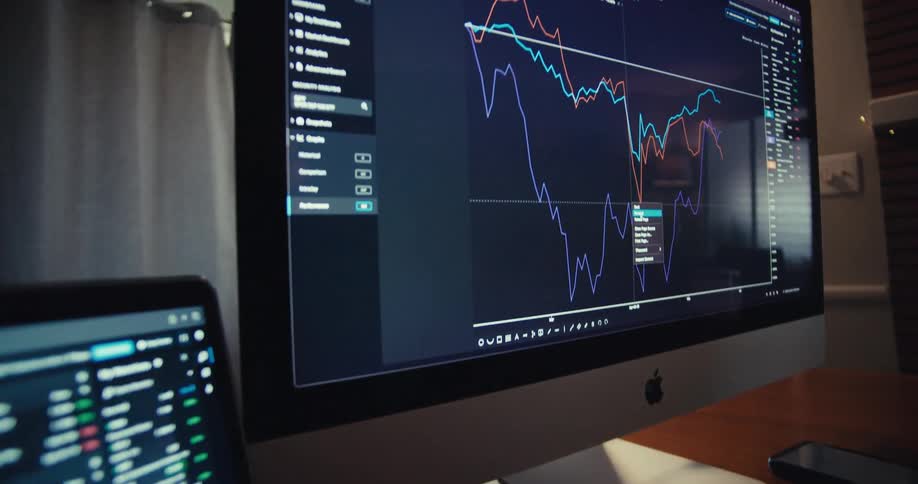
Close up of man trading on a laptop and desktop computer in a room
An abstract, glowing line graph fluctuates over a blurred candlestick chart, visualizing the volatility of the financial stock market
The monitor has a color coded line chart on display
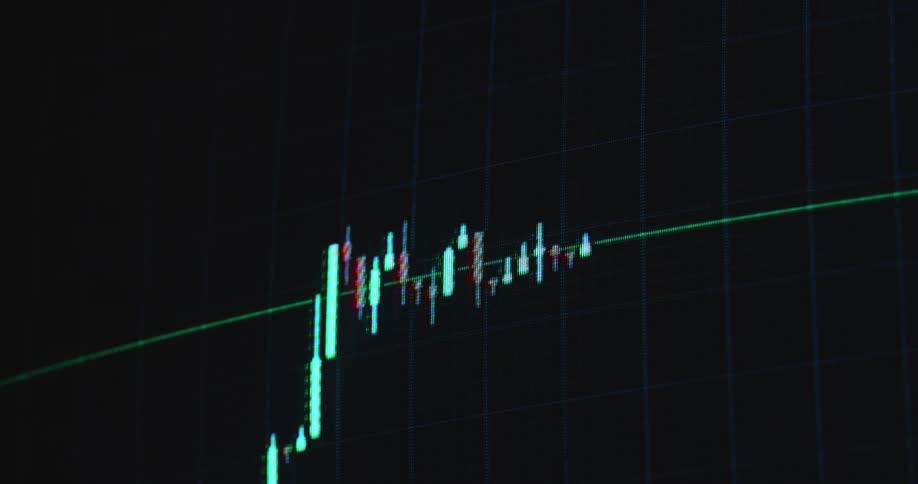
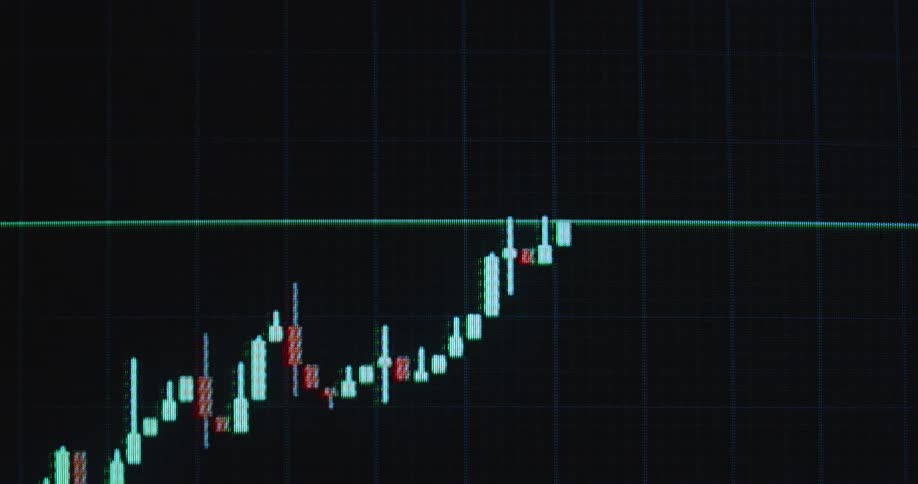
A bullish bull flag chart pattern is displayed on a dark monitor as the red and green candlestick candles form sideways consolidation before breaking resistance for a massive move to the upside with positive price development and profit in a bull run
Close up of a candle diagram stock chart pattern on a digital RGB TV screen consisting of pixels and green and red candles as the graph rises with a positive upward tendency symbolising financial success and share trading
A buy button is on the cryptocurrency screen
Financial charts with colored bars and lines displayed on a digital screen
A finger scrolls a glowing market chart on a screen that shows fluctuating prices with sharp dips and recoveries
Line graphs and information are displayed on the computer screens
A digital screen showing stock market price chart
Financial candlestick chart against a gray screen
A wall made up of animated graphs
A screen shows a financial chart with lines and bars moving up and down
A red arrow moves upwards across the screen as a bar graph animation is forming beneath it presenting statistical data and visualizing the dramatic increase of prices and production costs
A digital screen displays a green bitcoin sign or logo animation consisting of the binary coding digits one or 1 and zero or 0 in a neon green color
The numbers on the monitor change frequently
A computer screen displaying a stock market candlestick chart with fluctuating red and green lines indicating market trends
A closeup of a pixeled digital screen shows colorful animated data graphs and audio waveforms fluctuating against a dark background
Blue and red candlestick chart of financial market
A man analyzes stock market charts on a computer screen in a dimly lit room
Close up of water running over the shiny engraved surface of golden bitcoin physical coins
Green rectangles form a plot against a black background on a digital screen
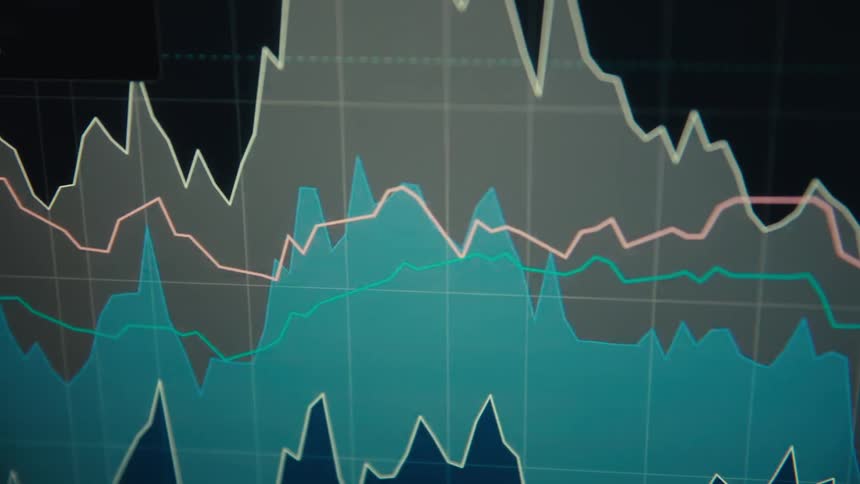
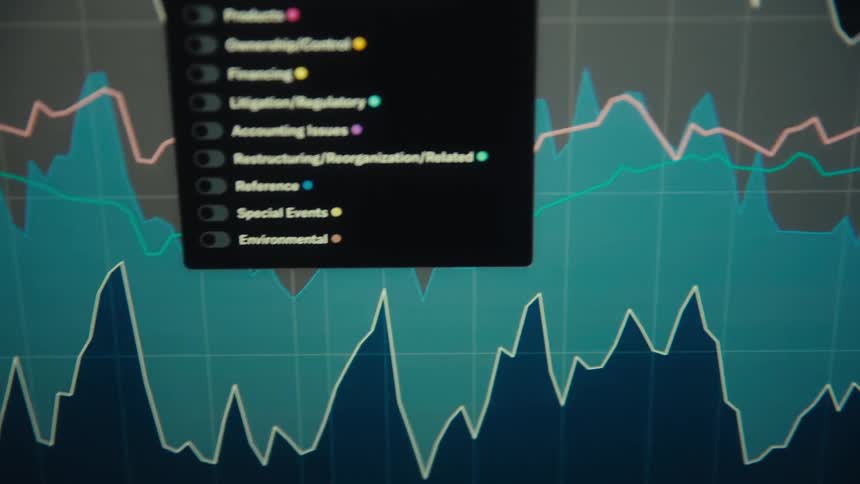
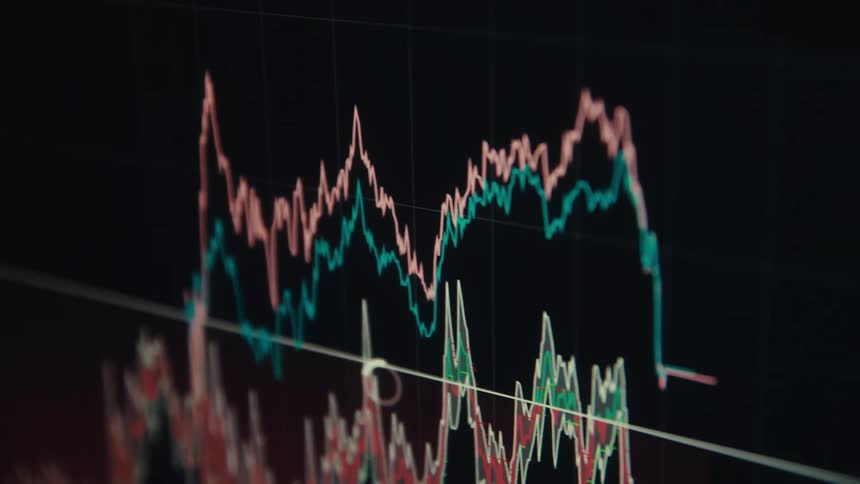
A closeup of layered line and area graphs in teal pink and gray against a dark grid the sharp peaks and troughs and overlaid legend suggesting volatile financial or technical data
Dramatic macro view of data visualization or presentation showing a negative down trend with critical development as the digital graph or chart animation crashes symbolizing extreme volatility and economic decline and uncertainty
A monitor displays a stock market candlestick chart with green and red candles moving across a dark grid
Cursor causing the screen to scroll to the right as it moves along the graph line
Close up of an electronic screen displaying a trading interface in white and black
An abstract waveform with overlapping light streaks
Market chart displaying shaded areas and colored lines representing financial fluctuations
Informational graphs cover the computer screen
A stylus points at colorful fluctuating line graphs displayed on a digital screen suggesting data analysis or market tracking
A vibrant green digital graph displays fluctuating diagram consisting of lines and vertical bars with a prominent downward arrow indicating a decline of the Wall Street stock market or global economy with negative price development
A digital display shows multiple lines of data graphing price fluctuations over time
Candlestick chart of ETF or exchange-traded fund with steady growth and positive price performance over a long time span or years as the price of the asset steadily increases with an uptrend and successful value development symbolizing good investment
A candle diagram graph plots an array of data on a pixel screen with numbers representing rising and falling real estate prices or changes in the stock market or crypto currency finance sector
A futuristic animated stock market or cryptocurrency trading chart displays real-time fluctuating values and data analysis
Black and white shapes
Man wearing glasses observes financial charts on a screen with his hand on his chin
Swiping on the smartphone
The line graph goes up and down on the monitor
People walk by the line graph on the monitor
Bullish and bearish financial market candle chart
Series of candlestick stock prices displayed on a screen
Extreme closeup of a pixelated red chart with significant downward trend highlighted by descending line and arrow as the stock market or the global economy decline and the US dollar loses value due to negative price development
A closeup digital screen displays a fluctuating stock or financial chart
Numbers grow on the graph displayed
A computer screen with a green graph on it
Screen displaying a dimensional color graph
Red and blue candle chart
Hands of two people pointing at a laptop screen displaying a graph

Need help finding the
right footage?

Have it delivered to your account within 1 business day.

This is Filmsupply

Our StoryOur FilmmakersArticlesFilmsPopular SearchesAll Categories

FM

A family of brands dedicated to empowering the creative.

FILMSUPPLY

Footage licensing for productions

MUSICBED

Music licensing for filmmakers

STILLS

Image licensing for creatives

© 2026 FM LLC.
Privacy PolicyLicense TermsTerms & ConditionsCareers