Musicbed
Filmsupply
Stills
Contact Us(800) 805-6802
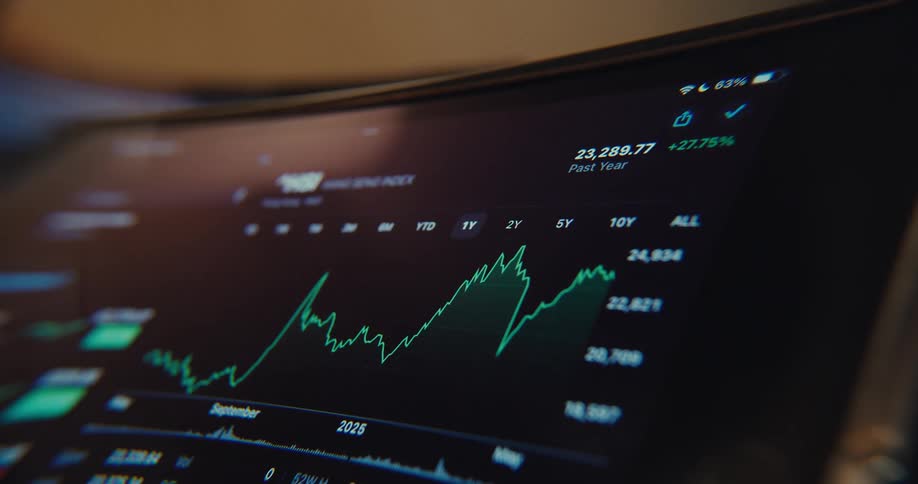
Person scrolls through stock information on a tablet
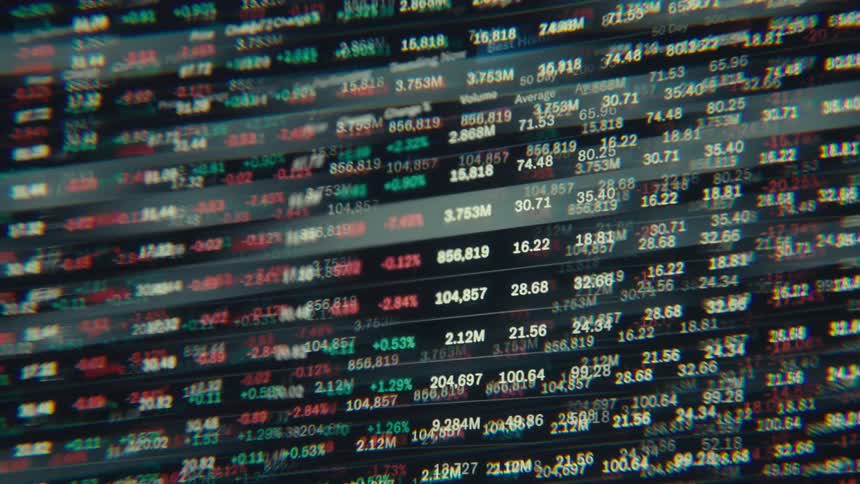
Close up of a flickering digital screen showing a constantly updating stock market ticker with shallow depth of field
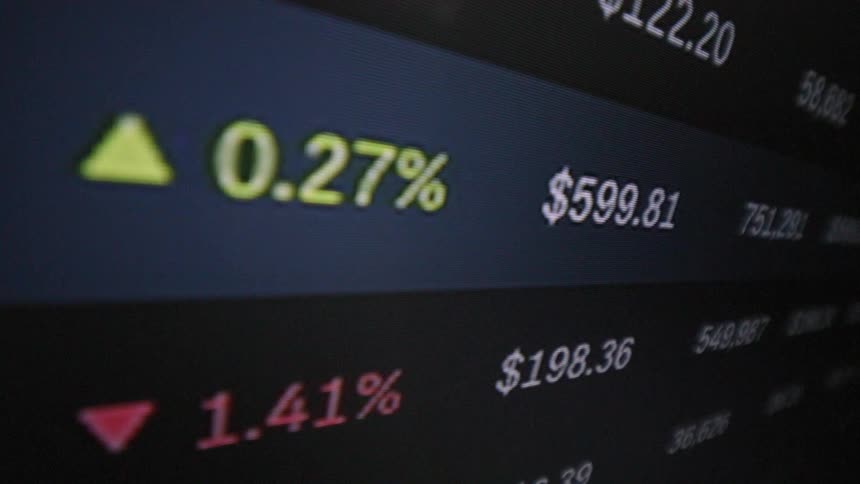
A macro shot of a volatile stock price rapidly increasing on a digital trading screen, showing a significant percentage gain
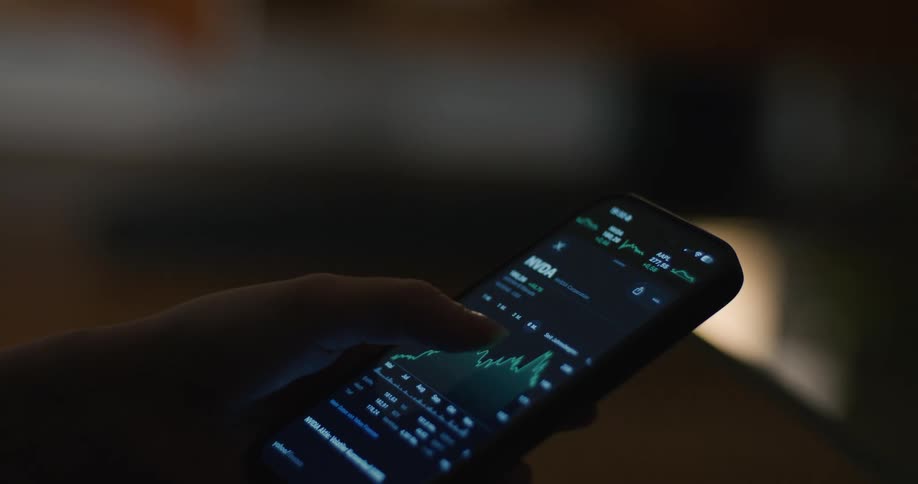
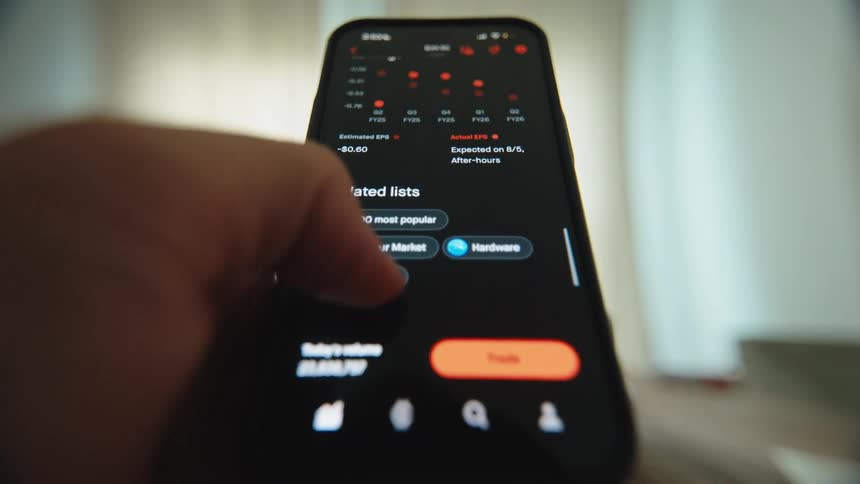
Hand holding a smartphone displaying a financial chart on a lit screen
Screen displays pink and green graph lines on a grid
The numbers scroll very fast on the monitor
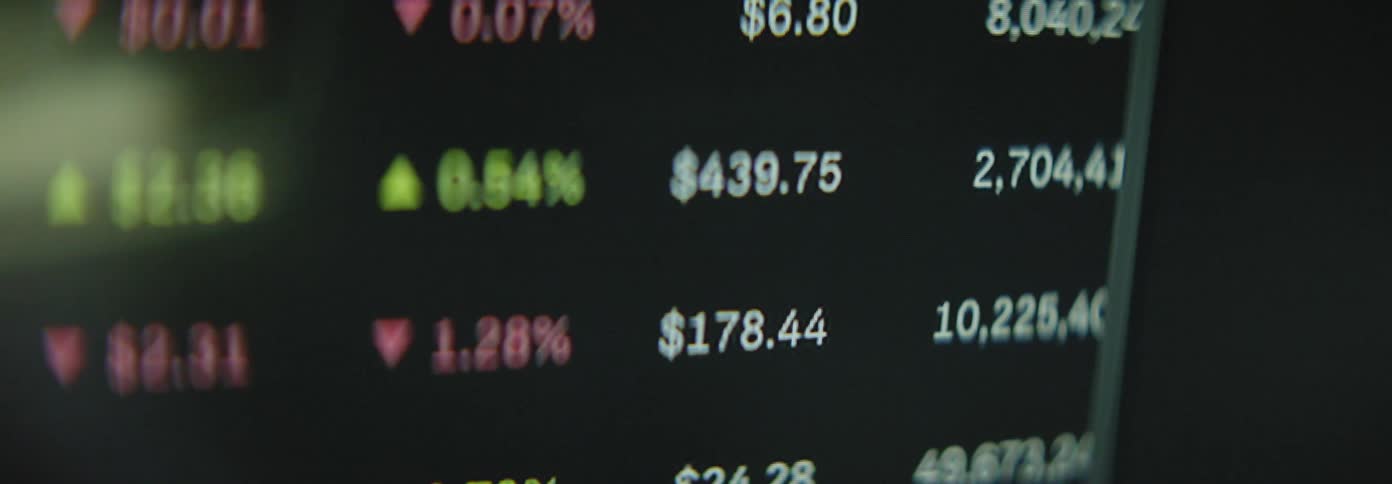
A black screen with white numbers with dollar signs and some numbers are green and some are red
A red arrow moves upwards across the screen as a bar graph animation is forming beneath it presenting statistical data and visualizing the dramatic increase of prices and production costs
A graph screen with pink and green bars
This video features a closeup blurred shot of a digital stock market ticker displaying fluctuating financial numbers and percentages the motion blur and shifting colors of red and green create a sense of fastpaced abstract data movement
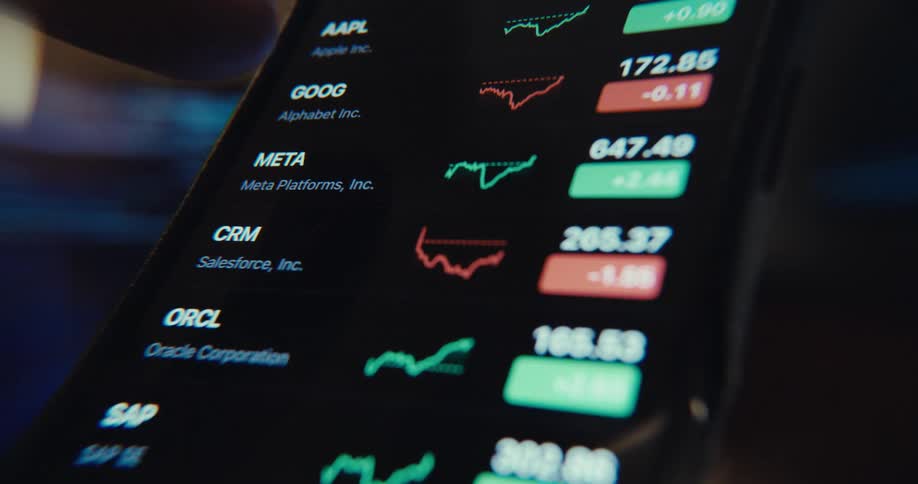
A person is interacting with a financial market app on a smartphone accessing the watchlist menu while viewing stock quotes
A blurry close-up of a digital stock market ticker shows financial data changing rapidly on a blue screen
Gold plated bitcoins on a reflective surface with a computer screen displaying a climbing graph
Green numbers fluctuate rapidly on a dark stock market ticker screen, displaying real-time financial trading data
Information is listed all over the monitor
Closeup of a digital trading graph with fluctuating lines and bars on a screen
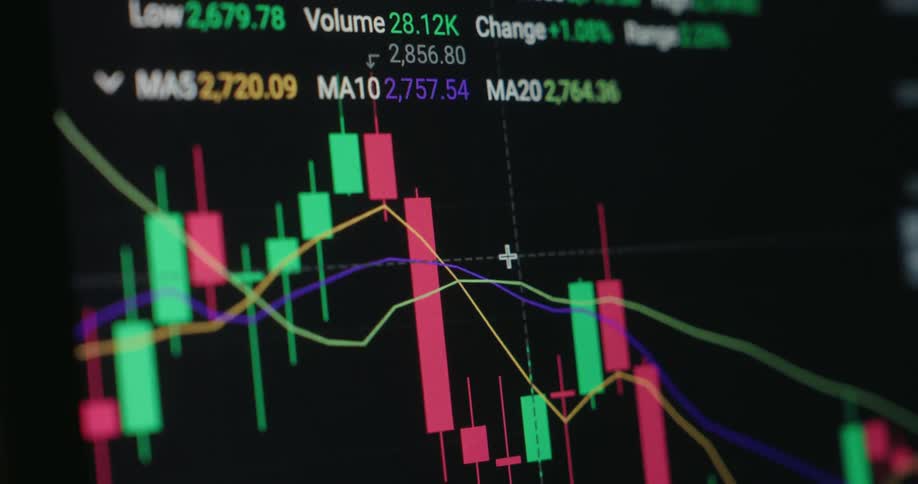
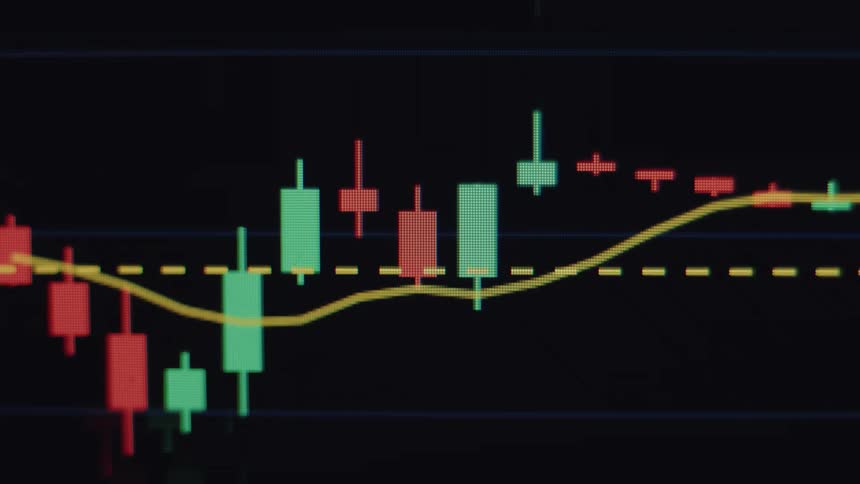
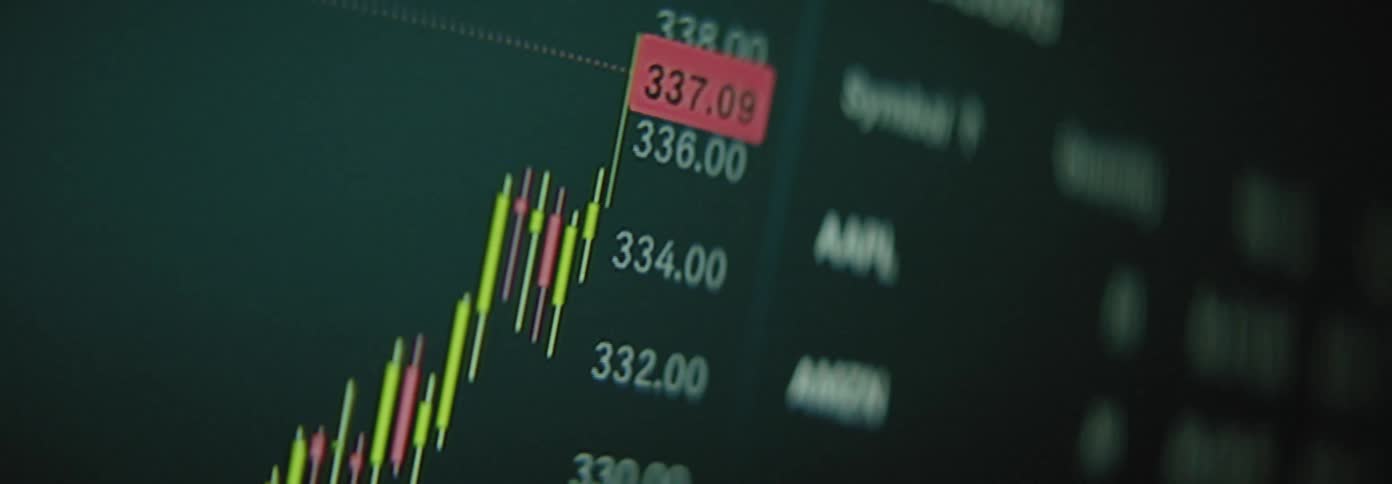
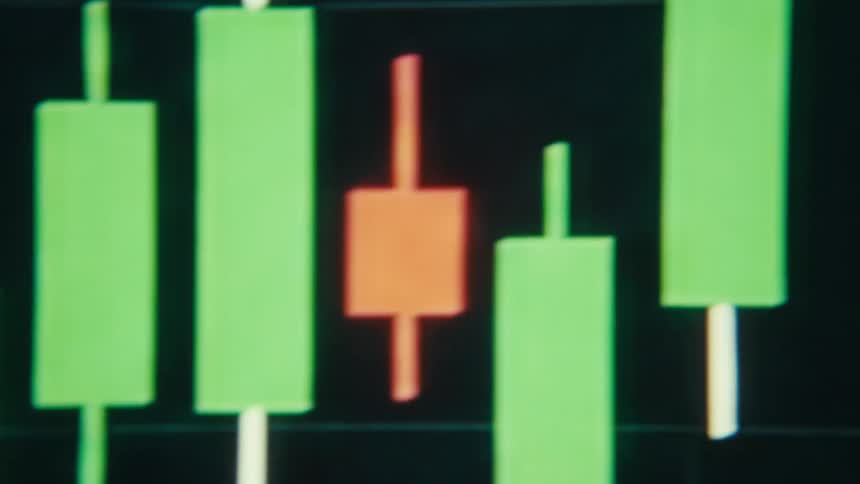
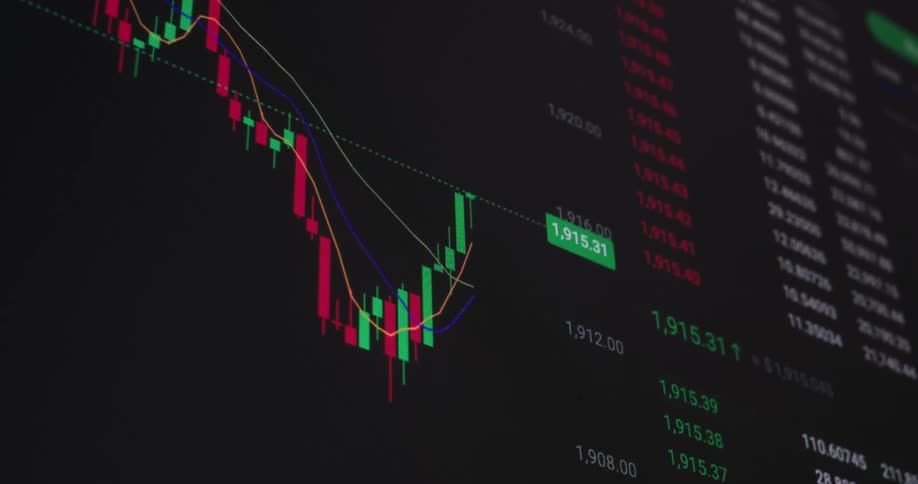
A clip of a screen displaying a digital trading candlesticks
A candlestick chart showing a stock price rising with green candles indicating upward movement while the Dow Jones or MSCI World ETF increases in value and price symbolizing a strong US economy and healthy global financial markets
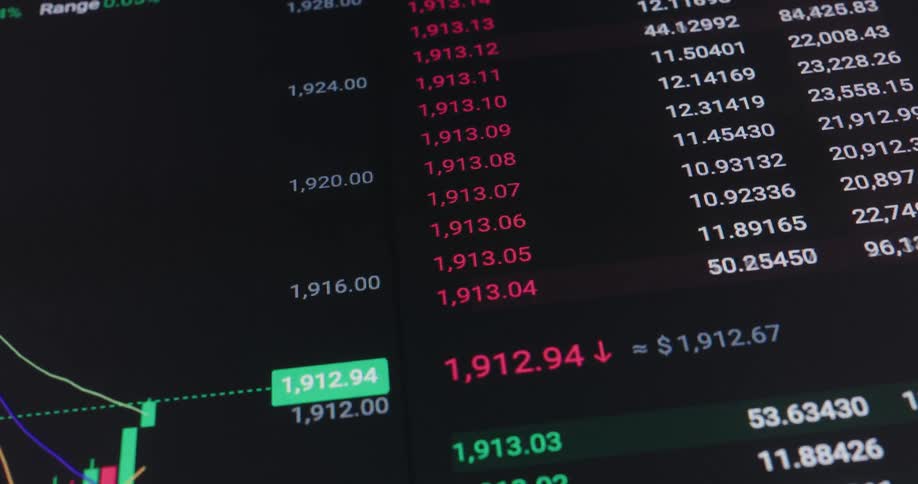
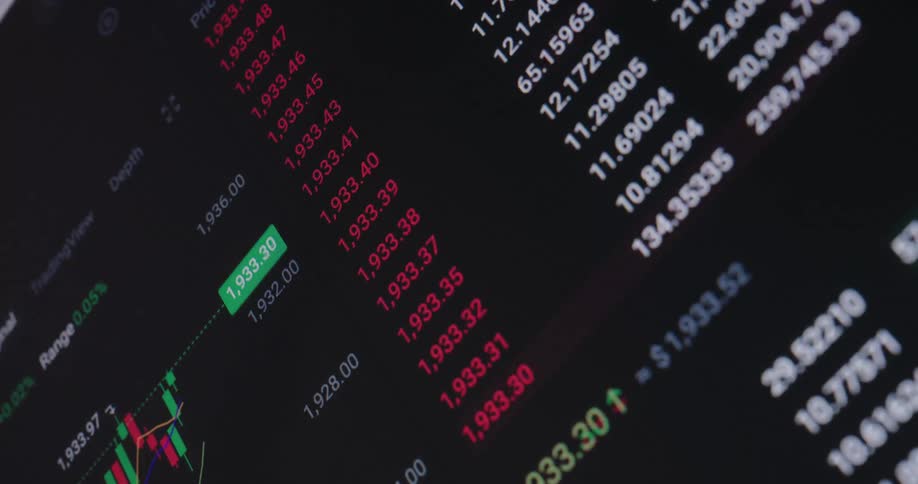
Numbers scrolling next to a chart showing fluctuations in stocks
The graphs change on the computer display
Screen displaying the financial market chart in candles
A close-up shot of a digital stock market ticker with fluctuating prices and changing colors indicating market trends
The bar graph goes up and down across the entire computer screen
A macro close-up of a blue digital stock market or cryptocurrency chart on a screen showing real-time price volatility and fluctuations
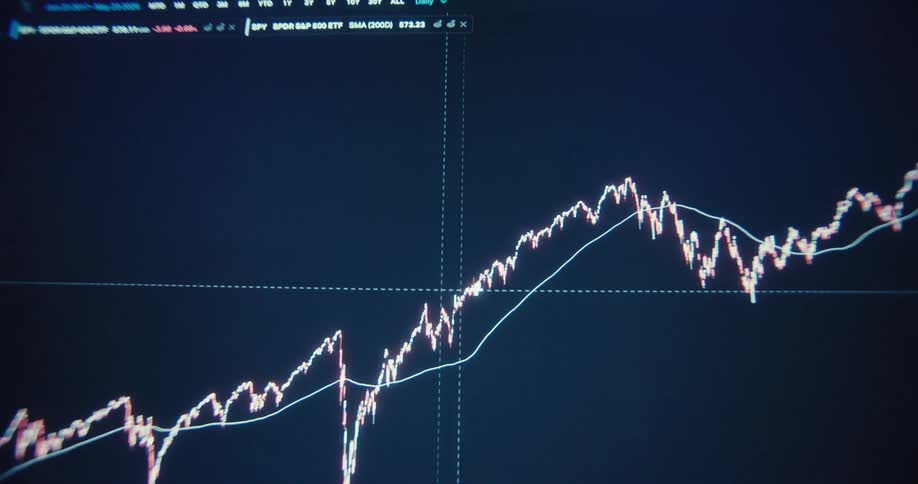
A financial chart shows a volatile market trend with sharp rises and dips over time
Close up of an electronic device screen displaying a trading interface with live moving candlesticks
The stock market ticker displays slight increases and decreases in stock prices
Blue candlestick chart with bars and white trendline arrow displayed on a pixel screen with negative downward price development as symbol for unsuccessful stock trading or bad investment strategies with negative market analysis
A person typing the word stocks on their phone
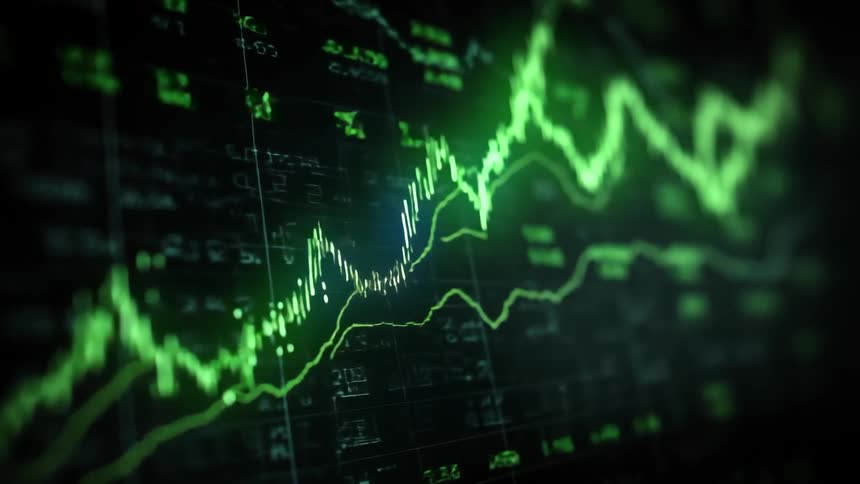
A blurry, abstract close-up of a green stock market chart on a digital screen, with graphs and data showing upward trends and growth
Close up view of a person looking at their phone
A close-up, out-of-focus animated financial chart shows fluctuating stock market data with glowing lines and candlestick patterns
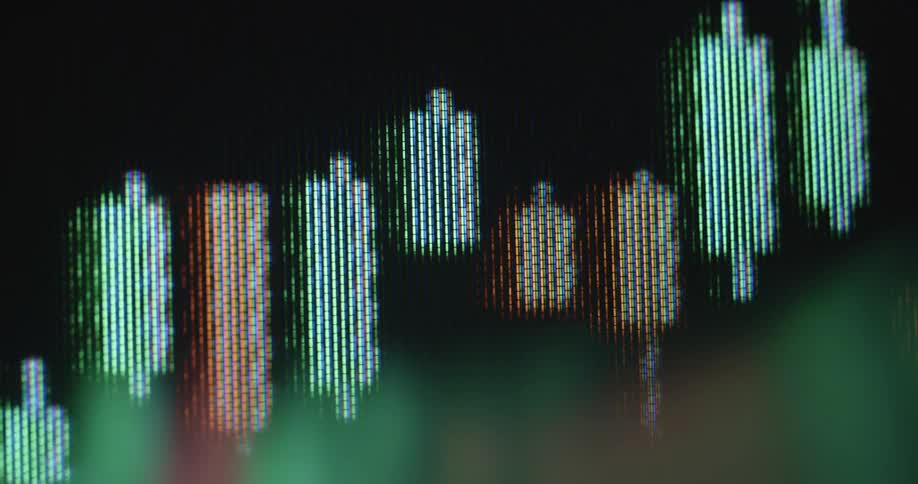
A close-up, shallow depth of field shot of a colorful candlestick graph displaying fluctuating financial market data on a screen
A close-up of a social media share counter rapidly increasing, showing a post going viral in real-time
A computer screen displays fluctuating stock market charts and trading data
Multiple rows of graphs and numbers quickly scroll by on a screen
A green graph on a monitor
A clip of a digital chart
Green line displays digital information against a black background
Close up of a candle diagram stock chart pattern on a digital RGB TV screen consisting of pixels and green and red candles as the graph rises with a positive upward tendency symbolising financial success and share trading
Closeup of a computer screen displaying realtime stock market charts and financial data
An abstract, glowing line graph fluctuates over a blurred candlestick chart, visualizing the volatility of the financial stock market
Pile of physical engraved golden coins with bitcoin logo in front of a screen showing a graph
A detailed, close-up view of a live financial candlestick chart showing market volatility with moving green and red bars
The information on the monitor is shaking and blurry
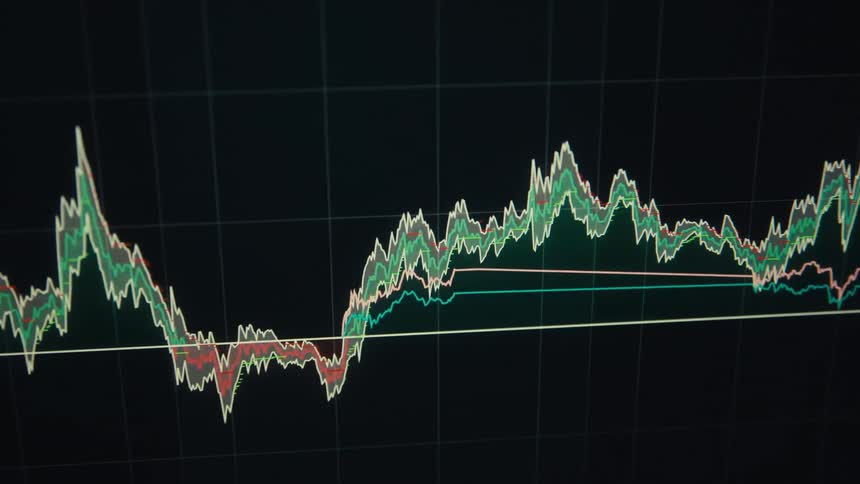
A screen shows a financial chart with multiple lines and bars that fluctuate
A close up of numbers and text animated on a screen
A clip of a digital trading chart
A footage of a digital trading screen
Black swan event hits global economy or financial markets causing crash crisis or meltdown and stocks and shares or other investments collapse into red digits or figures causing panic and massive losses followed by economic recession and bear market
A shot shows a graph on a screen with data lines moving up and down
A user navigates a stock trading application on a smartphone, examining various charts, analyst ratings, and company financial data
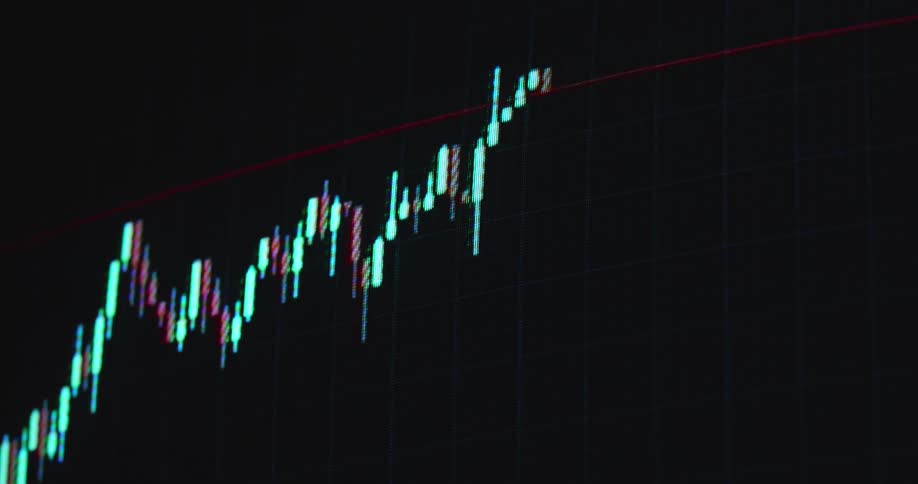
A monitor displays a stock market candlestick chart with green and red candles moving across a dark grid
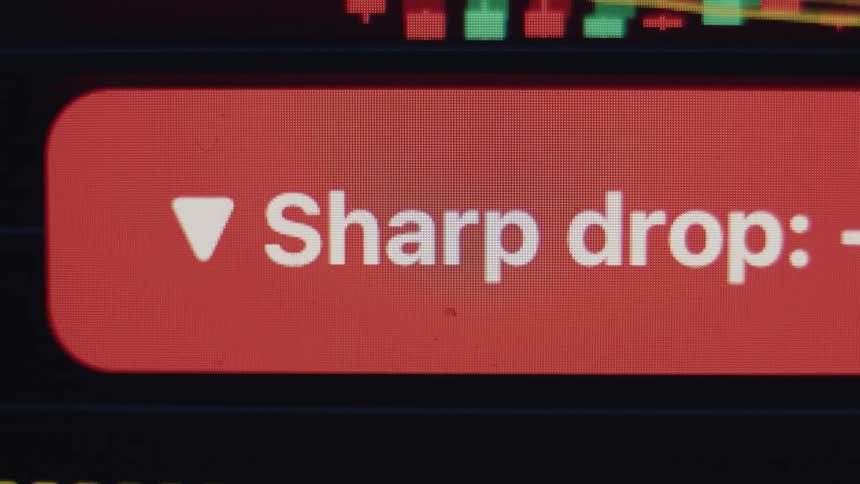
A macro shot of a financial chart on a screen displaying a red 'Sharp drop' notification indicating a market crash
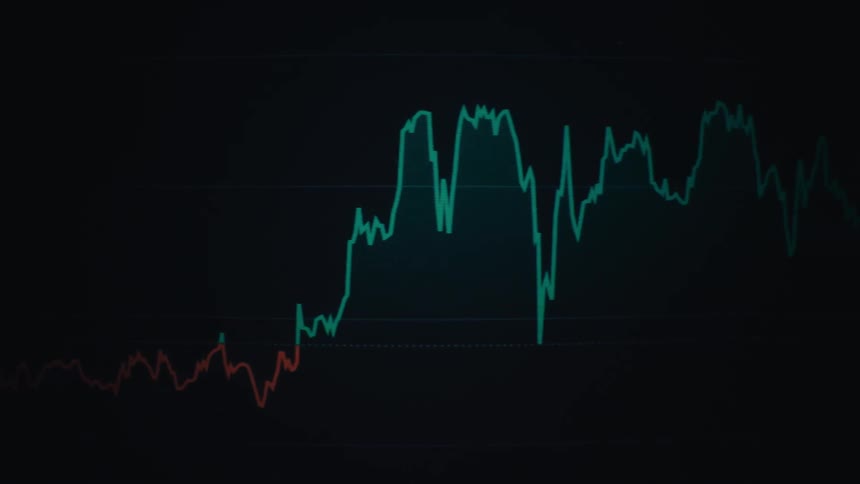
A line graph shows fluctuating stock data shifting into a rising trend against a dark background
A high energy abstract view of a digital trading interface captures glowing green and red candlestick charts and shifting market data lines pulsing through heavy motion blur and vibrant light flares
The numbers on the monitor change frequently
A clip of a screen displaying currency rates
Closeup of a monitor displaying a financial market chart
Negative statistical data presented on a pixelated display device as the bars and arrow trend line follow a declining price development symbolizing a failure of the financial system and recession of the global economy
An abstract, out-of-focus digital stock market display shows red and green numbers rapidly fluctuating
Series of candlestick stock prices displayed on a screen
A colorful, stylized animation of a financial candlestick chart displays market volatility on a digital grid

Need help finding the
right footage?

Have it delivered to your account within 1 business day.

This is Filmsupply

Our StoryOur FilmmakersArticlesFilmsPopular SearchesAll Categories

FM

A family of brands dedicated to empowering the creative.

FILMSUPPLY

Footage licensing for productions

MUSICBED

Music licensing for filmmakers

STILLS

Image licensing for creatives

© 2026 FM LLC.

Privacy PolicyLicense TermsTerms & ConditionsCareers