Musicbed
Filmsupply
Stills
Contact Us(800) 805-6802
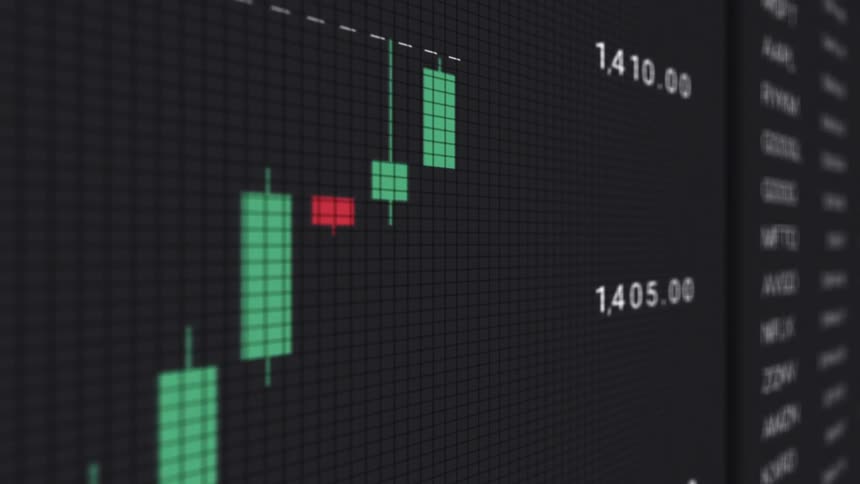
Grid and white lines displayed on a screen with blur effect
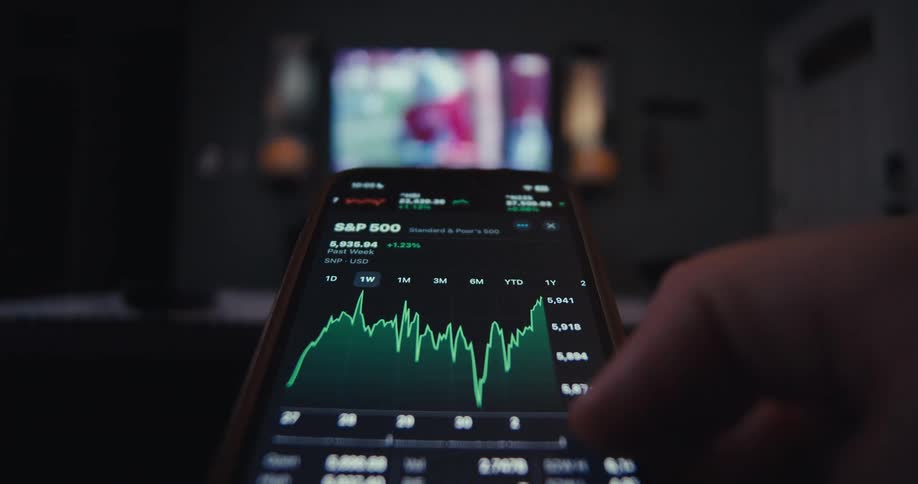
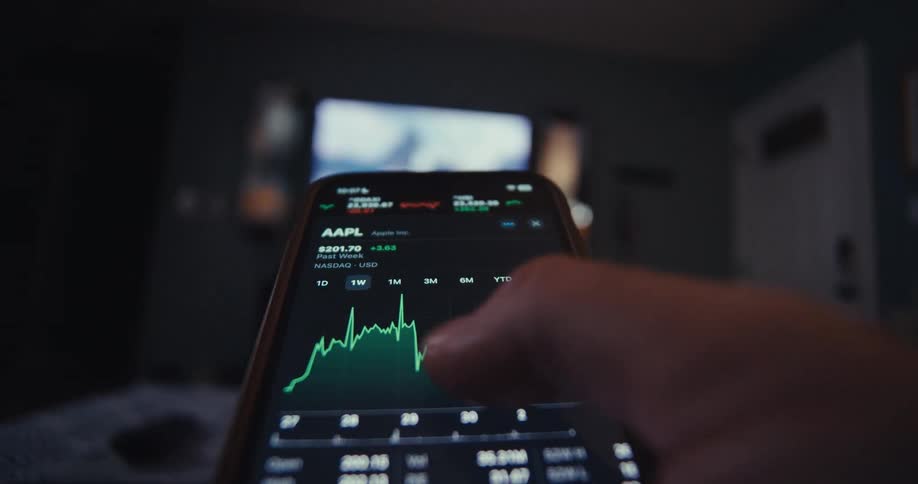
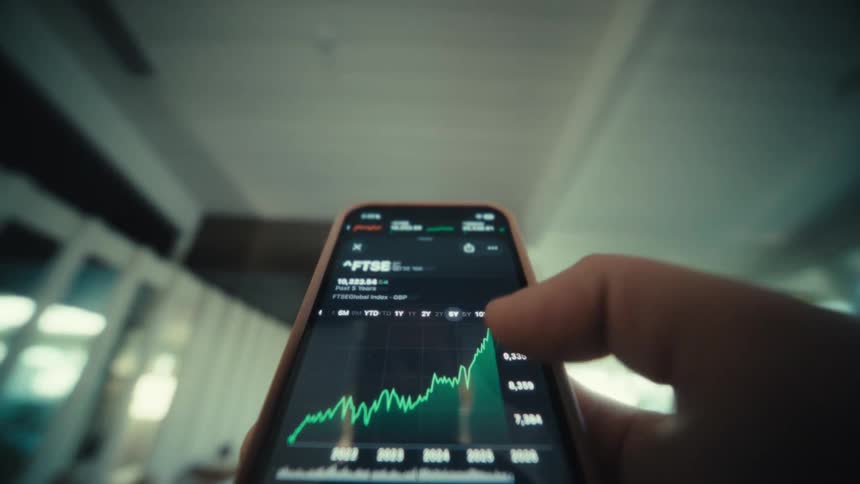
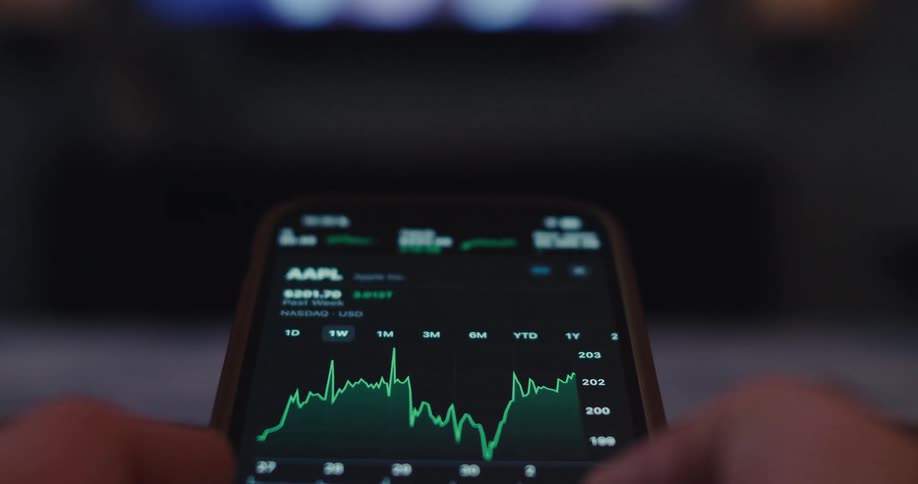
Swiping on the smartphone
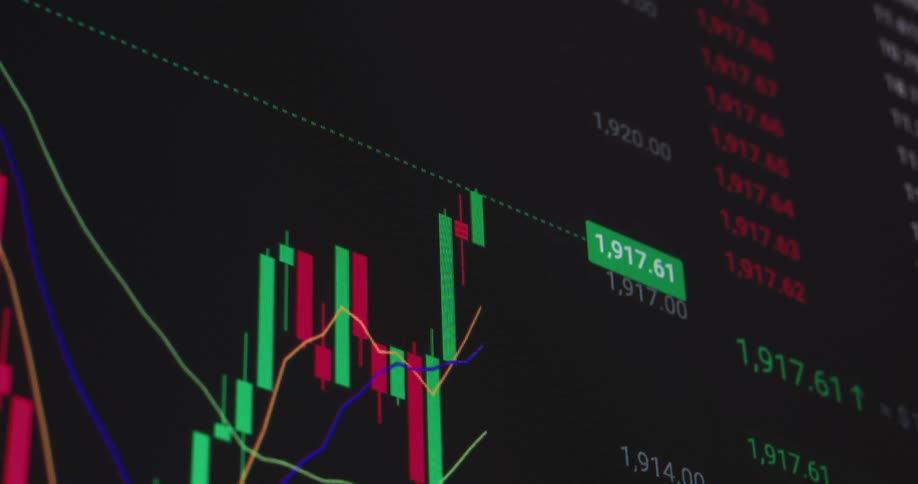
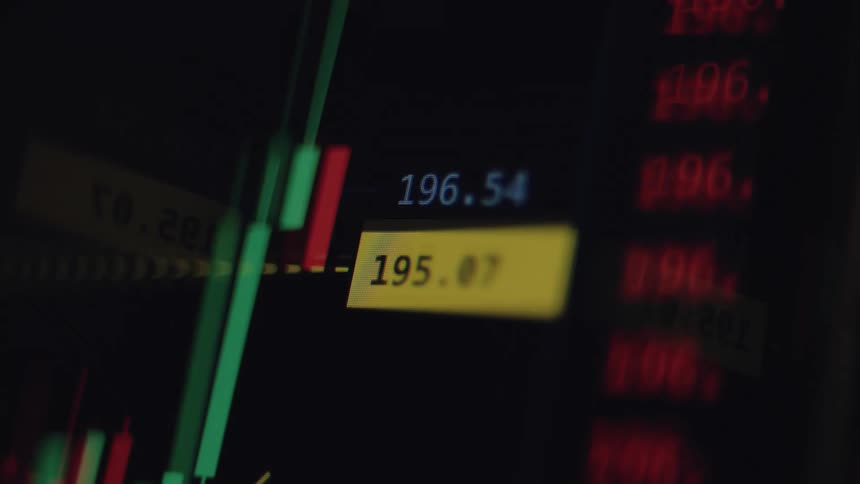
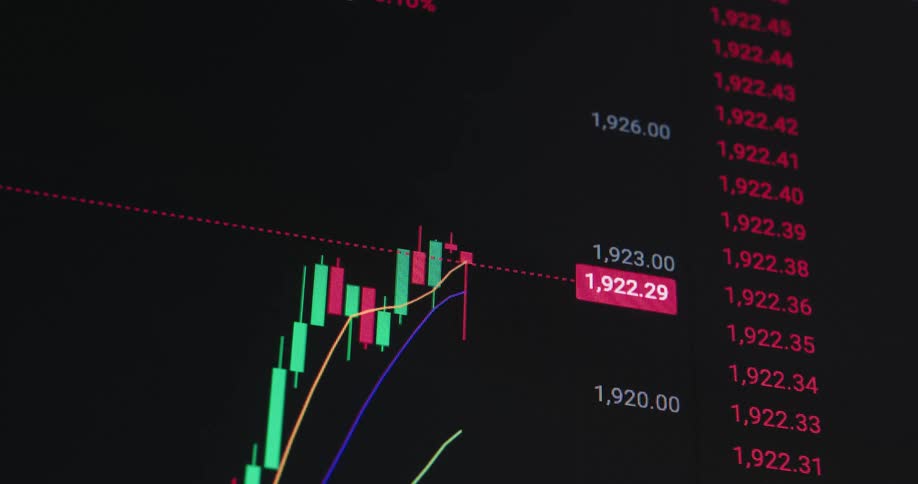
Handheld macro close-up of bullish financial market chart or candlestick trading graph on black screen displaying the UI of stock or crypto broker application or platform as the price surges and the value of the asset increases during investment bull run
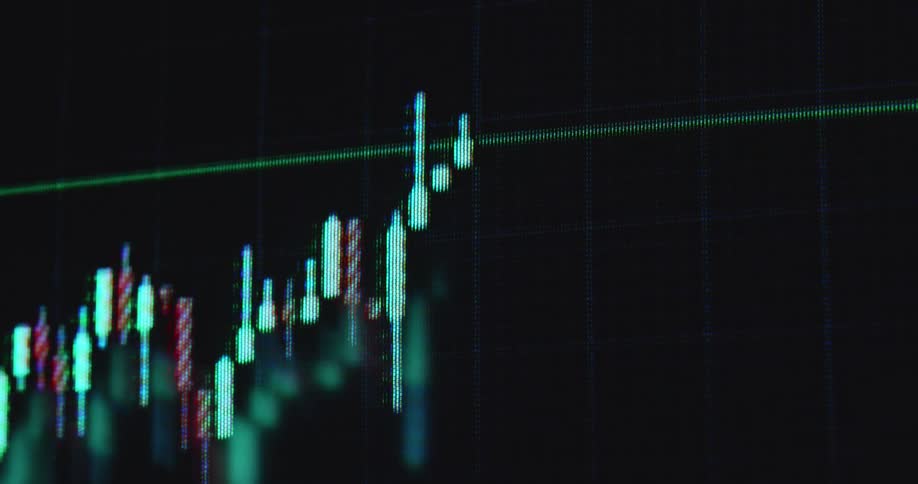
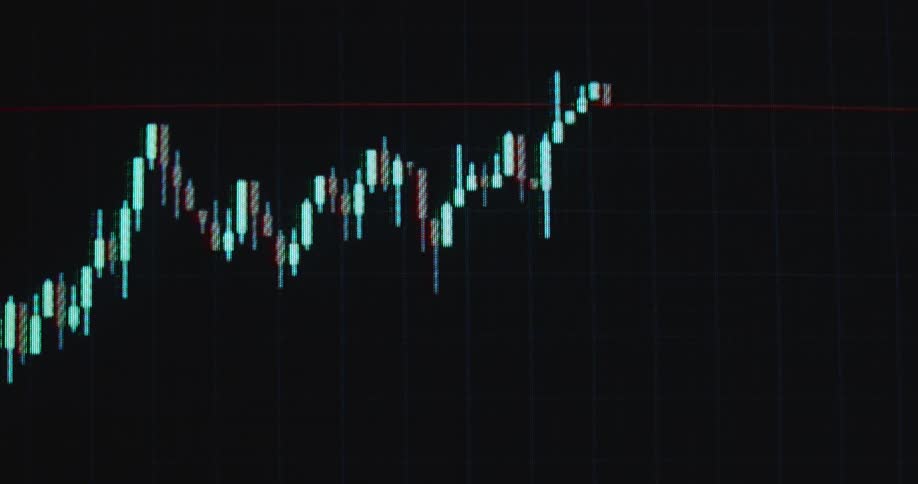
Red and neon green glowing candles create a bullish candlestick chart pattern with upward movement and positive price development as symbol for a healthy commodity or equity market or profitable stock or crypto trades via online broker app
Close up of an electronic device screen displaying a trading interface with live moving candlesticks
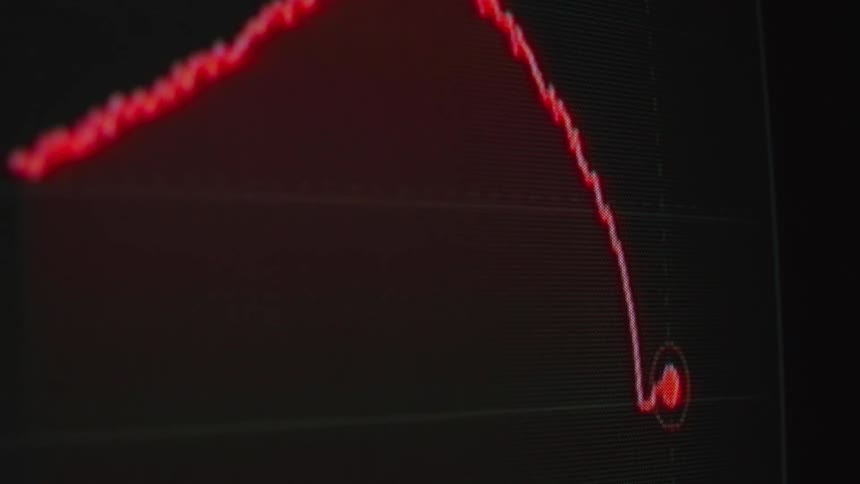
Volatile candlestick chart rises and falls to bottom of screen due to dramatic market crash or collapse causing panic and global economic recession providing great trading opportunities for day-traders that view volatility as opportunity and buy the dip
A pixelated smartphone or display device screen or monitor shows the user interface of a finance app or online broker and trading platform for buying and selling stocks and crypto currencies such as Bitcoin or ETH as the trading chart moves up
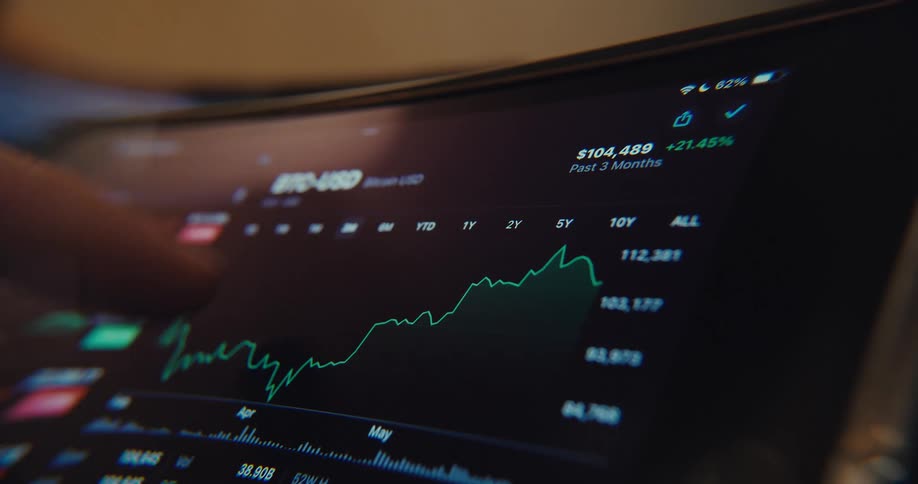
A finger points at a tablet screen displaying a fluctuating stock market graph
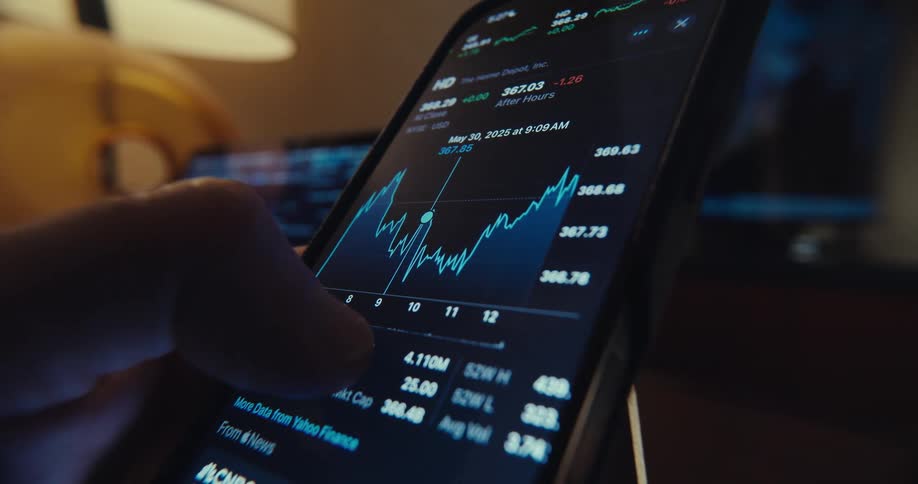
Close up of a person navigating a trading interface on a mobile phone application in a living room
Locked off macro shot with no camera movement of red and green candles creating candlestick chart of a bearish market pattern with drastic crash and recession with massive financial losses as the trading software is running on the computer
Numbers grow on the graph displayed
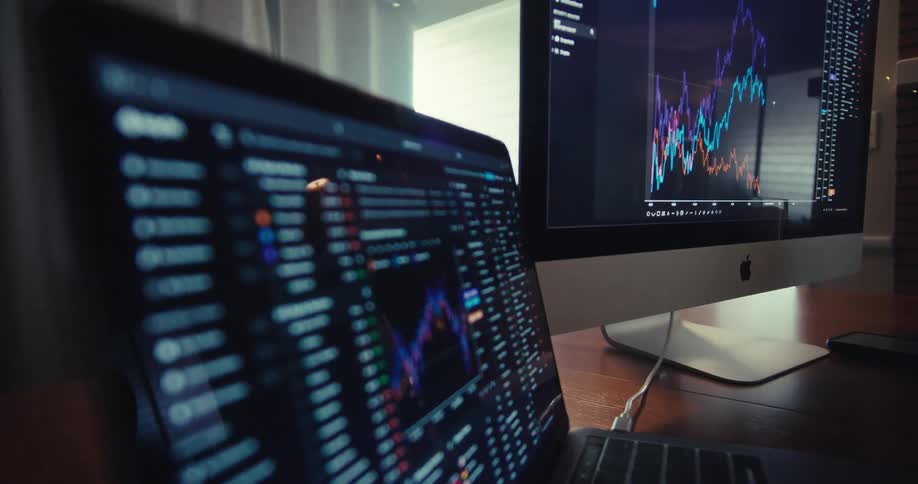
Computer monitors on a desk are displaying graphs
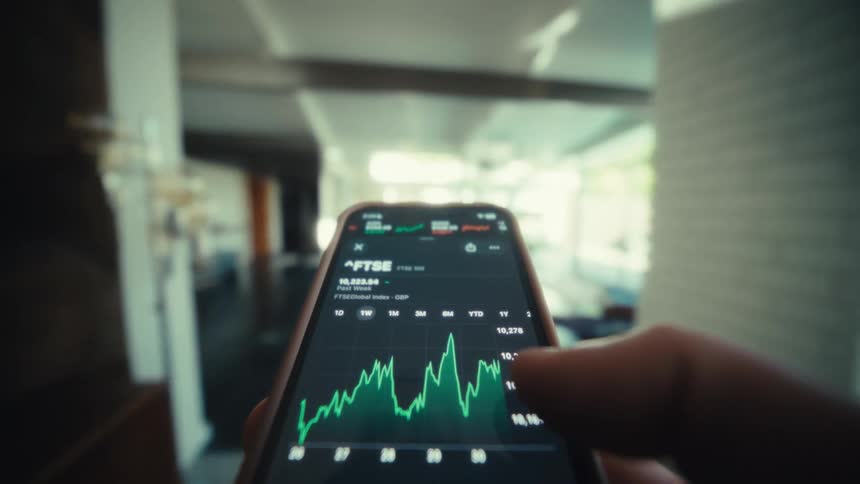
A close view shows a person holding a smartphone and scrolling through financial stock market charts while walking through a bright modern house with large windows
Computer monitor showing graphs of stocks available for trade
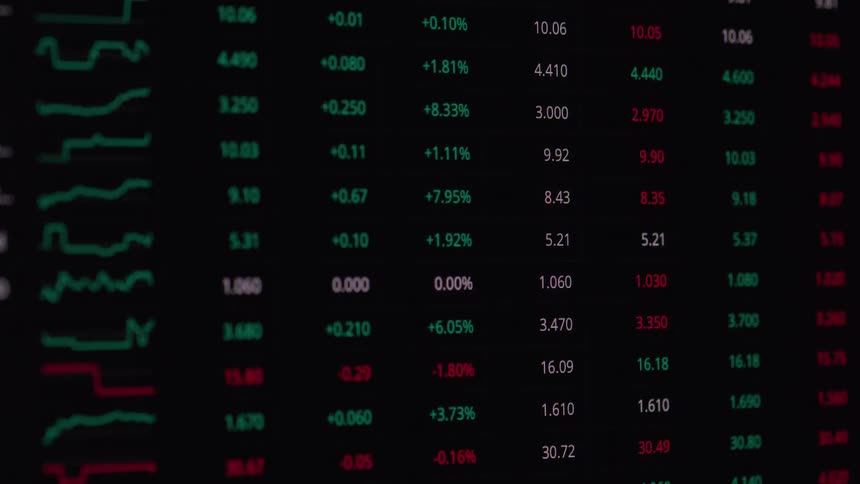
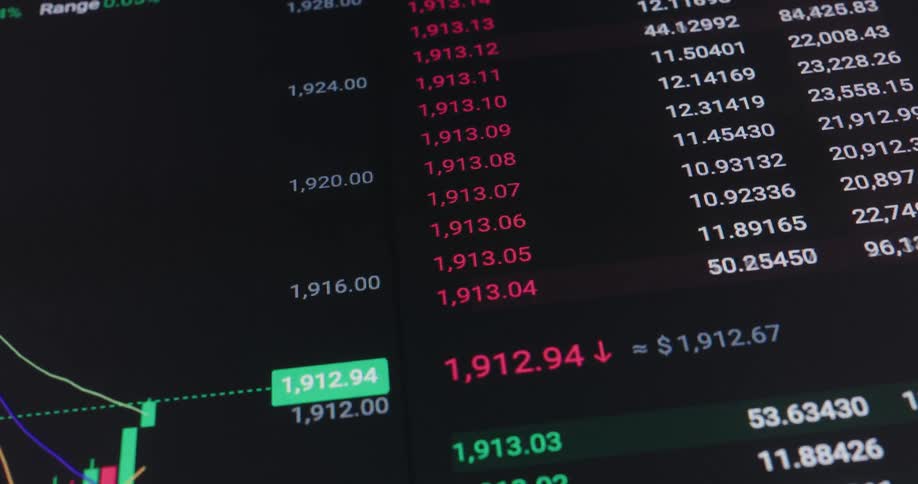
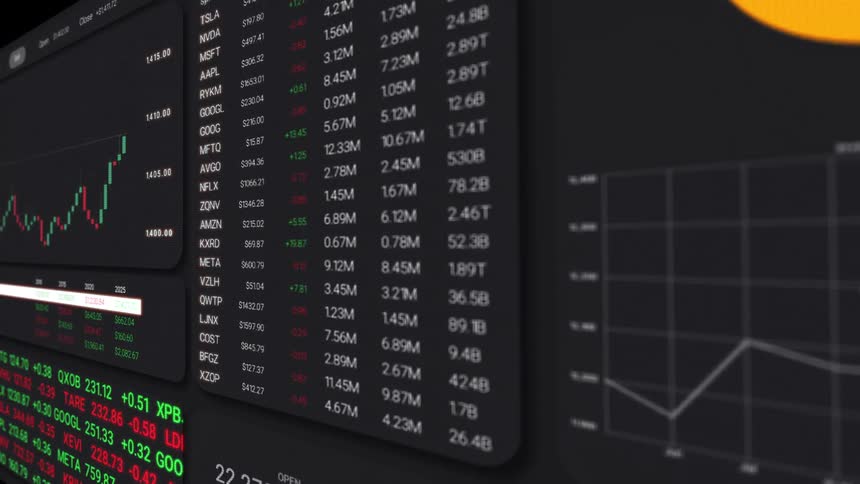
Close up of a device screen displaying a trading interface table scrolled through
A stylus points at colorful fluctuating line graphs displayed on a digital screen suggesting data analysis or market tracking
Vibrant blue and orange neon lines move across a dark digital screen with a grid pattern and soft light leaks creating a modern and tech focused background
Multiple rows of graphs and numbers quickly scroll by on a screen
Hand using stock exchange app on a smartphone
Finger points to a point on a line chart showing value fluctuations
The monitor is showing stock activity
Dramatic macro close up with shaky camera movement of a screen showing animated financial trading chart or business statistic with negative outlook prediction or development in neon green retro colors
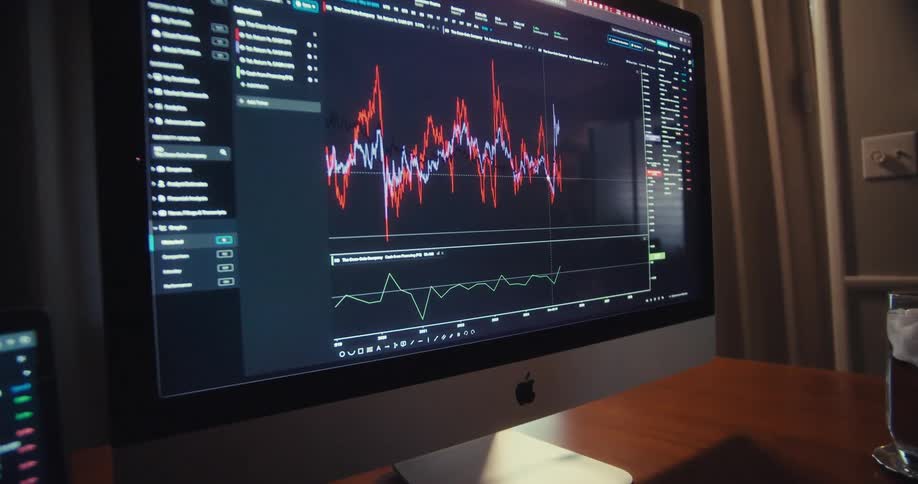
A price chart of stocks is displayed on a computer screen
A close-up of a digital candlestick chart on a screen shows financial data fluctuating in real-time
Extreme macro close-up of a pixelated candle of candlestick trading chart changing between the colors green and red as symbol for volatility and uncertainty in the financial markets while the price of the stock or cryptocurrency rises and falls
Lines on a electrocardiogram monitor show peaks and valleys
A graph runs across the monitor
Walking down a hall while scrolling on a phone
Charts of currencies rising and falling
A close-up of a rising stock market graph on a digital display showing financial growth
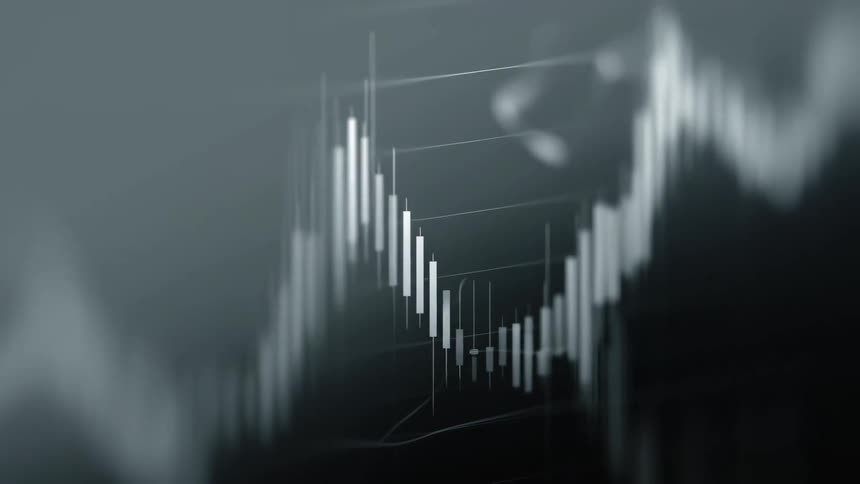
Candlestick chart against a gray background
Numbers scrolling next to a chart showing fluctuations in stocks
A closeup view of a stock market chart with red and green candlesticks fluctuating
A chart is moving on the screen
Trend line drawing red or green trading candles on monitor creating a candle stick chart pattern with upward tendency and great price development showing a successful trade with good performance and profit on black screen with grid
Close up of a blurry device screen displaying a trading interface in green over a dark background
Screen displaying chart and stock market quotes in real time
A close-up of a digital stock market chart shows a line graph rising in blue before turning red and crashing downwards
A close-up of a digital stock market graph showing a blue bull run followed by a dramatic bearish crash into the red
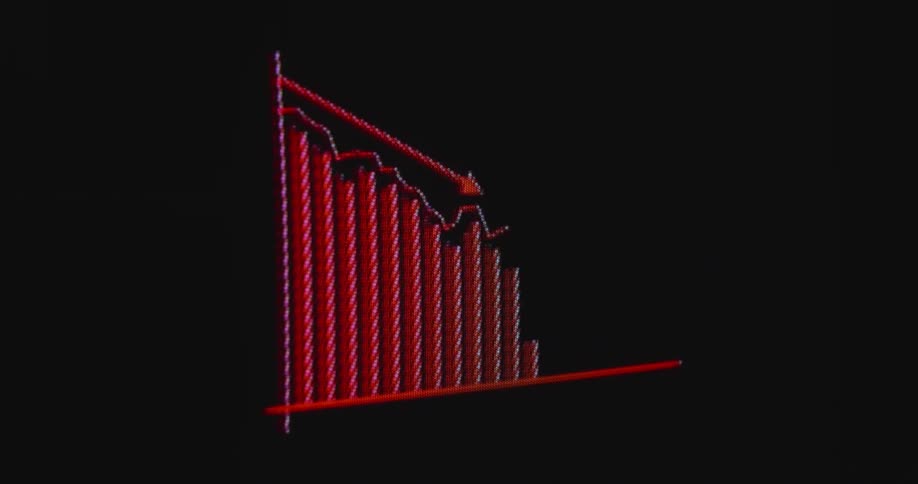
The animated data graph steadily goes down with a negative trend or declining tendency on the pixelated monitor presenting a financial or business statistic during a cooperate presentation with a holographic overlay or effect
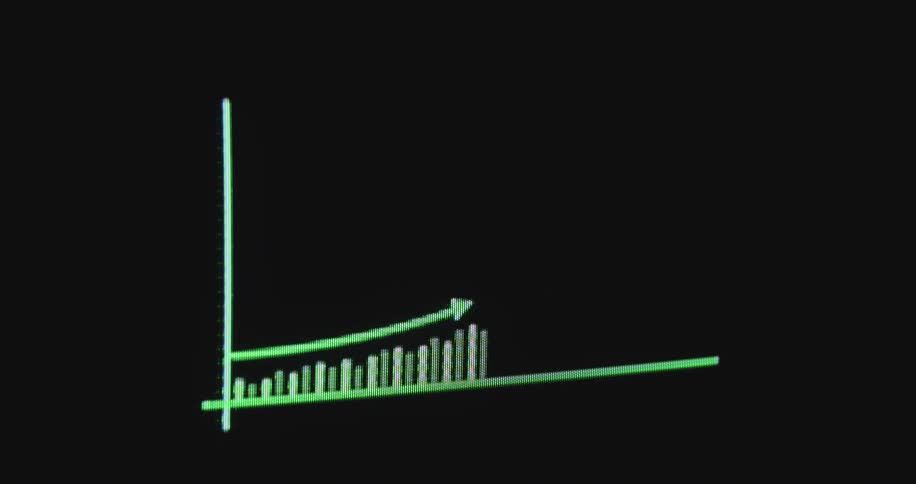
A retro-style green bar chart on a black computer screen shows exponential growth, with an upward-pointing arrow
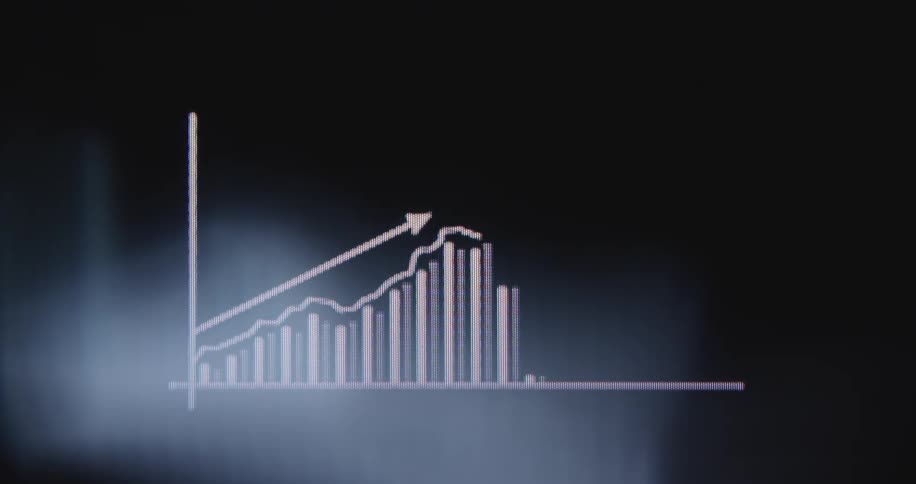
A simple animated bar and line graph illustrates positive growth and increasing profits on a black digital screen
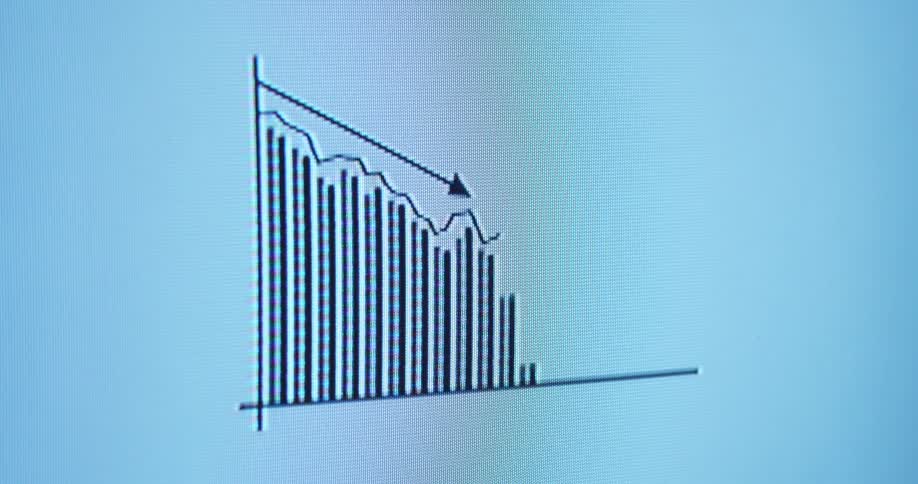
Extreme close-up macro shot of a blue financial bar graph on a computer screen with a white arrow indicating a downward trend
Close up of man trading on a laptop and desktop computer in a room
A close-up of a digital stock market chart displays real-time price fluctuations with candlestick patterns on a screen
A macro shot of a financial chart on a screen displaying a red 'Sharp drop' notification indicating a market crash
A blurry stock line graph slopes downward against a blue background
The camera captures an extreme closeup of a screen as a graph of a share index traded at Wall Street or on an online stock exchange app is plotted while going up and down or falling or rising and changing between positive green and negative red
Bullish and bearish financial market candle chart
A simple digital bar chart on a black screen animates to show progressive growth and success
Adult man wearing glasses sitting and looking with a nervous facial expression at a financial graph on a screen indoors
A macro shot of a digital screen displays the volatile movement of stock market prices
Close-up macro of a financial bar graph on a digital screen with a white arrow pointing down, indicating a downward trend, recession, or stock market crash
An animated blue bar chart with a glowing effect illustrates increasing data and positive growth on a digital screen
Red and blue candle chart
Person scrolls through stock information on a smartphone
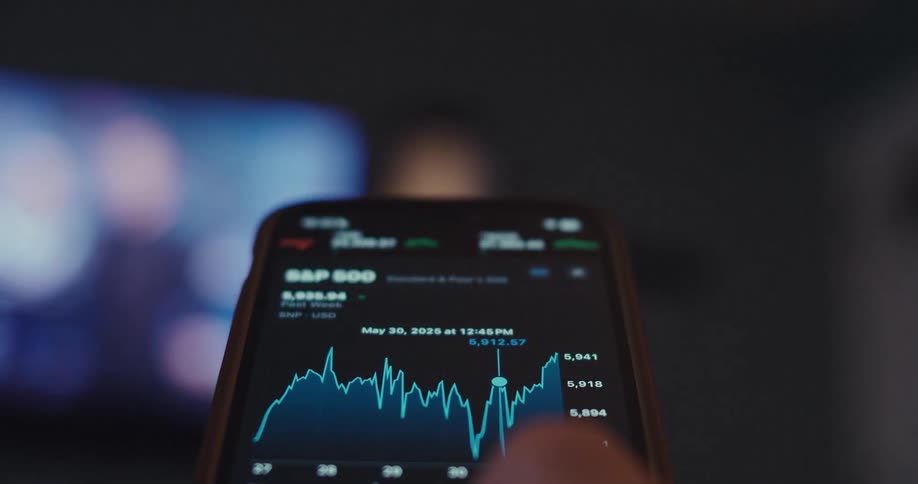
A finger scrolls through a live stock chart on a smartphone screen
Candlestick financial chart on a screen indoors
Dashboard showing ndx and spx indices with numerical values
A close-up of a live stock market candlestick chart displays fluctuating financial data on a digital screen
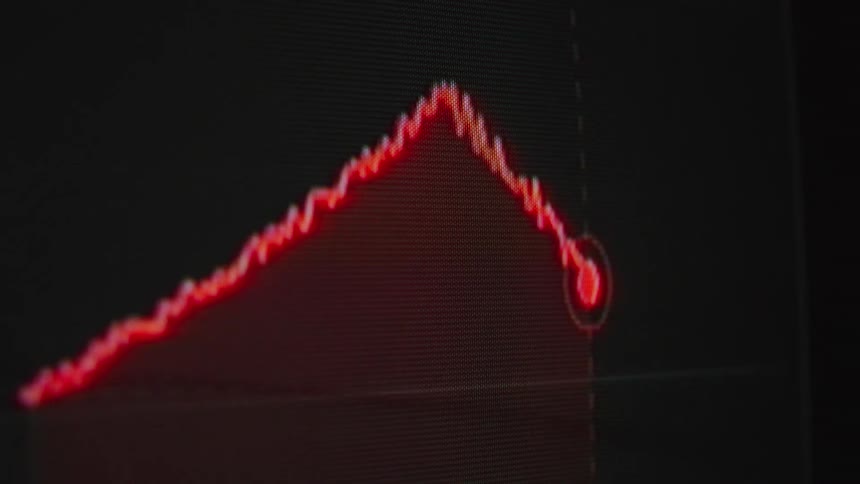
Pixelated computer screen showing animated data in red trend line graph with negative downward movement symbolizing the stock market crash from 1987 or any other financial crisis causing a meltdown of the global economy
The line graph is moving on the screen
A person is looking at stock information on their phone

Need help finding the
right footage?

Have it delivered to your account within 1 business day.

This is Filmsupply

Our StoryOur FilmmakersArticlesFilmsPopular SearchesAll Categories

FM

A family of brands dedicated to empowering the creative.

FILMSUPPLY

Footage licensing for productions

MUSICBED

Music licensing for filmmakers

STILLS

Image licensing for creatives

© 2026 FM LLC.

Privacy PolicyLicense TermsTerms & ConditionsCareers