Musicbed
Filmsupply
Stills
Contact Us(800) 805-6802
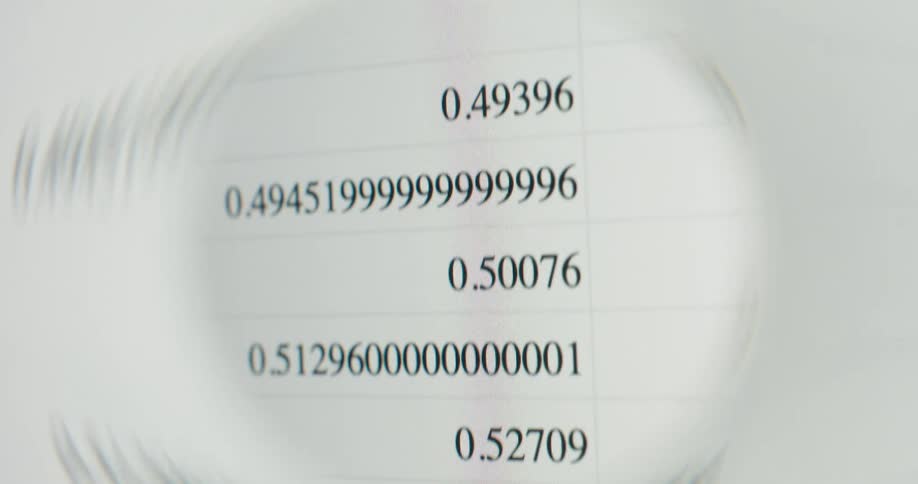
A magnifying glass moves down a column of decimal numbers on a digital screen, suggesting data analysis or scrutiny
A close-up of a digital stock market chart shows a line graph rising in blue before turning red and crashing downwards
A graph of orange lines
Macro close up of a red arrow that moves up across a pixelated screen as a financial trading graph is building beneath it symbolizing economic growth or rising stock prices or crypto currency trading as successful investment
Extreme close-up of a digital screen displaying a bar graph with a downward-trending arrow, indicating a financial decline or market crash
A digital percentage counter rapidly increases from one to ninety-nine percent before a blue checkmark confirms completion
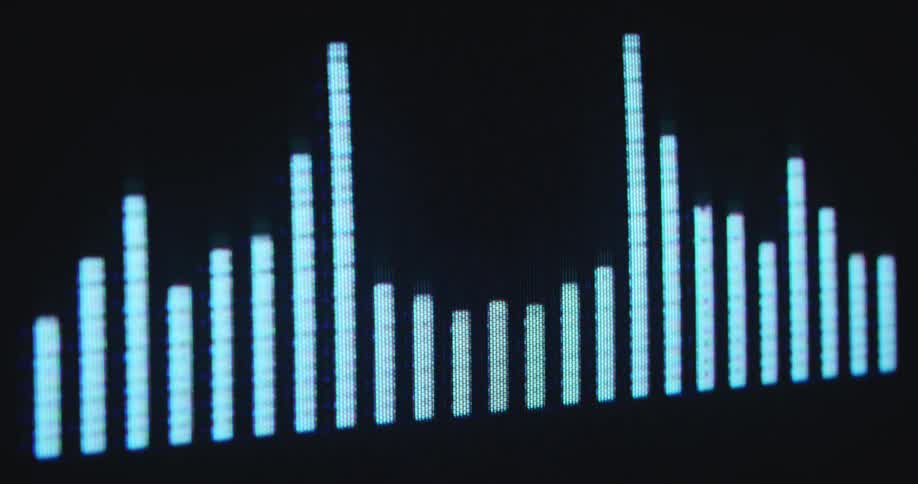
Sound bars of a digital EQ or Equalizer rise and fall on a screen as a symbol or visualization for sound in the digital world of online streaming platforms and audio books played on display devices such as computers or smartphones
An animated green bar chart on a black screen illustrates a steady decline with a downward-pointing arrow
An abstract, out-of-focus animation of a digital stock market chart shows fluctuating data and glowing trend lines
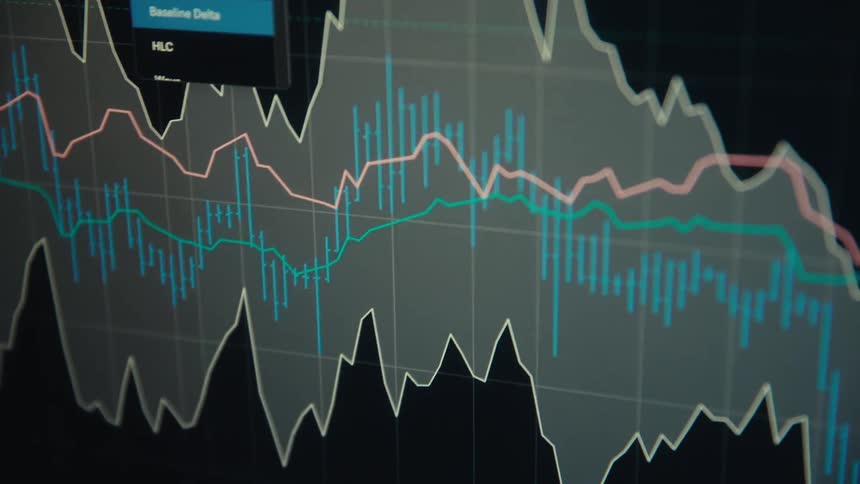
Closeup of a digital trading graph with fluctuating lines and bars on a screen
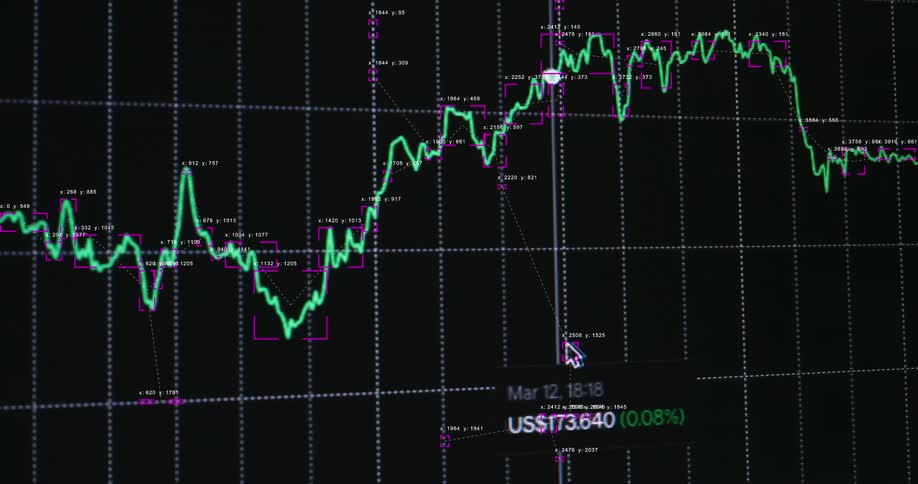
A close-up of a dynamic digital stock market chart shows the fluctuating value of an asset over time with technical data analysis
Multiple data points at different values are continuously plotted next to a candle chart of a stock or crypto currency trading graph in a finance application or app on a dark pixelated computer screen
A display showing charts of a stock price
A close-up of a red, pixelated bar chart with an upward trending arrow animates on a black digital screen, indicating positive growth
Close-up of an animated financial bar chart on a screen showing a downward trend
A close-up of a digital screen showing an animated financial bar graph with increasing monetary values
Overlapping line and candlestick charts display intense financial fluctuations
A finger scrolling on aglowing market chart on a screenthat shows fluctuating prices with sharp dips and recoveries
A blurry, abstract close-up of a green stock market chart on a digital screen, with graphs and data showing upward trends and growth
Digital quotation table showing values percentage changes and market charts
Graph of the price of a currency
An animated, colorful bar chart on a digital screen displays fluctuating business data and analytics over several months
Charts are flashing on the computer screen
A clip of a digital chart
A minimalist animated bar graph on a dark screen shows a steady decline in values with a downward arrow
A close-up macro view of a financial candlestick chart with red and green bars fluctuating on a digital screen
Close-up of a digital screen displaying a colorful animated bar graph for business analytics and financial reporting
A stock price chart is displayed on a computer screen
Close up of pixelated investment graph going up during an upward trend as a symbol for rising stock market and financial freedom and success during economic growth on an old TV or computer screen showing a finance app
Multiple lines and a candlestick chart occupy the same graph on a digital screen as a selection is made
A magnifying glass scans a column of decimal numbers on a spreadsheet, representing data analysis or financial information
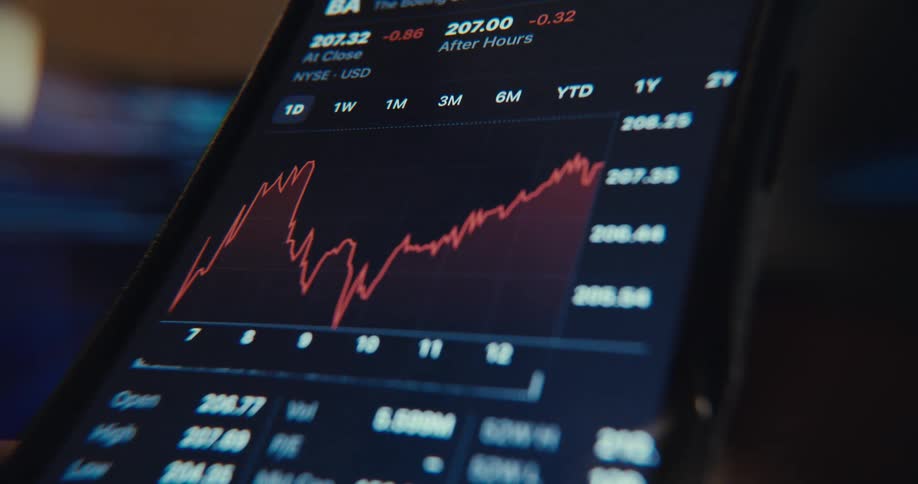
A smartphone screen displays various stock market charts rapidly changing between green upward trend and red downward trend graphs for different companies and indices
People walk by the line graph on the monitor
A retro animated bar graph on a vintage computer screen shows an upward trend of growth and success
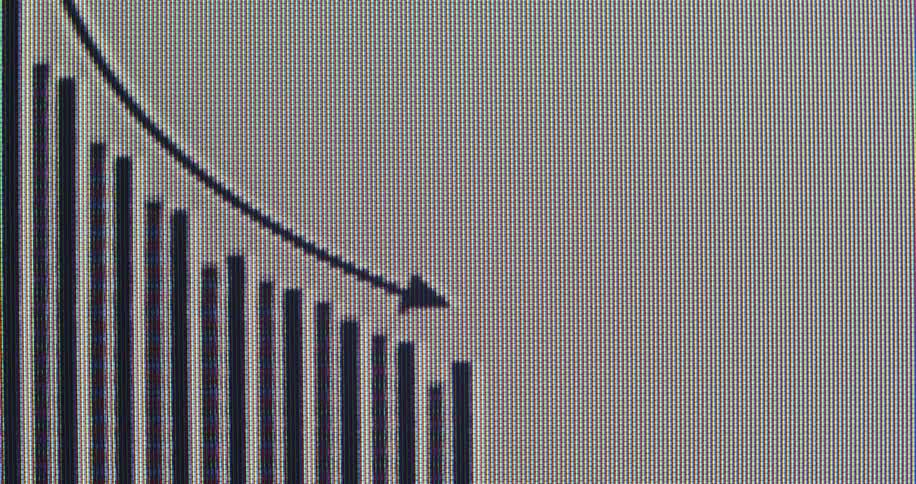
Extreme macro view of a digital screen with RGB pixels shows a black line graph with a downward pointing arrow overlaying vertical black bar charts representing a stock market crash or economic downturn with negative trend
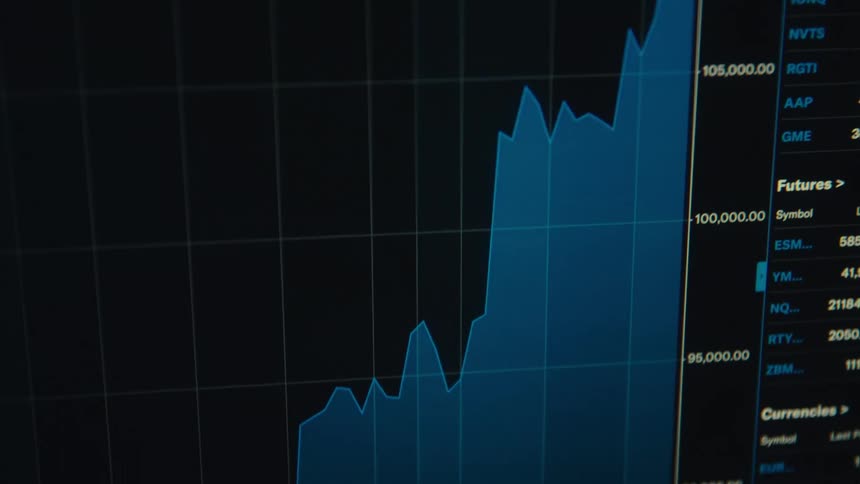
A macro close-up of a blue digital stock market or cryptocurrency chart on a screen showing real-time price volatility and fluctuations
Extreme macro close-up of a green colored audio graph with red tips as a symbol for a loud song or noise with high frequencies as a sensory impression for the listener of the live music
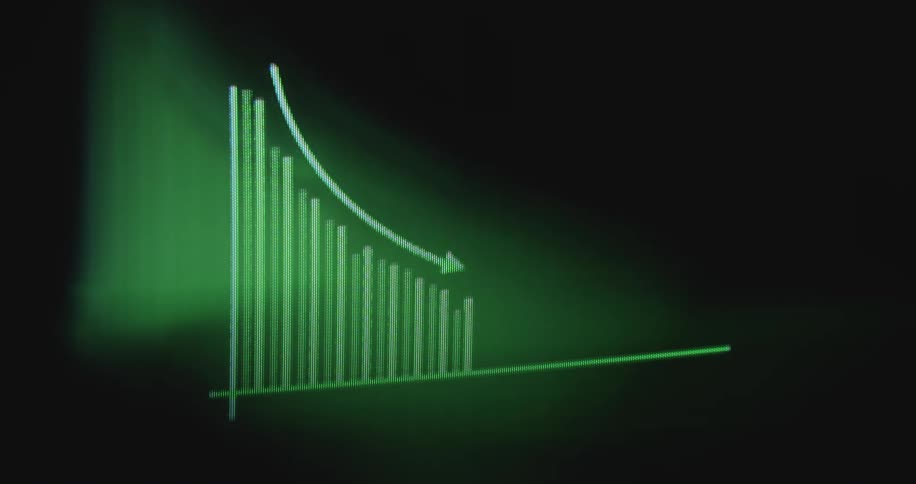
A neon green coloured sales chart or finance trading graph showing a downward trend symbolising a financial meltdown or a market crash or collapse caused by economic uncertainties and fear of global recession
A line on a graph moves up and down as it travels across a screen
A macro shot of a financial trading application displaying a live order book with changing figures
A close view of professional documents featuring blue and green line graphs as well as circular data charts and financial statistics on white paper as the camera moves across the pages
A candle diagram graph plots an array of data on a pixel screen with numbers representing rising and falling real estate prices or changes in the stock market or crypto currency finance sector
Line graphs and numbers move across the monitor
The financial markets get hit by a black swan event causing a massive crash or recession leading to a global economic crisis and great depression symbolized by a trading chart or graph that sharply falls into the red digits with dramatic downward movement
The animated data graph steadily goes down with a negative trend or declining tendency on the pixelated monitor presenting a financial or business statistic during a cooperate presentation with a holographic overlay or effect
A close-up of a blue digital line graph showing fluctuating real-time data on a dark screen
A close-up, out-of-focus shot of a digital stock market ticker screen shows fluctuating prices and trading volume
A graph of fluctuating stock data displays on a dark digital screen
Unrecognisable coding or programming text in an encrypted computer language such as HTML or Javascript is automatically appearing on a pixelated 90s computer terminal display device during system startup or booting process
Digital table with market numbers and percentages in green and red
A screen shows a financial chart with multiple lines and bars that fluctuate
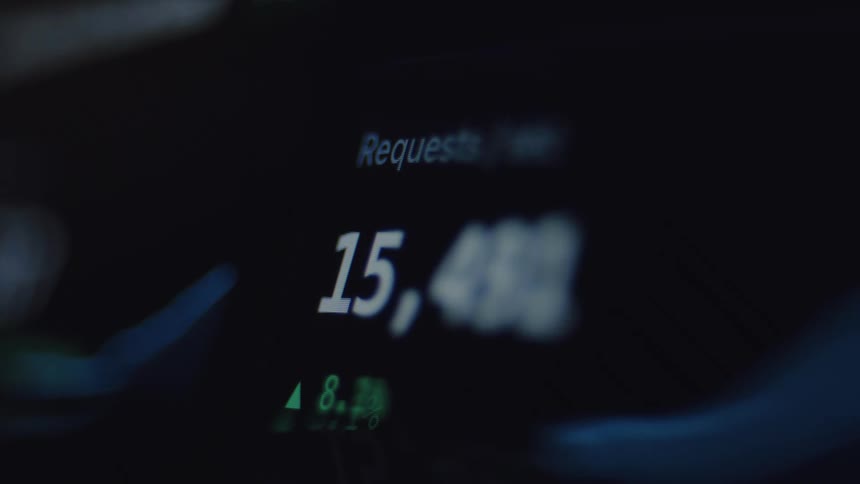
Close-up of a digital analytics dashboard showing a rapidly fluctuating counter for web traffic requests on a dark screen
A candlestick chart of a stock option displayed on a computer screen
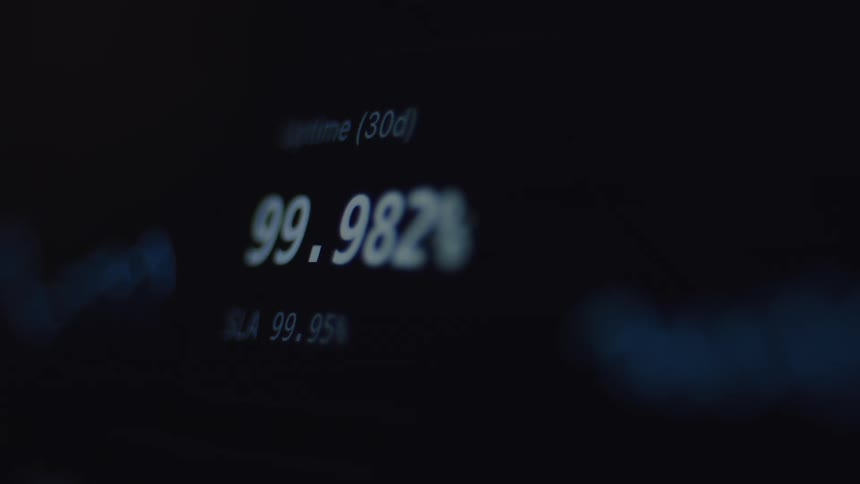
A macro shot shows a digital server uptime metric of 99.982% on a dark computer screen
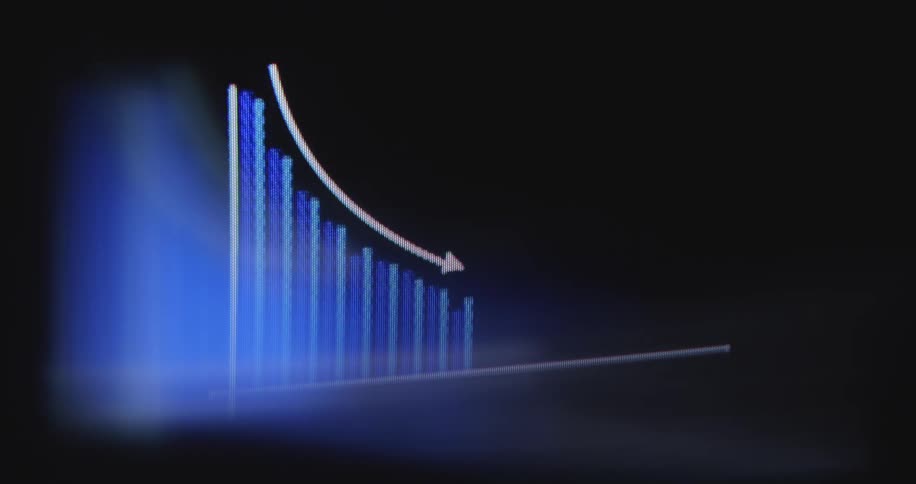
An animated blue bar graph on a black screen shows a downward trend, representing financial loss or recession
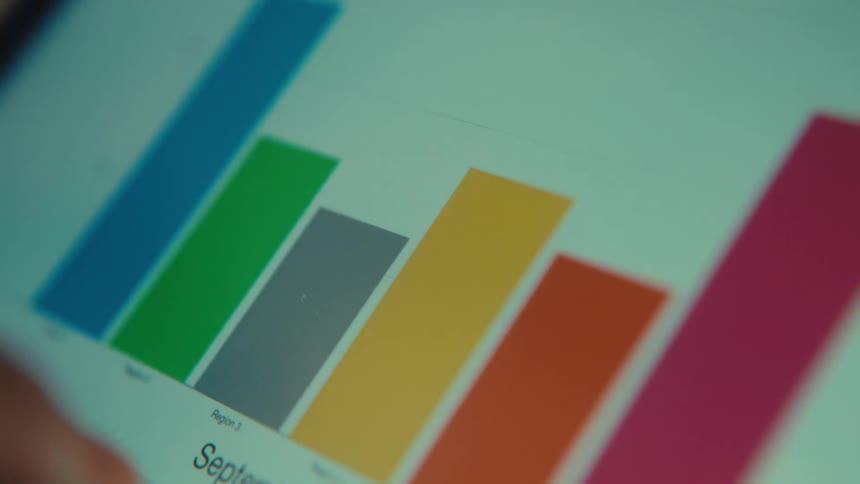
A person scrolls through colorful bar graphs showing monthly business data on a digital tablet screen
A blurry close-up of a digital financial graph shows a downward trend indicating a market crash or economic recession
Dynamic handheld macro close up with shaky camera movement of white 2D sound wave bar animation is jumping on the screen as symbol for the recording of a podcast audio book or music track
A computer screen with a green graph on it
A screen shows a financial chart with lines and bars moving up and down
A close-up, out-of-focus shot of data scrolling quickly up a bright computer screen
Television screen showing a no wifi symbol
Financial market candlestick chart displayed against a blurred background of buildings

Need help finding the
right footage?

Have it delivered to your account within 1 business day.

This is Filmsupply

Our StoryOur FilmmakersArticlesFilmsPopular SearchesAll Categories

FM

A family of brands dedicated to empowering the creative.

FILMSUPPLY

Footage licensing for productions

MUSICBED

Music licensing for filmmakers

STILLS

Image licensing for creatives

© 2026 FM LLC.
Privacy PolicyLicense TermsTerms & ConditionsCareers