Musicbed
Filmsupply
Stills
Contact Us(800) 805-6802
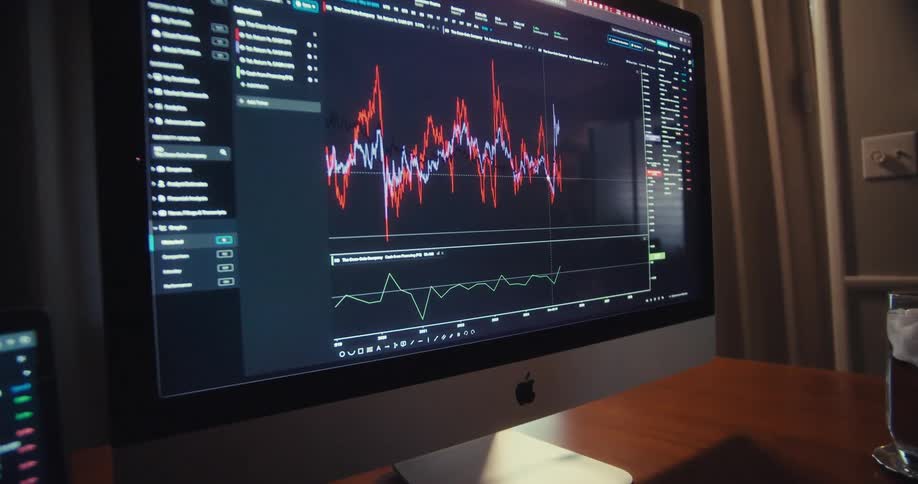
Close up of man trading on a laptop and desktop computer in a room
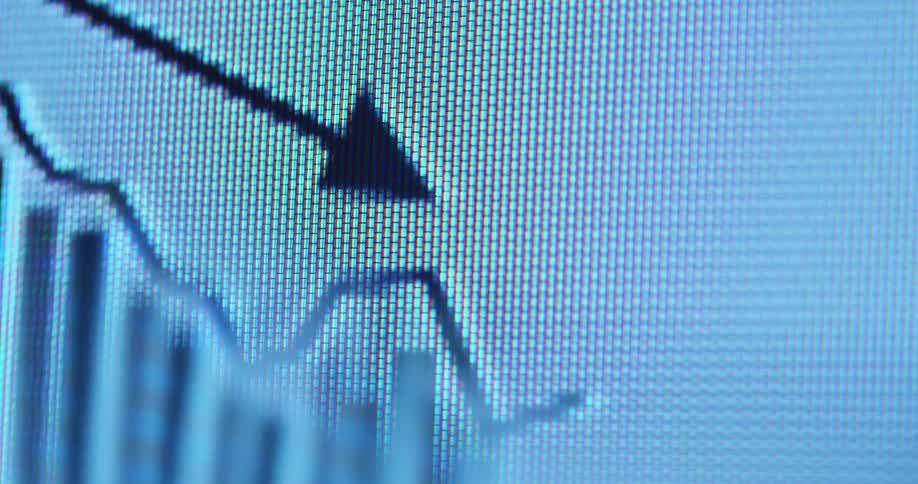
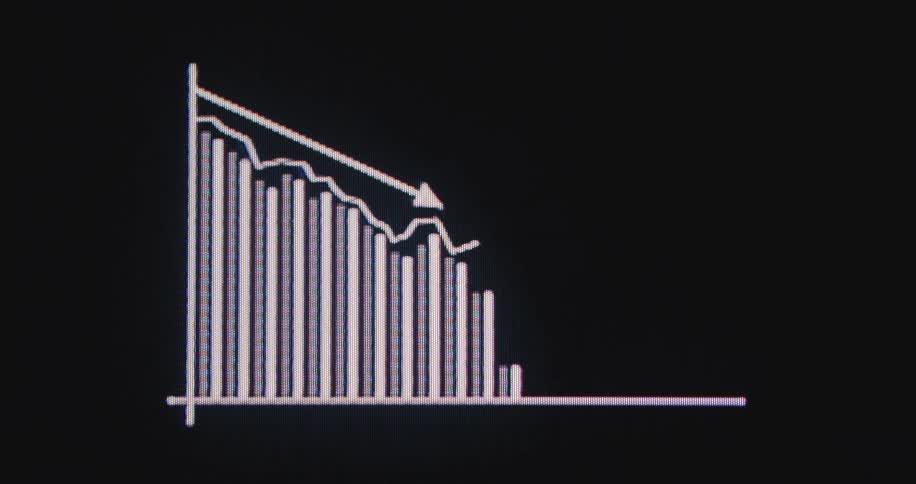
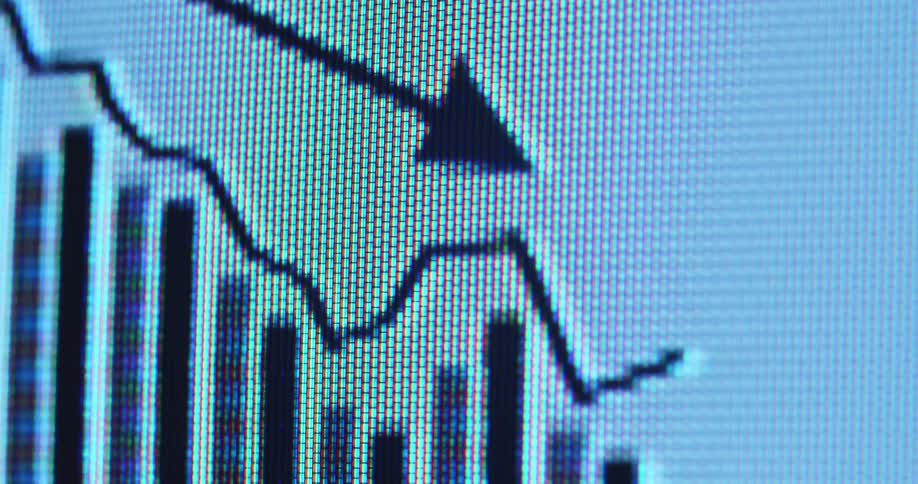
A macro view of a digital screen shows a black animated graph with a falling line chart and a downward pointing arrow overlaying vertical bar charts representing a market decline or financial loss on a white background
Man in a suit pointing with a pen at a chart on paper
A distorted, magnified view of scrolling lines of complex numerical data on a digital screen
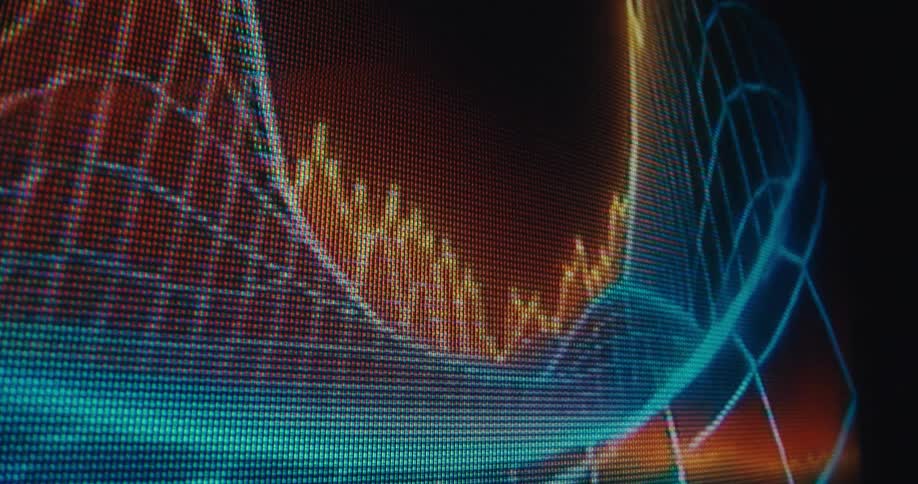
Screen displaying a dimensional color graph
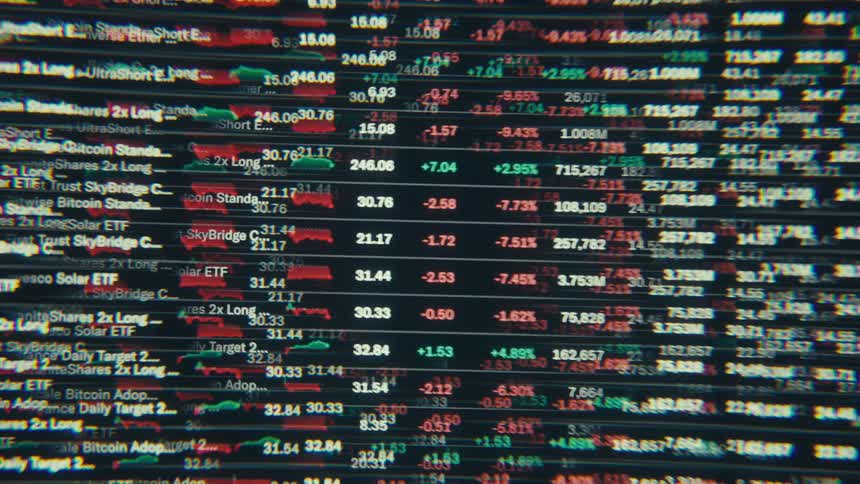
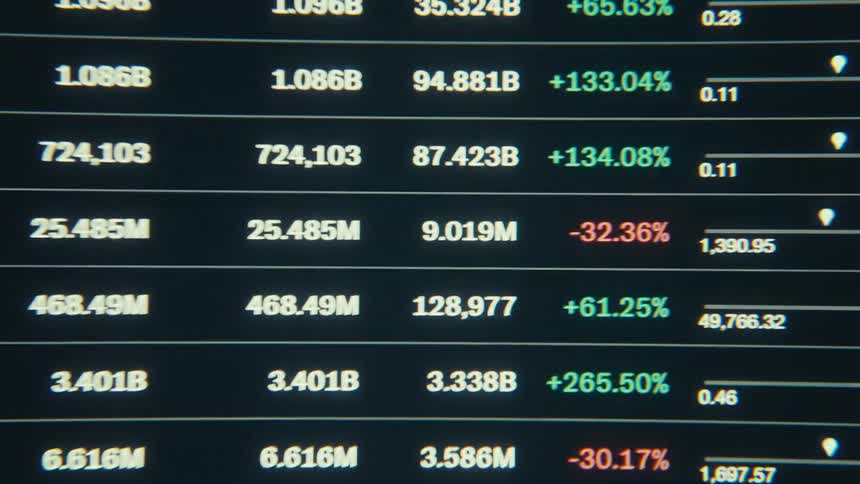
A digital screen shows rows of fluctuating stock market data
A close-up view through a distorted lens shows endless lines of numerical data scrolling on a computer screen
A closeup shot shows a digital screen displaying a financial graph with jagged lines fluctuating up and down in a rapid unpredictable pattern the camera pans along the digital chart showcasing the dynamic and complex movements of the data00
The financial markets get hit by a black swan event causing a massive crash or recession leading to a global economic crisis and great depression symbolized by a trading chart or graph that sharply falls into the red digits with dramatic downward movement
Closeup of a screen displaying a stock market chart
Extreme closeup of a pixelated red chart with significant downward trend highlighted by descending line and arrow as the stock market or the global economy decline and the US dollar loses value due to negative price development
Negative statistical data presented on a pixelated display device as the bars and arrow trend line follow a declining price development symbolizing a failure of the financial system and recession of the global economy
An animated green bar chart on a digital screen illustrates exponential growth with a rising arrow
A macro close-up of a digital stock market graph showing a bearish trend with a declining arrow indicating a financial crisis
Blue candlestick chart with bars and white trendline arrow displayed on a pixel screen with negative downward price development as symbol for unsuccessful stock trading or bad investment strategies with negative market analysis
Extreme macro shot of a digital bar chart with a downward-pointing arrow, symbolizing financial crisis, decline, and loss
Dramatic macro view of data visualization or presentation showing a negative down trend with critical development as the digital graph or chart animation crashes symbolizing extreme volatility and economic decline and uncertainty
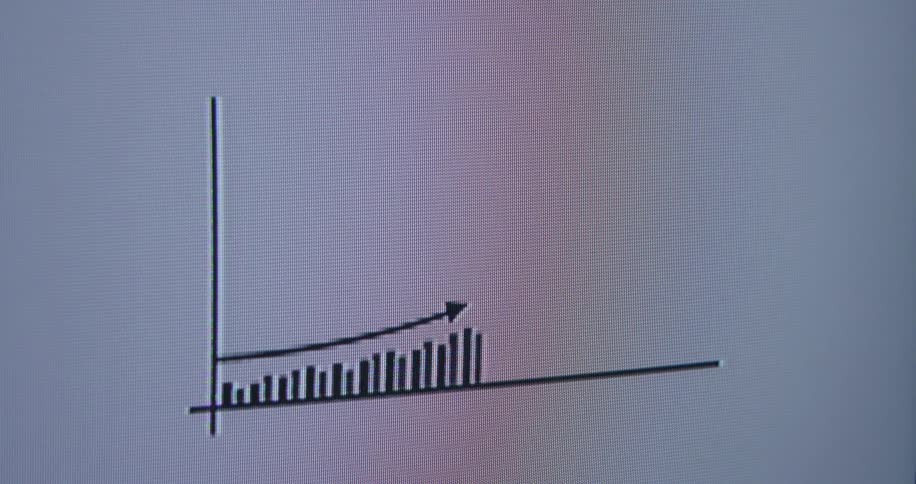
A retro animated bar graph on a vintage computer screen shows an upward trend of growth and success
Macro view of a digital screen showing a white animated financial graph and arrow moving upwards on a black background
Extreme close-up macro view of a pixelated digital graph with an arrow trending upwards on a screen
A vintage-style animation of a red bar graph on a black screen shows a positive upward trend
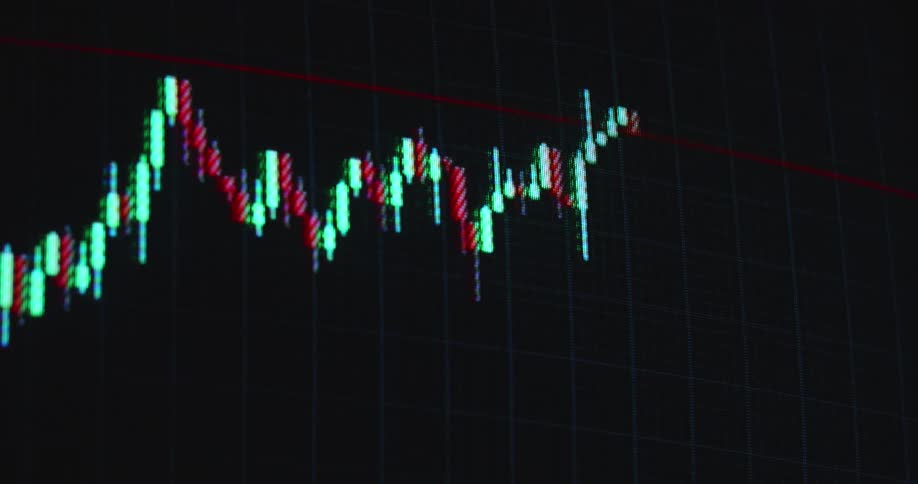
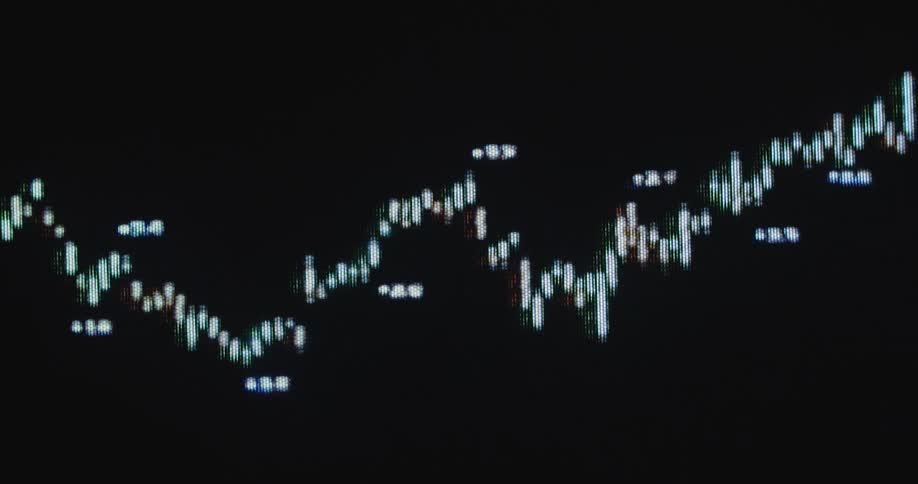
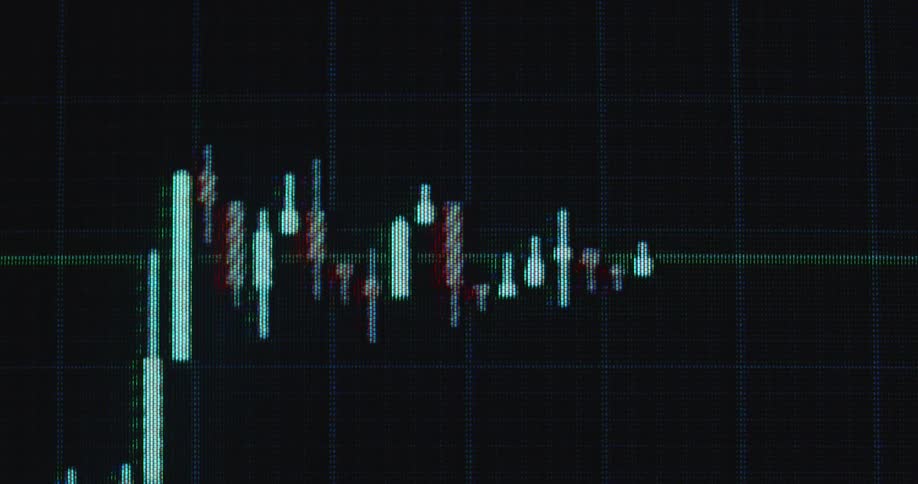
A candle diagram graph plots an array of data on a pixel screen with numbers representing rising and falling real estate prices or changes in the stock market or crypto currency finance sector
A digital screen displays an animated bar chart with a rising trend line and arrow, symbolizing positive growth and financial success
Extreme macro close-up of a green colored audio graph with red tips as a symbol for a loud song or noise with high frequencies as a sensory impression for the listener of the live music
An animated bar graph on a digital screen shows a steady upward trend and exponential growth
Close-up macro of a financial bar graph on a digital screen with a white arrow pointing down, indicating a downward trend, recession, or stock market crash
A macro shot of a blue bar graph on a computer screen with a white arrow indicating an upward trend of growth and success
A macro view of a digital screen displays a falling stock market chart with a downward trend arrow
Inflation causing the costs of everyday goods to go up causing increased expenses and a rising consumer price index or CPI displayed by a digital graph in a negative red color on a pixelated computer screen
A macro close-up of a digital screen shows an animated financial chart with a positive upward trend
Digital pixelated graph with positive trendline going up showing growth and financial strength of the global or US economy or an economical upward trend while making progress and profiting from business opportunities
An animated bar graph on a dark screen illustrates positive growth with an upward trend line
A blue and white graph or chart animation presents successful business data and a growing economy as the arrow moves upward with a positive price development due to healthy financial markets
A simple animated bar and line graph illustrates positive growth and increasing profits on a black digital screen
A digital investment graph trend line shifting between going up and down as a stock trading market prognosis or index of the finance sector affected by the global economy in the darkness on black flickering retro computer screen
A shot shows a view of a screen with a list of companies and their financial data
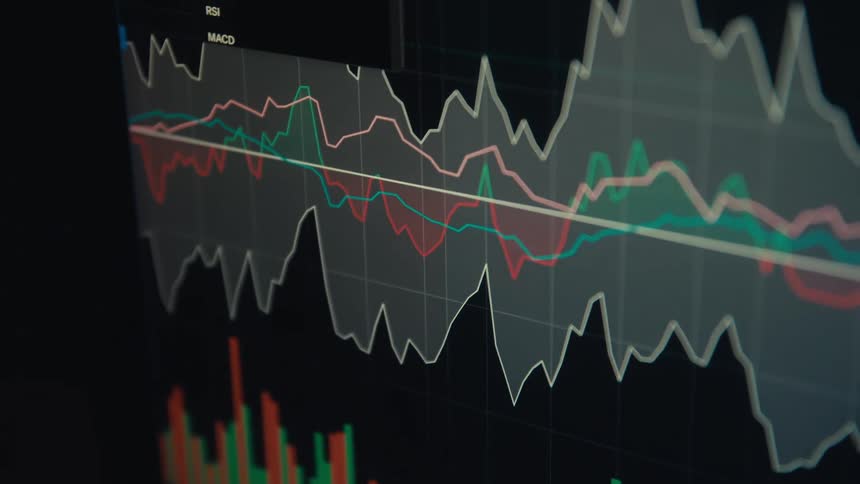
A screen shows a financial chart with lines and bars moving up and down
Dramatic macro shot of pixelated computer monitor showing a trading chart or financial graph crashing as the global economy is hit by a recession causing great depression and panic sales at the financial markets
Pixelated candlestick chart on a screen or monitor panel forming a bullish flag pattern while the trading chart analysis shows that the graph is about to break resistance to the upside making the price of the stock or asset go up and increase in value
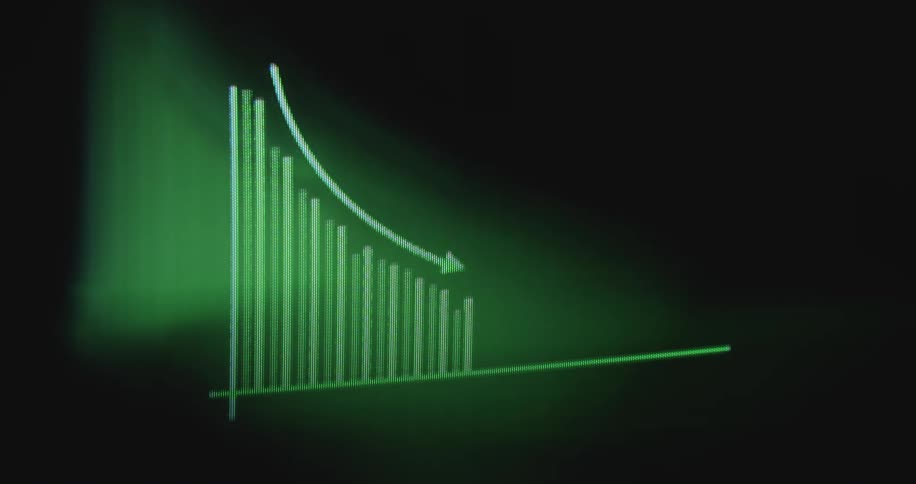
A simple animated bar chart on a black screen shows a downward trend, symbolizing financial loss or decline
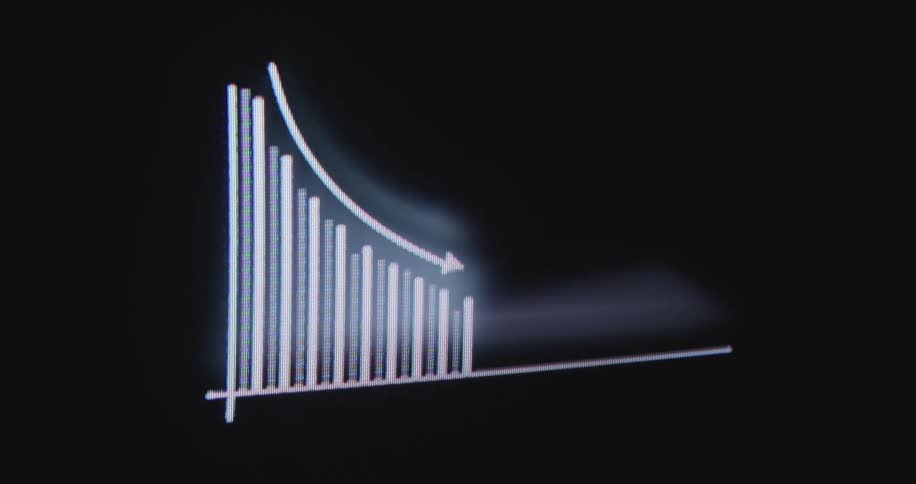
An animated bar graph with a descending trend line indicates a financial crisis or recession
A vibrant green digital graph displays fluctuating diagram consisting of lines and vertical bars with a prominent downward arrow indicating a decline of the Wall Street stock market or global economy with negative price development
Close-up of a pixelated screen showing an animated bar graph with a positive upward trajectory
Screen displaying the financial market chart in candles
Multiple data points at different values are continuously plotted next to a candle chart of a stock or crypto currency trading graph in a finance application or app on a dark pixelated computer screen
Macro shot of a computer screen showing a red bar chart and arrow indicating a positive, upward trend in financial data
Computer program creates a red line graph on a PC monitor going up and down and falling after being rejected by the trend line as a symbol for financial meltdown and losing money in the stock and crypto investment market
Pixelated screen of a vintage 90s computer displaying a green graph with an arrow pointing upwards symbolizing the beginning of the digital financial era and the first online trading platforms for buying stocks in the internet
An extreme close-up of a screen displays a fluctuating business graph with a prominent upward arrow, symbolizing financial growth and positive trends
Stock price bar chart displayed on pixelated computer monitor of a broker as the market crashes and the prices of the assets go down with a negative trend and a falling arrow indicating a decline in value and a recession with shaky movement
Macro close-up of a digital screen showing a declining blue bar graph with a downward pointing arrow, symbolizing a financial market crash or economic downturn
Three variations of an animated digital bar graph show a downward trend, symbolizing financial loss or decreasing statistics
Dynamic hand-held macro shot of pixelated screen showing stock trading chart or financial graph crashing with negative downward tendency falling into the red figures causing stress and panic with fear of economic recession
Screen displaying or visualizing a sound noise music or voice recording with a green and tech blue animation of an EQ or equalizer graph with sound bars jumping up and down to the beat as the sound waves move
A shot shows a graph on a screen with data lines moving up and down
An animated green bar chart on a black screen illustrates a steady decline with a downward-pointing arrow
A pixelated red bar chart with an upward-pointing arrow animates on a digital screen, symbolizing growth and positive financial trends
Line graph changes as the numbers in the data change on a digital screen
The neon green pixels of a retro tube television screen display a sales chart or graph on a black background moving upwards representing a positive statistic and data for a corporate presentation
The camera captures an extreme closeup of a screen as a graph of a share index traded at Wall Street or on an online stock exchange app is plotted while going up and down or falling or rising and changing between positive green and negative red
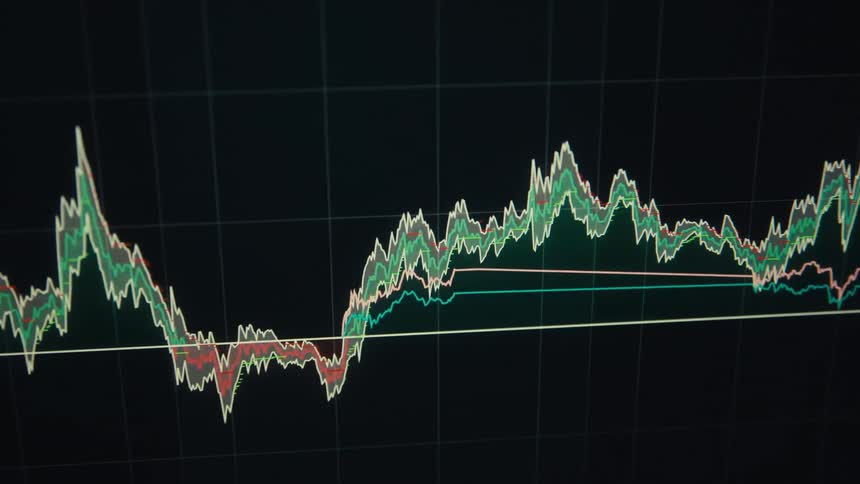
Multiple lines and a candlestick chart occupy the same graph on a digital screen as a selection is made
Close-up of a digital green financial bar graph on a computer screen showing a positive upward trend and growth
Bright neon green bars or candles of a candlestick chart pattern or financial graph on computer display screen with dark background and positive price development symbolizing successful stock trading with upward trend and handheld camera movement

Need help finding the
right footage?

Have it delivered to your account within 1 business day.
This is Filmsupply

Our StoryOur FilmmakersArticlesFilmsPopular SearchesAll Categories

FM

A family of brands dedicated to empowering the creative.

FILMSUPPLY

Footage licensing for productions

MUSICBED

Music licensing for filmmakers

STILLS

Image licensing for creatives

© 2026 FM LLC.

Privacy PolicyLicense TermsTerms & ConditionsCareers