Musicbed
Filmsupply
Stills
Contact Us(800) 805-6802
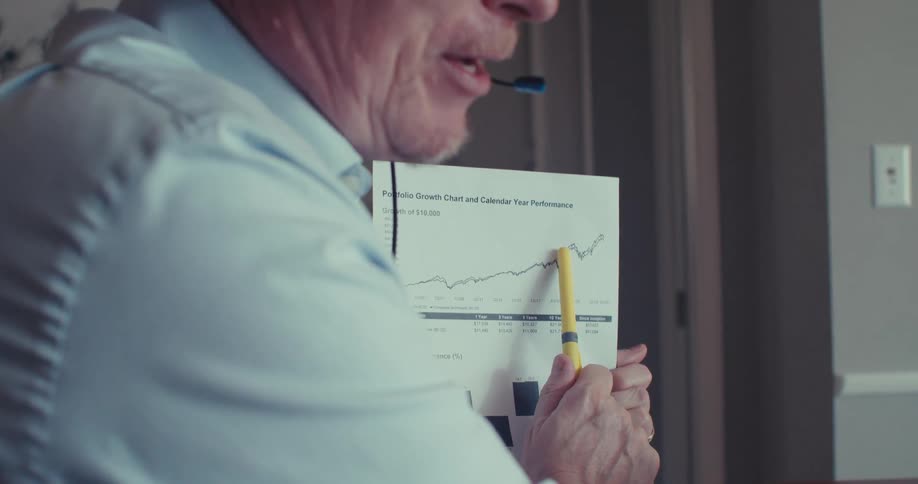
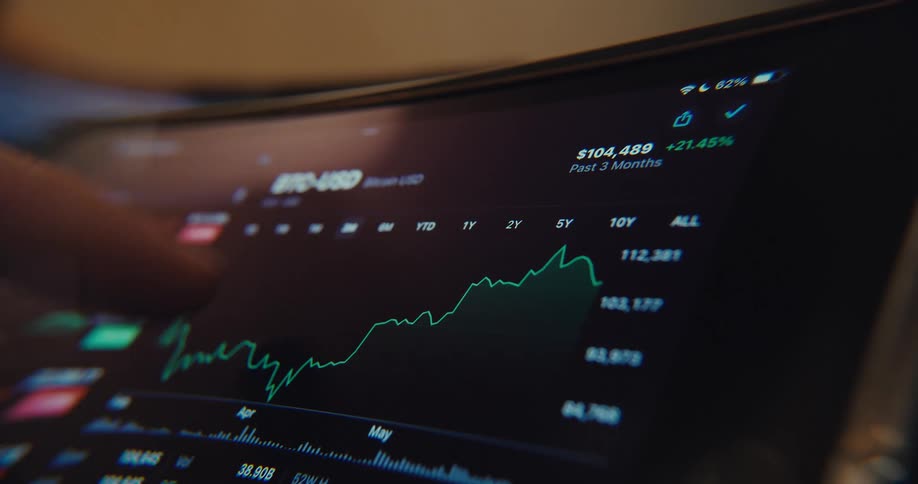
Finger pointing at a market line chart displayed on a digital screen
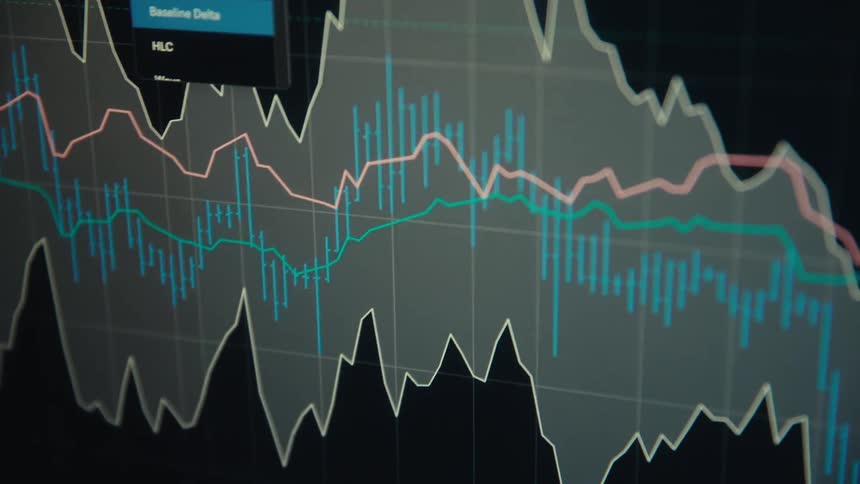
Closeup of a screen displaying a stock market chart
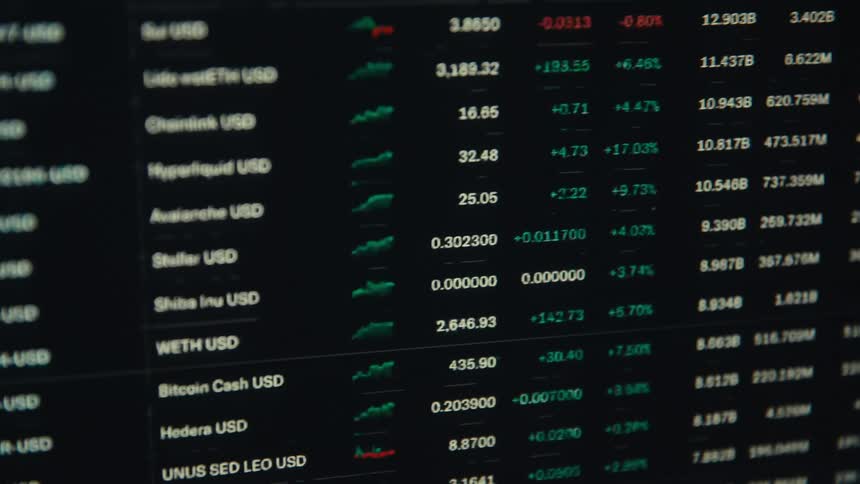
A screen with cryptocurrency market data and tickets that change
An extreme close-up, pixelated view of a red financial graph with a downward arrow indicating a stock market crash and economic decline
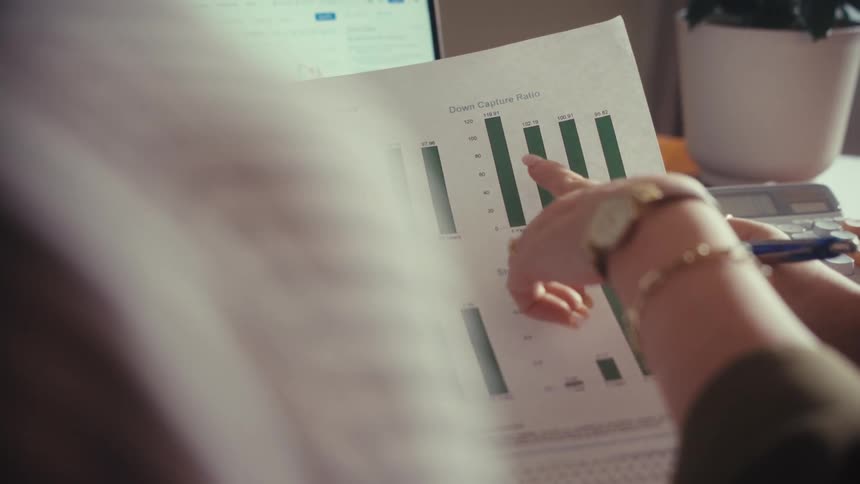
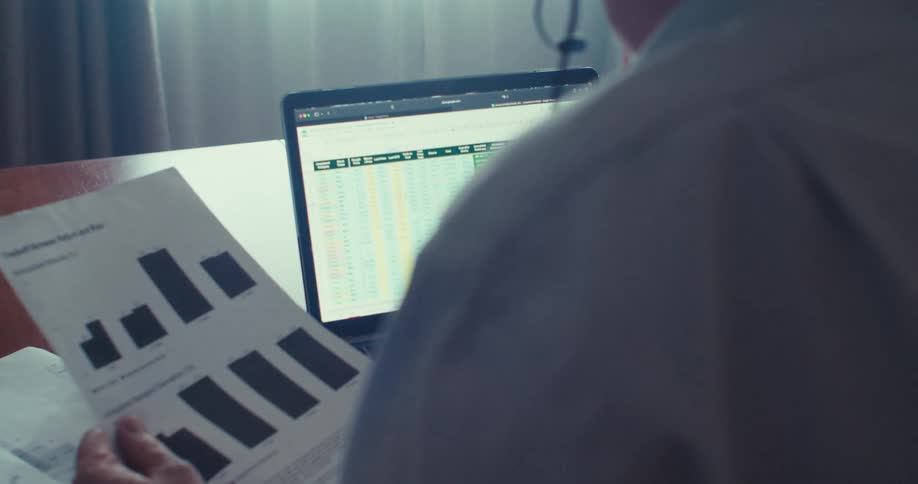
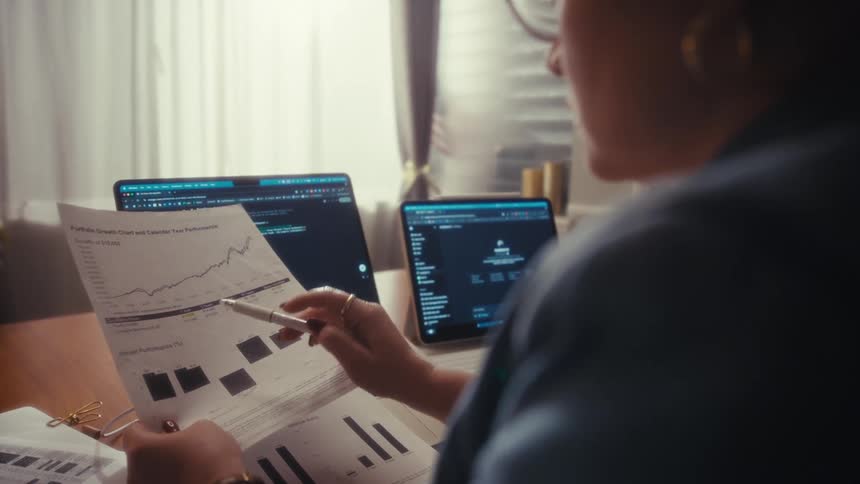
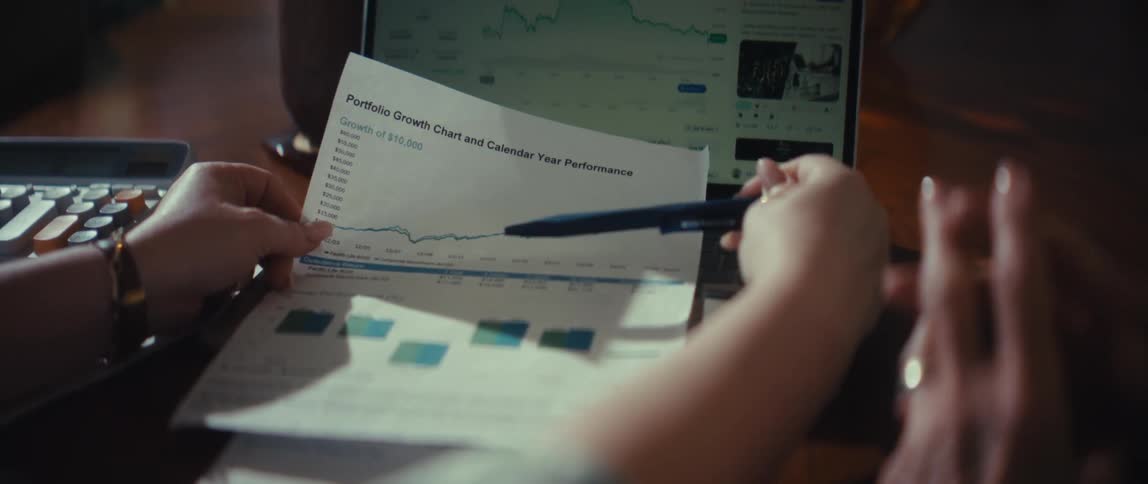
Over the shoulder shot of a financial advisor explaining market statistics on a printed document with a laptop in the background
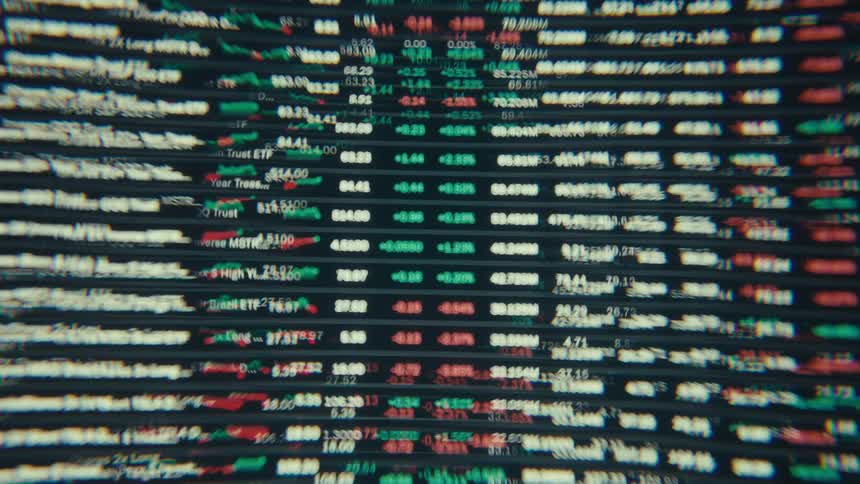
This video features a closeup blurred shot of a digital stock market ticker displaying fluctuating financial numbers and percentages the motion blur and shifting colors of red and green create a sense of fastpaced abstract data movement
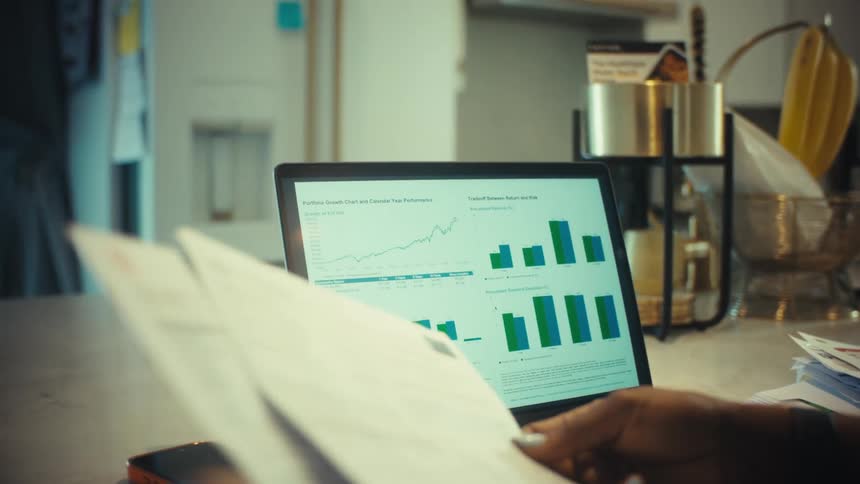
A person reviews their financial portfolio and sorts through paperwork while working from home at the kitchen counter
An over-the-shoulder shot of a businesswoman pointing at a green screen laptop while reviewing a printed business report
Series of candlestick stock prices displayed on a screen
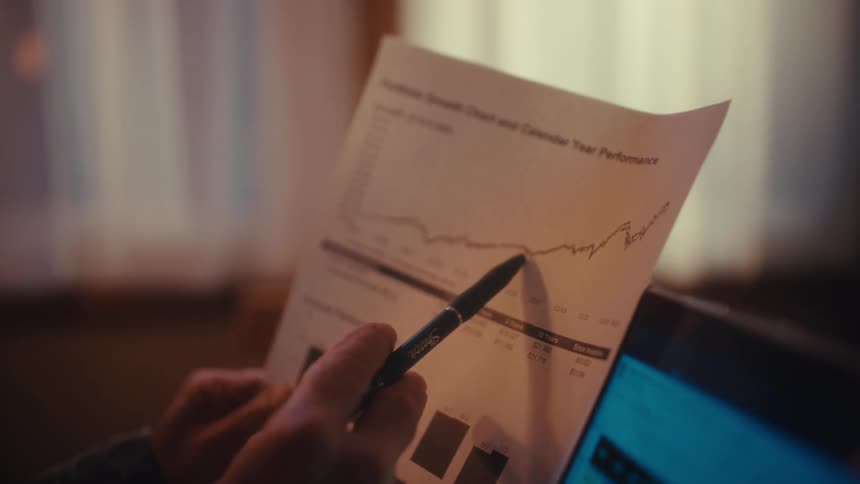
A man is using a pen to point to a paper with a graph and he is looking at a laptop screen
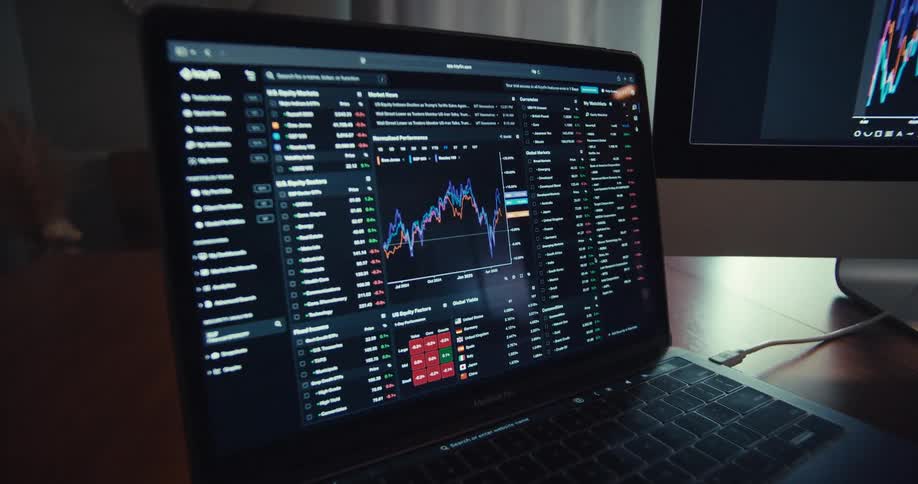
Computers screens are full of information
An over-the-shoulder shot of a couple analyzing their financial portfolio's growth on a laptop and printed charts
A person uses their tablet to check stocks
Red falling trading chart of an online stock broker or crypto exchange in a downward trend during a bear market crash and financial crisis symbolizing failure bankruptcy insolvency and losses caused by declining international and global economy
A man holds a document while wearing headphones with a microphone speaking into the mic as he looks at stock prices on a laptop monitor around midday at an office desk
Informational graphs cover the computer screen
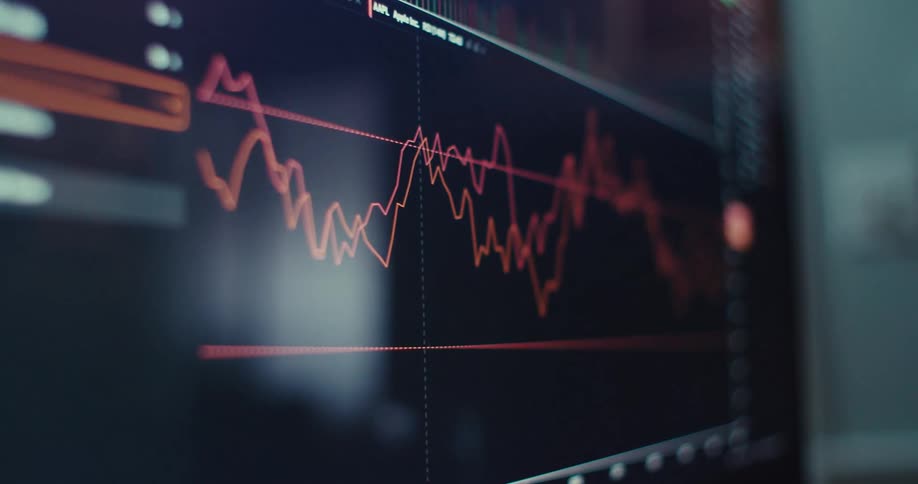
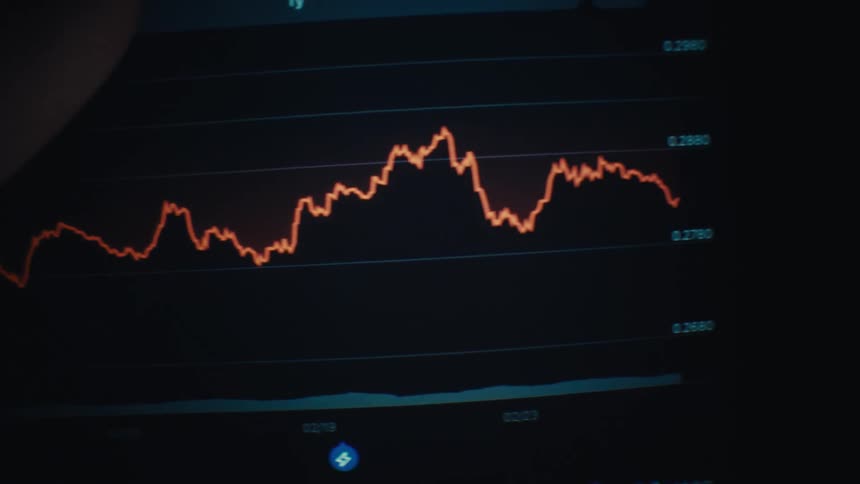
A close up view of a computer screen displays fluctuating orange and red line graphs against a dark background
A computer screen displaying the phrase what can i help you with as new words are being typed beneath it
Closeup of a screen displaying distorted stock market data
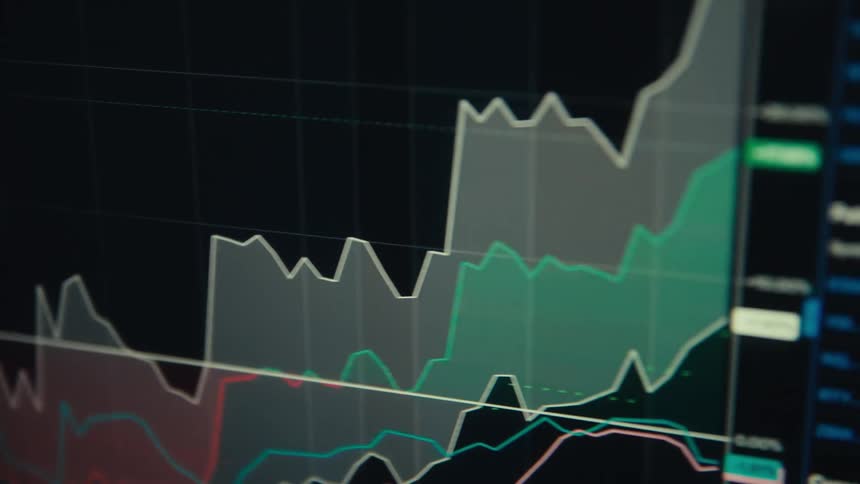
Multiple lines and a candlestick chart occupy the same graph on a digital screen as a selection is made
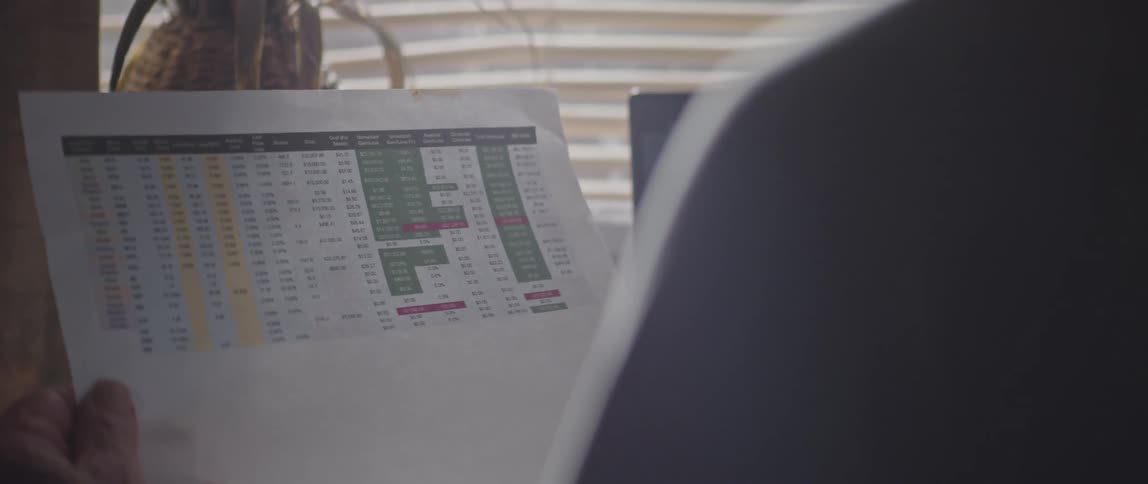
Man reading spreadsheets printed on paper
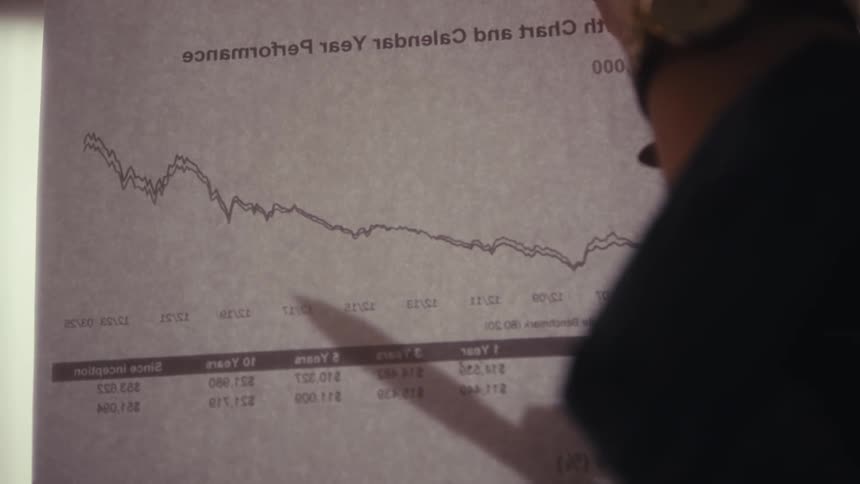
Person points to a specific section of a declining chart printed on paper
Digital chart shows a sharp rise followed by a decline throughout the trading session
Blue candlestick chart with bars and white trendline arrow displayed on a pixel screen with negative downward price development as symbol for unsuccessful stock trading or bad investment strategies with negative market analysis
A person reviewing printed documents at an outdoor table using a pen to point at specific datathe first line of interest is a blue pen held in the persons right hand which they use to gesture toward various charts and figures on the pages
Man looks through printed documents while sitting near a computer
A stylus points at colorful fluctuating line graphs displayed on a digital screen suggesting data analysis or market tracking
The man points to a line graph on the paper
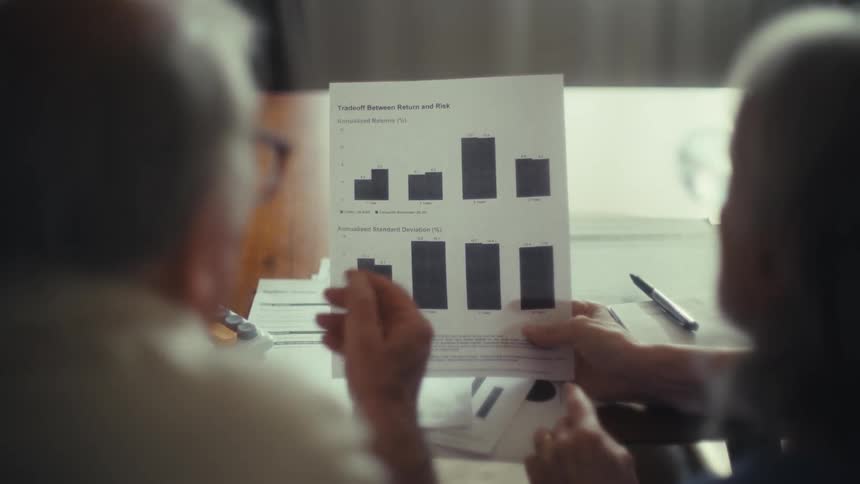
Two elderly people sit together reviewing a financial document with bar graphs comparing returns and risks
An over-the-shoulder view shows two business colleagues collaborating and analyzing a printed financial report with bar charts
A finger scrolls a glowing market chart on a screen that shows fluctuating prices with sharp dips and recoveries
Close up on two businesswomen analyzing financial charts on a laptop while reviewing documents at a desk
A couple reviews their investment portfolio performance by analyzing charts and graphs on paper and a laptop computer at night
An animated bar graph with a red arrow illustrates a declining trend, symbolizing financial loss or economic downturn
A close view over a womans shoulder shows her using a pen to analyze a printed stock chart while working between a laptop and a tablet in a sunny office
An elderly man intently reviews a financial portfolio growth chart tracking the data with a pen
A man and a woman are seated at a table covered in papers as the woman holds up a document with graphs and text and points to a section with her finger
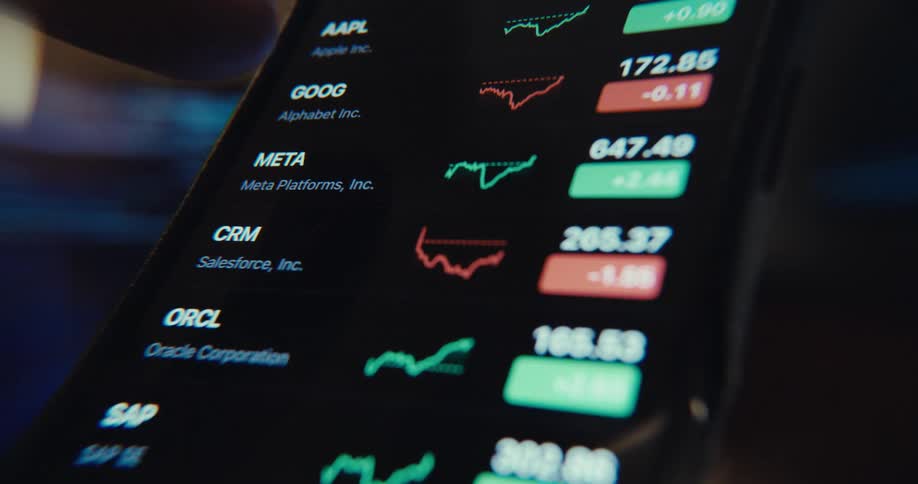
A person is interacting with a financial market app on a smartphone accessing the watchlist menu while viewing stock quotes
A computer screen with a green graph on it
A closeup digital screen displays a fluctuating stock or financial chart
A finger points at a tablet screen displaying a fluctuating stock market graph
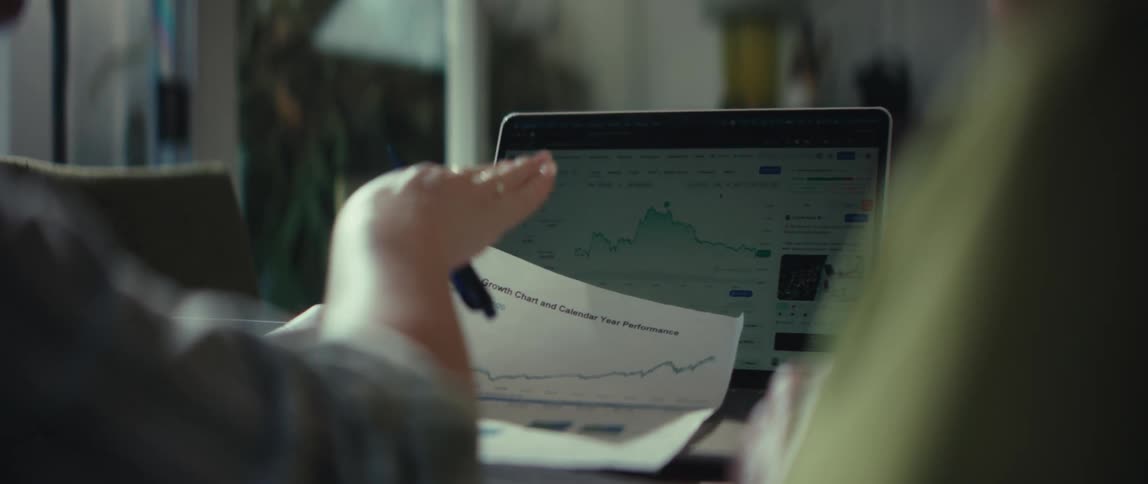
An investor compares a printed portfolio growth chart with a live cryptocurrency trading chart on their laptop
Person touching a screen of an electronic device
Futuristic closeup of a computer screen displaying a stock market graph or candle chart with ups and downs and upward tendency representing the digital and modern finance sector
A macro view of a digital screen shows a black animated graph with a falling line chart and a downward pointing arrow overlaying vertical bar charts representing a market decline or financial loss on a white background
Computer monitors on a desk are displaying graphs
A screen shows a financial chart with lines and bars moving up and down
The man traces his pen across the bar graph
The numbers scroll by on the monitor
A closeup shot shows a digital screen displaying a financial graph with jagged lines fluctuating up and down in a rapid unpredictable pattern the camera pans along the digital chart showcasing the dynamic and complex movements of the data00
The woman is talking and pointing at a piece of paper
A financial advisor carefully reviews printed reports with charts and graphs at their desk in slow motion
A computer monitor displaying a series of stock prices
Extreme close-up of a declining financial chart on a digital screen with a downward-pointing arrow indicating a market recession
Person typing on a macbook
Computer monitor displaying financial market data
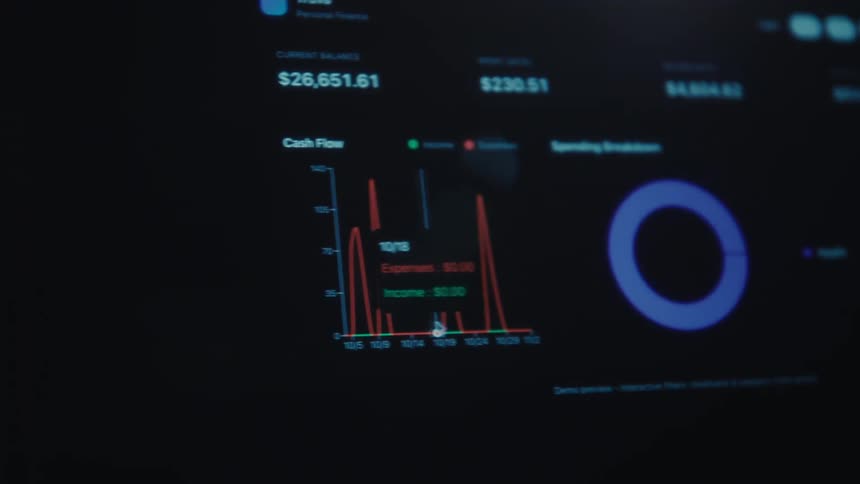
Monetary values displayed on a dark digital financial interface
Elderly man with headphones presenting a document in front of a laptop
Two elderly people review a bar chart document together indoors
Walking down a hall while scrolling on a phone
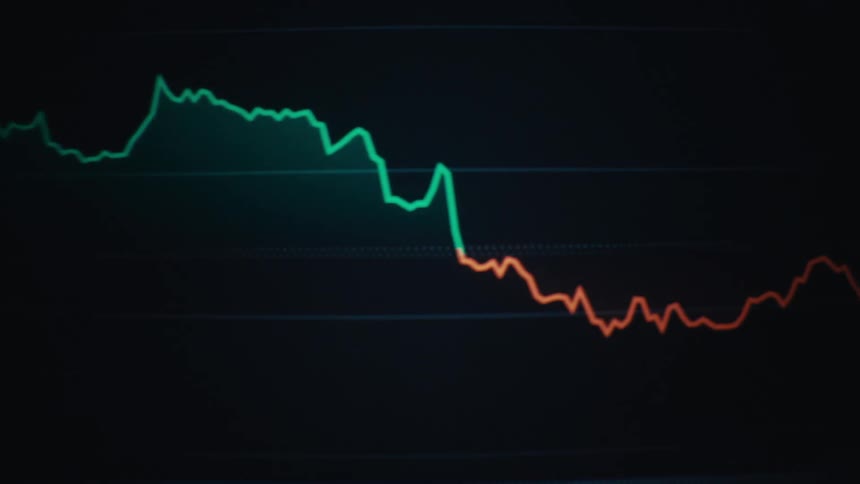
Price variation chart with a red line followed by a green line over time
Over the shoulder shot of two business professionals analyzing financial charts and graphs on a laptop and paper documents
Pixelated screen of a vintage 90s computer displaying a green graph with an arrow pointing upwards symbolizing the beginning of the digital financial era and the first online trading platforms for buying stocks in the internet

Need help finding the
right footage?

Have it delivered to your account within 1 business day.

This is Filmsupply

Our StoryOur FilmmakersArticlesFilmsPopular SearchesAll Categories

FM

A family of brands dedicated to empowering the creative.

FILMSUPPLY

Footage licensing for productions

MUSICBED

Music licensing for filmmakers

STILLS

Image licensing for creatives

© 2026 FM LLC.

Privacy PolicyLicense TermsTerms & ConditionsCareers