Musicbed
Filmsupply
Stills
Contact Us(800) 805-6802
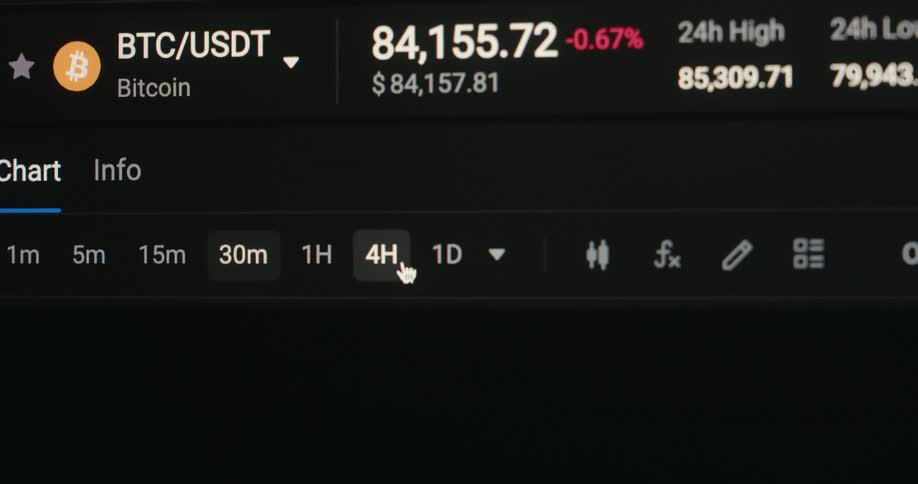
A cryptocurrency app screen transitions between trading views showing btcusdt market data chart intervals and detailed price movement stats
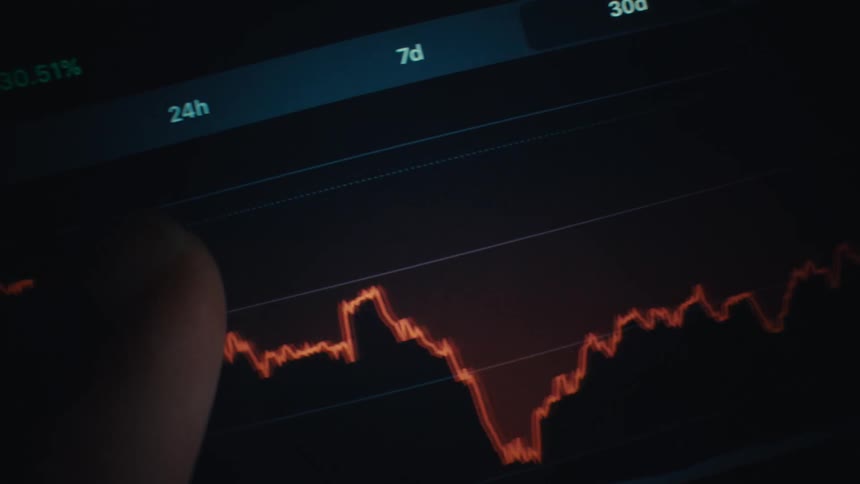
A finger scrolling on aglowing market chart on a screenthat shows fluctuating prices with sharp dips and recoveries
The video shows two horizontal lines of green binary code appearing on a dark screen the lines are composed of numbers 0 and 1 and more code seems to be appearing and moving down from the top

Green pixelated matrix style binary numbers or digits one and zero are flashing by fast during a calculation process of an AI on a computer system based on modern science and innovative information technology
Close up of pixelated digital numbers and percentages scrolling across a screen
Hand placing a pin on a map hanging on the wall
Screen displays a financial market chart with numbers
Trend line drawing red or green trading candles on monitor creating a candle stick chart pattern with upward tendency and great price development showing a successful trade with good performance and profit on black screen with grid
Inputing card verification number on a web page for an online order
A red fluctuating line graph rises across a blue digital screen toward a glowing targetlike marker
A computer monitor with information on it
Computer code is displayed on the screen
A candle diagram graph plots an array of data on a pixel screen with numbers representing rising and falling real estate prices or changes in the stock market or crypto currency finance sector
A compass is spinning to see the direction
A blurred closeup of a dark computer screen shows numbers beside lines of code with yellow syntax highlights suggesting a developer editor or console in use
Shaky handheld extreme macro shot of black numbers or digits counted in percent or percentage goes up and down while rising and falling and changing color to white symbolizing downloading uploading or scanning process
Development environment displaying a python script focused on data analysis and visualization
Pushpins form a scattered pattern on a wall
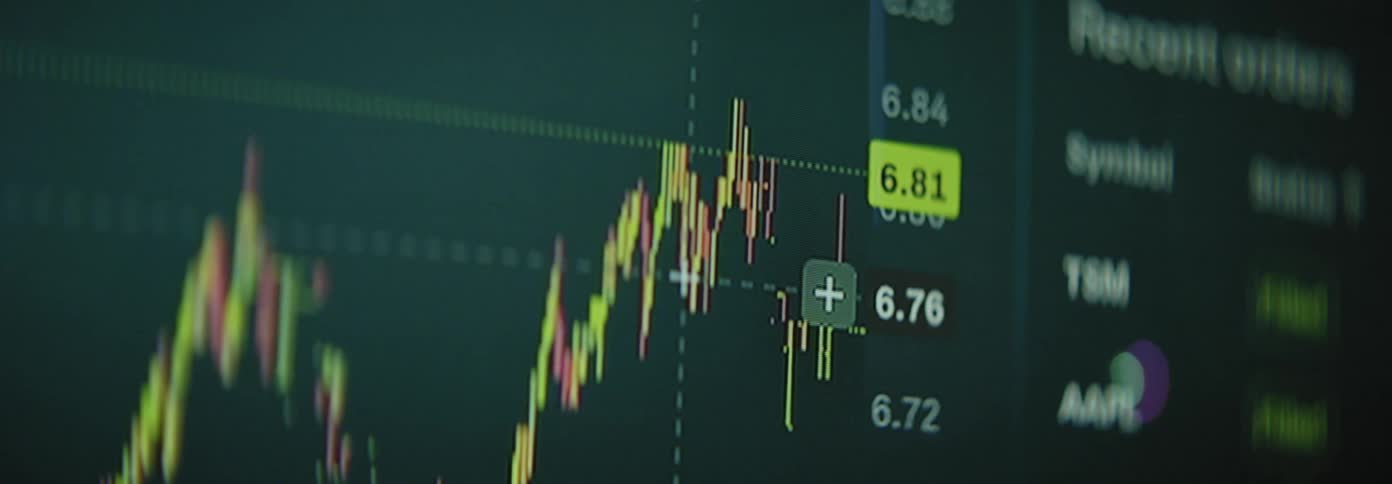
Extreme macro close up of a stock chart candle diagram with red and green candles and increasing and decreasing numbers on a dark digital computer screen with pixelated image and distortion
Extreme macro close up of circular orange light that flashes on and off while changing its shape in a dynamic way with movement and transformation and a line spinning around it in circles and full cycles on pixelated computer or TV screen
Heart rate showing on a monitor indoor
Data value displayed changes while cursor moves across a data plot on a computer screen
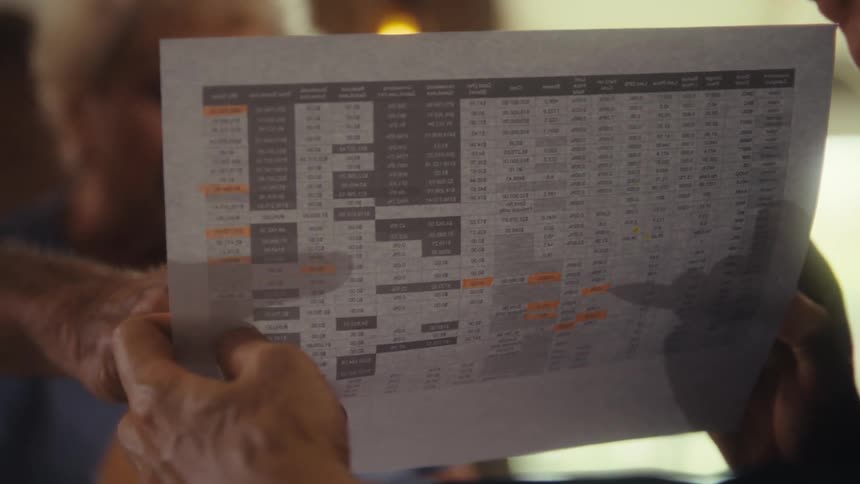
Hands holding a printed spreadsheet with orange highlights
A computer simulation
A computer screen displays programming language code
Green computer code appears on a grid pattern surface
Metallic old copper colored arms on machine slowly tick
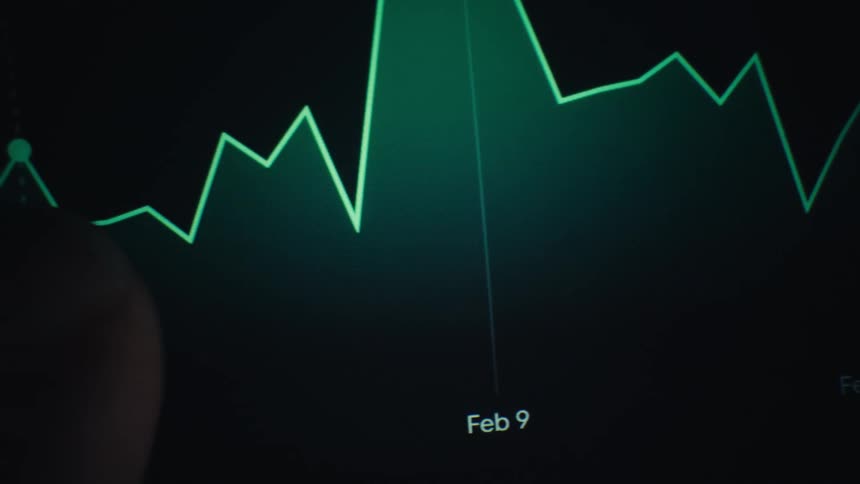
A computer screen indoors displaying a stock market price chart with a green line as a persons finger moves across it
A large row of pins move around
Extreme macro shot of a cursor clicking the 'NO' checkbox on a computer monitor, showing the individual pixels before the screen goes black
Green trend line drawing candles with wicks on dark pc screen creating bullish candlestick graph or pattern with upward tendency and positive price development symbolizing successful trade with profits via online trading platform or broker application
A closeup of an analog decibel meter shows a thin red needle hovering near 0 db
Dynamic handheld macro closeup of a retro tube television screen displays red and green figures numbers or digits in percentage that are increasing and decreasing causing stress and excitement as the end or deadline approaches and the time runs out
A close-up of a digital candlestick chart on a screen shows financial data fluctuating in real-time
The green pixels of a retro display device show the tips of sound bars from a 2D equalizer motion graphic animation as the sound waves move up and down with the different frequencies
Digital candlestick charts hover over a swiftly moving surface of black streaked with blue and orange shades
Entering month and year in box for credit card on computer screen
Thin horizontal green numbers and letters on a dark background in a blurry motion
A glossy screen full of colored pixels forming some high zoom image
An extreme close-up, pixelated view of a red financial graph with a downward arrow indicating a stock market crash and economic decline
Metal rod screwed together in center is labeled
The needle of a compass turns as light and shadow play across its face
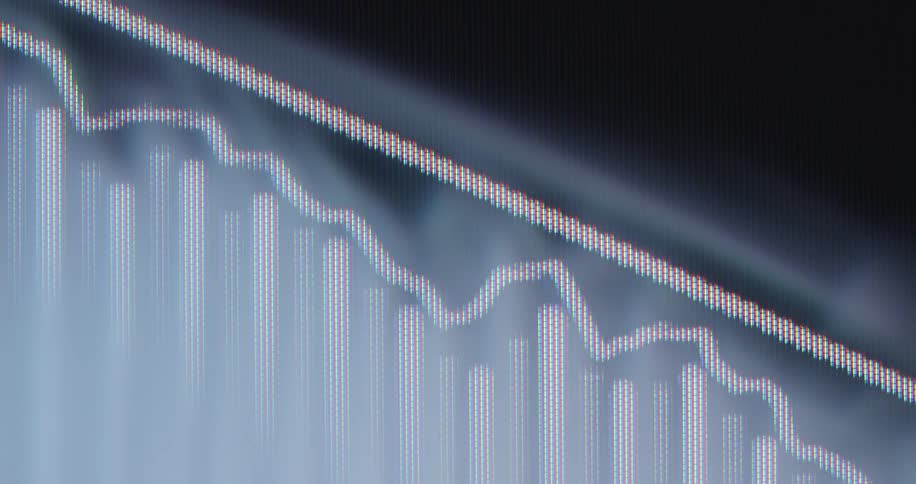
Extreme macro view of a digital screen with RGB pixels shows a black line graph with a downward pointing arrow overlaying vertical black bar charts representing a stock market crash or economic downturn with negative trend
A line graph is displayed on the monitor
White and blue lines
A countdown clock with three sets of digits in green counting down
Extreme close-up of a declining financial chart on a digital screen with a downward-pointing arrow indicating a market recession
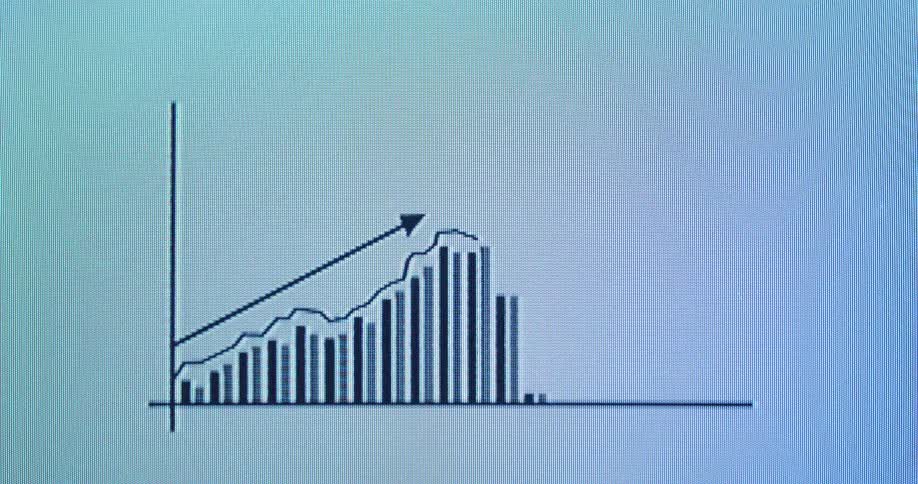
Pixelated bar animation or sales chart with an upward line represents continuous growth over time as the value increases during financial data presentation due to positive development or great business performance with economic success
A screen displaying a text editor with css code being entered into it
A finger scrolls a glowing market chart on a screen that shows fluctuating prices with sharp dips and recoveries
Computer program creates a red line graph on a PC monitor going up and down and falling after being rejected by the trend line as a symbol for financial meltdown and losing money in the stock and crypto investment market
Ones and zeroes flash across a screen
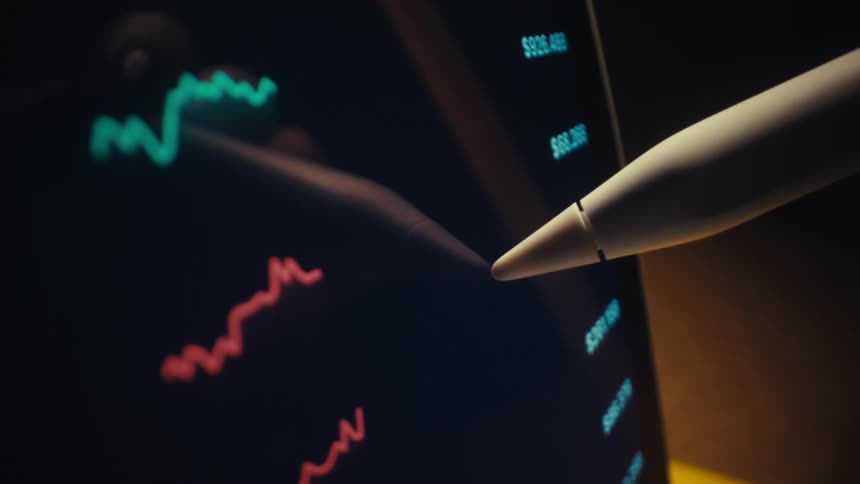
A stylus points at colorful fluctuating line graphs displayed on a digital screen suggesting data analysis or market tracking
A close-up view of hands rapidly typing and scrolling on a smartphone, with a futuristic digital data overlay visualizing network connections
The face of a compass
A person types a series of codes on a computer screen
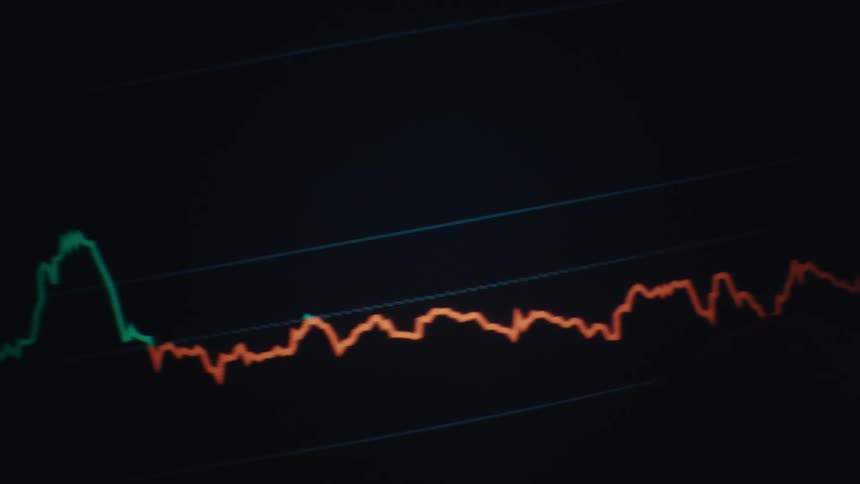
A close-up of a digital stock market chart shows a line graph rising in blue before turning red and crashing downwards
Orbit Shot of a Blue AI Neural Network - Abstract Data Flow - Machine learning - Nodes and Lines
The orange signal light is flashing and pulsating on a pixelated vintage computer screen or display as a digital warning signal or alarm causing stress hectic and awareness that something is wrong
Text flashes on a screen
A macro close-up of a blue digital stock market or cryptocurrency chart on a screen showing real-time price volatility and fluctuations
An abstract, out-of-focus animation shows a volatile candlestick chart with red and green bars moving on a digital grid
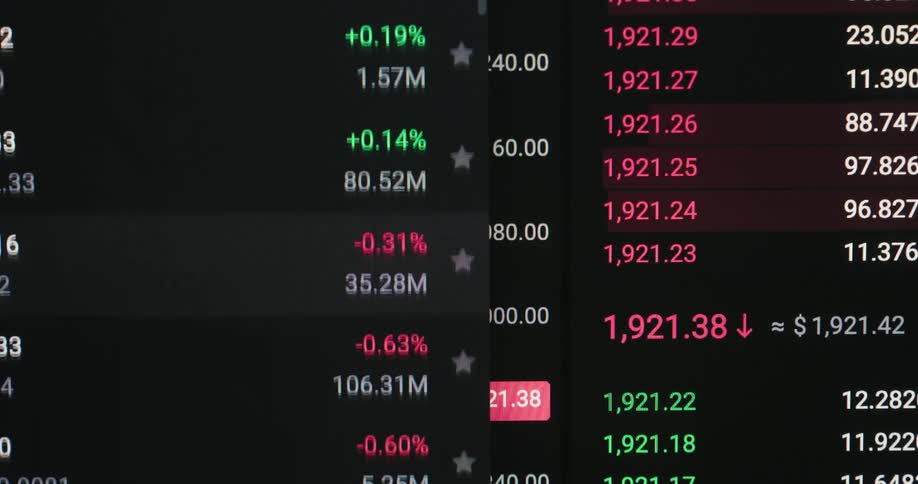
The screen has numbers and percentages displayed in a list

Need help finding the
right footage?

Have it delivered to your account within 1 business day.

This is Filmsupply

Our StoryOur FilmmakersArticlesFilmsPopular SearchesAll Categories

FM

A family of brands dedicated to empowering the creative.

FILMSUPPLY

Footage licensing for productions

MUSICBED

Music licensing for filmmakers

STILLS

Image licensing for creatives

© 2026 FM LLC.

Privacy PolicyLicense TermsTerms & ConditionsCareers