Musicbed
Filmsupply
Stills
Contact Us(800) 805-6802
Green graph displaying wavy shapes on a dark screen
A screen shows a financial chart with green and orange bars moving up and down
Handheld macro shot with dynamic camera movement of stock or crypto currency trading candlestick chart going up before crashing due to unexpected black swan event causing recession and economic depression on screen with grid and red candles
Extreme macro close up of a stock chart candle diagram with red and green candles and increasing and decreasing numbers on a dark digital computer screen with pixelated image and distortion
A street painted with thick markings turns into a tunnel
A person monitors frequently changing graphs on a screen
Computer program creates a red line graph on a PC monitor going up and down and falling after being rejected by the trend line as a symbol for financial meltdown and losing money in the stock and crypto investment market
A closeup digital screen displays a fluctuating stock or financial chart
Abstract wireframe geometric shapes and spheres float through a digital starfield
Blue waves of light curve around the frame while fading in and out
A image on a monitor
Side Following Shot of a Purple AI Neural Network - Abstract Data Flow - Machine learning - Nodes and Lines
Metal balls are swinging back and forth hitting each other in a newtons cradle
Looking at a pixelated computer screen or monitor displaying a trading interface of an online platform as the bullflag pattern breaks out and the long green candles move rapidly to the upside causing gains and profits with shaky camera movement
The bar graph goes up and down across the entire computer screen
A dynamic wave like light show against a black background
A high-tech digital animation of a financial market graph showing fluctuating prices with data analysis tracking
A screen with red and blue graphs
Multiple lines and a candlestick chart occupy the same graph on a digital screen as a selection is made
Bright orange and deep blue lines rapidly fluctuate and travel across a dark digital screen forming an active data graph that eventually shifts and blurs into soft luminous colors and abstract shapes
Glowing digitized neon lines changing colors and forming the shape of a football
Solid white line on dark asphalt seen in motion
An extreme close-up, pixelated view of a red financial graph with a downward arrow indicating a stock market crash and economic decline
A monitor displays a stock market candlestick chart with green and red candles moving across a dark grid
A pixelated green audio equalizer or financial bar graph with a moving cursor arrow fluctuates across a dark digital screen
Candlestick chart of ETF or exchange-traded fund with steady growth and positive price performance over a long time span or years as the price of the asset steadily increases with an uptrend and successful value development symbolizing good investment
The animated trading graph or candlestick chart is moving on the computer display as a recession hits the global finance markets and the prices crash as red candles symbolize the end of a market cycle and the beginning of a financial crisis or depression
A futuristic point-of-view hyperlapse shows a vehicle speeding down an empty city highway at night, creating mesmerizing light trails
Extreme close-up macro view of a pixelated digital graph with an arrow trending upwards on a screen
An up close of a computer screen with blue lines and a flashing of blue pixels
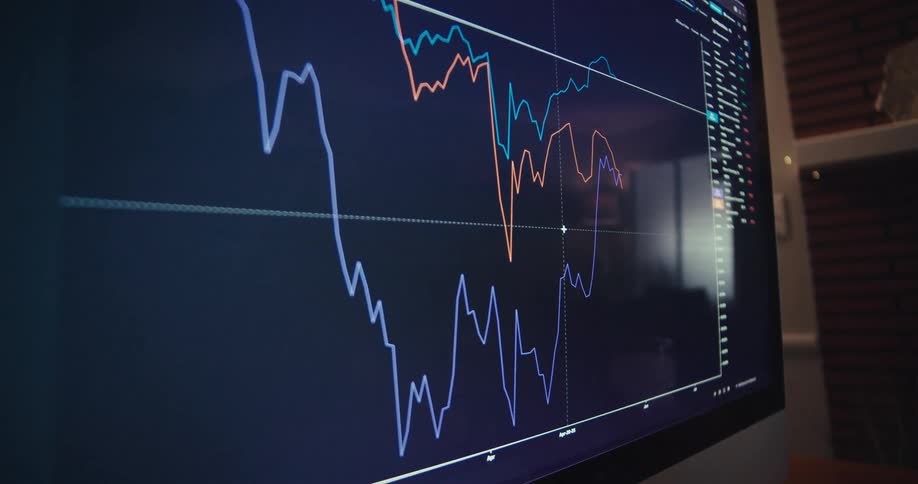
Price chart of a stock displayed on a screen
Side Following Shot of a Blue AI Neural Network - Abstract Data Flow - Machine learning - Nodes and Lines
Neon blue line floating across a black graph
Blurry close-up of a digital screen displaying a live stock market candlestick chart with fluctuating prices
Abstract lights against a dark background
Smartphone tracking the changes in stock price
A chart moves around on the computer screen
A black vehicle driving under a metallic grid
A glowing green line spikes sharply on a digital heart monitor screen signaling a sudden change in rhythm
Dolly Out Shot of a Blue AI Neural Network - Abstract Data Flow - Machine learning - Nodes and Lines
An abstract waveform with overlapping light streaks
A finger scrolling on aglowing market chart on a screenthat shows fluctuating prices with sharp dips and recoveries
A heartbeat is displayed on a monitor
A candle diagram graph plots an array of data on a pixel screen with numbers representing rising and falling real estate prices or changes in the stock market or crypto currency finance sector
Financial market candlestick chart displayed against a blurred background of buildings
A symmetrical multi-colored rainbow circle spins on pixelated display in the colors of the flag of the LGBT and LGBTQ or LGBTQ+ movement as a symbol for queer power or pride and diversity
Pendulum balls are hitting and swinging back and forth
A screen with a dna strand graphic
An abstract, glowing line graph fluctuates over a blurred candlestick chart, visualizing the volatility of the financial stock market
Flames flicker in a group of holes
The white lines are spinning around and moving upwardit is contained inside of a white frame that is seen when the lines come close to it
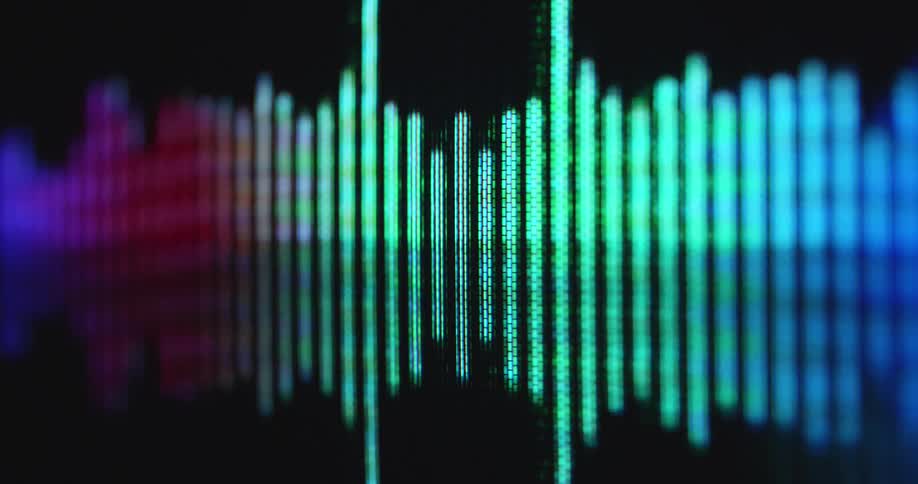
Screen displaying or visualizing a sound noise music or voice recording with a green and tech blue animation of an EQ or equalizer graph with sound bars jumping up and down to the beat as the sound waves move
A vibrant glowing orange line graphs a rhythmic heartbeat across a dark gridded medical monitor
View of graffiti from a subway window
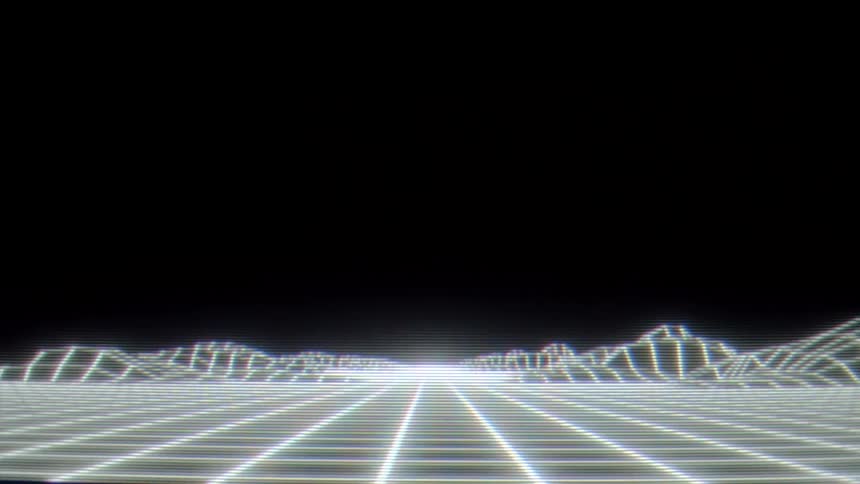
The video showcases a retrostyle glowing wireframe landscape that moves toward a bright horizon against a black background it features a distinct 1980s synthwave aesthetic and includes a filmsupply watermark throughout the footage
Black background with abstract blue lines patterns
Abstract closeup of a screen displaying lights
A multi-colored equaliser animation moves on a pixelated computer screen or display as the bars jump up and down visualizing the audio signal or voice recording of music or audio book or podcast
Closeup of a computer screen showing live stock market data and charts
Man uses a white board while speaking on a meeting at the office
A fluctuating blue digital chart line trends downwards in a dark, abstract macro shot
Pixelated macro close-up of a digital screen showing the user interface of an online trading platform or finance app or broker application displaying a candlestick chart or graph with green candles as the price increases and goes up with a positive trend
Locked off static extreme macro shot of graph that rises to infinity on vintage display device as symbol for financial success growth and freedom due to successful equity or crypto trading strategy by a stock broker of online exchange finance application

Need help finding the
right footage?

Have it delivered to your account within 1 business day.

This is Filmsupply

Our StoryOur FilmmakersArticlesFilmsPopular SearchesAll Categories

FM

A family of brands dedicated to empowering the creative.

FILMSUPPLY

Footage licensing for productions

MUSICBED

Music licensing for filmmakers

STILLS

Image licensing for creatives

© 2026 FM LLC.

Privacy PolicyLicense TermsTerms & ConditionsCareers