Musicbed
Filmsupply
Stills
Contact Us(800) 805-6802
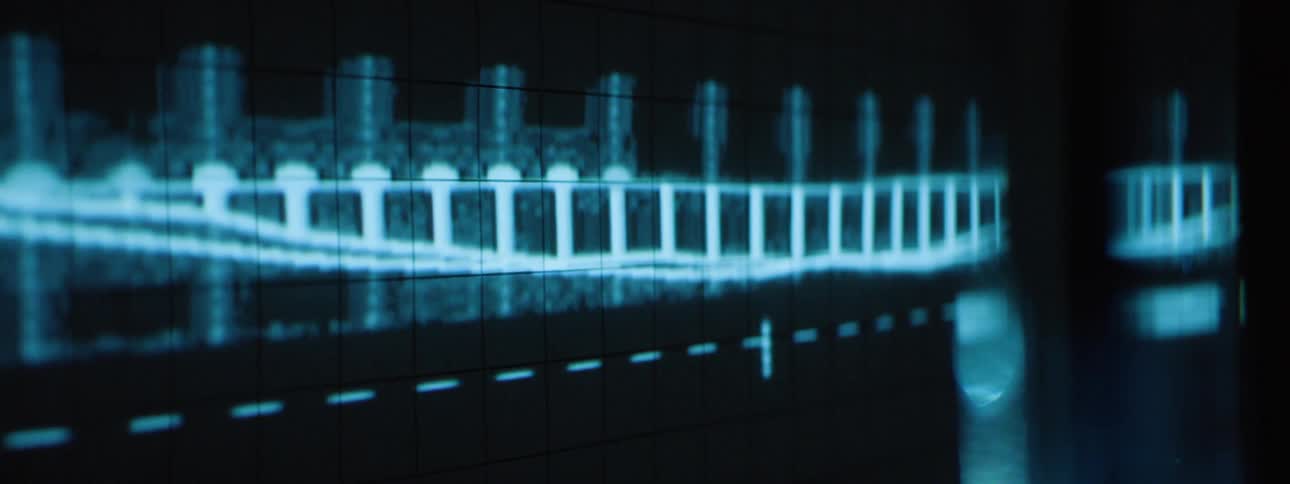
A waveform signal is displayed on a digital oscilloscope screen in a bluetinted lab setting
Series of candlestick stock prices displayed on a screen
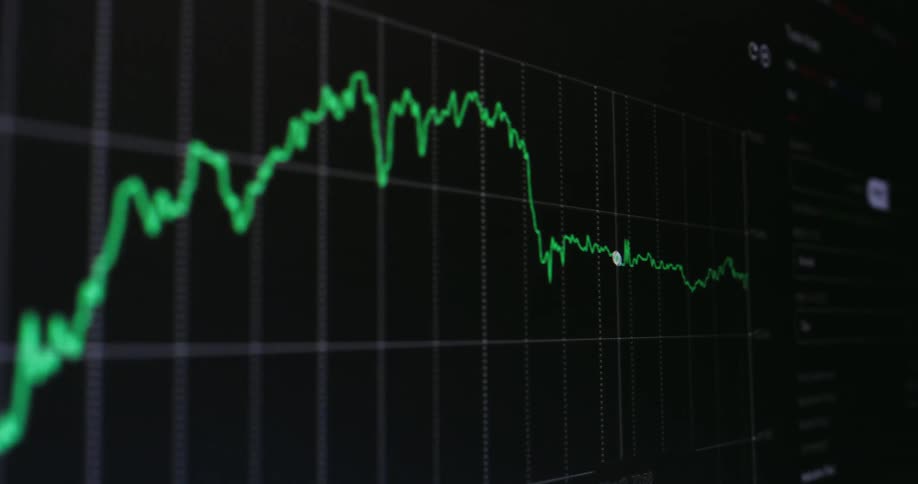
A blurry close-up of a green stock market chart on a digital screen showing fluctuating data and an upward trend
Macro shot of a blue digital audio waveform or histogram graph being generated on a computer screen
Person selects time intervals and points on graph on phone display
A graph showing two lines and scattered dots
A close-up of a blue digital line graph showing fluctuating real-time data on a dark screen
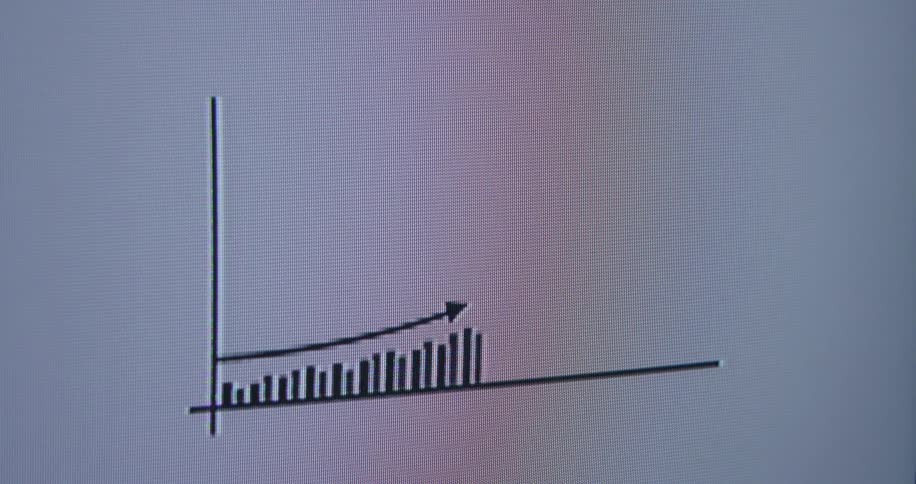
An animated green bar chart on a digital screen illustrates exponential growth with a rising arrow
Financial market candlestick chart against a dark background
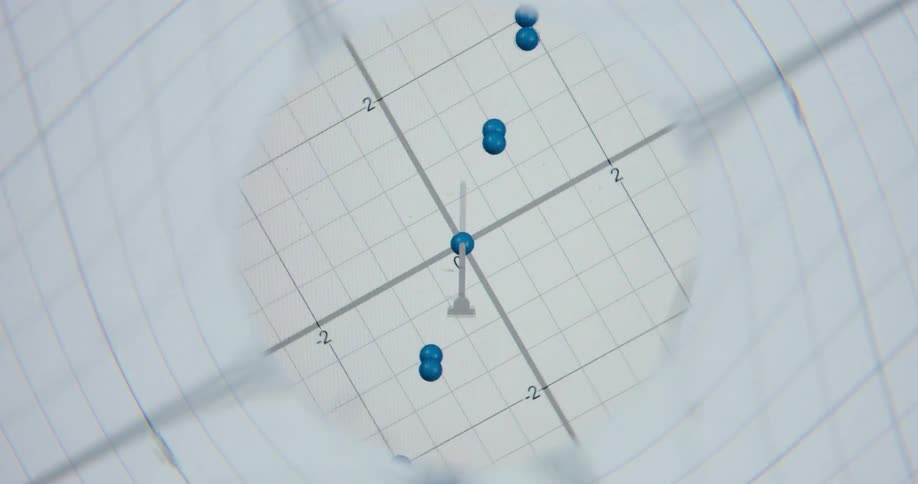
A macro shot through a magnifying glass reveals a rotating 3D graph with animated blue data points on a digital screen
A heart rate monitor screen displaying a green radarlike interface
A dynamic motion graphics video shows glowing turquoise lines moving in a zig zag pattern across a dark digital grid
Multiple colorful lines move in an animated digital graph
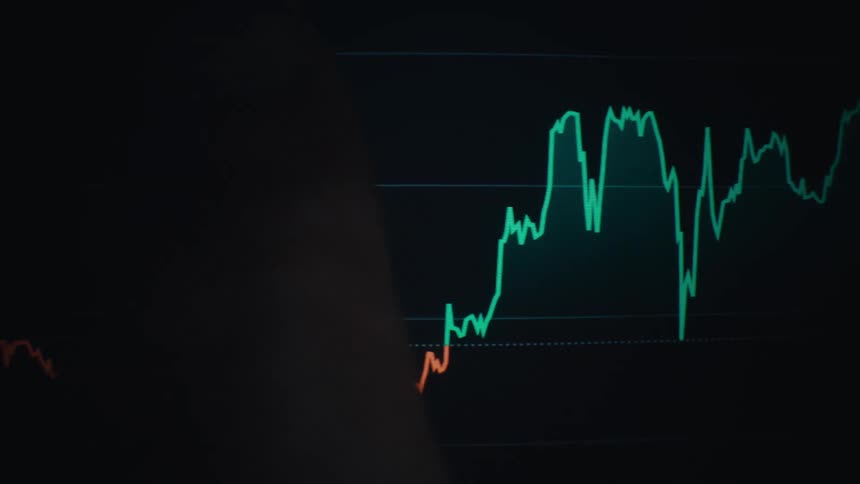
Extreme close-up of a digital display showing a fluctuating data line changing between green and red against a dark background
Close up view of technology in a clinic is displayed
Oscillating motion captured across multiple moments
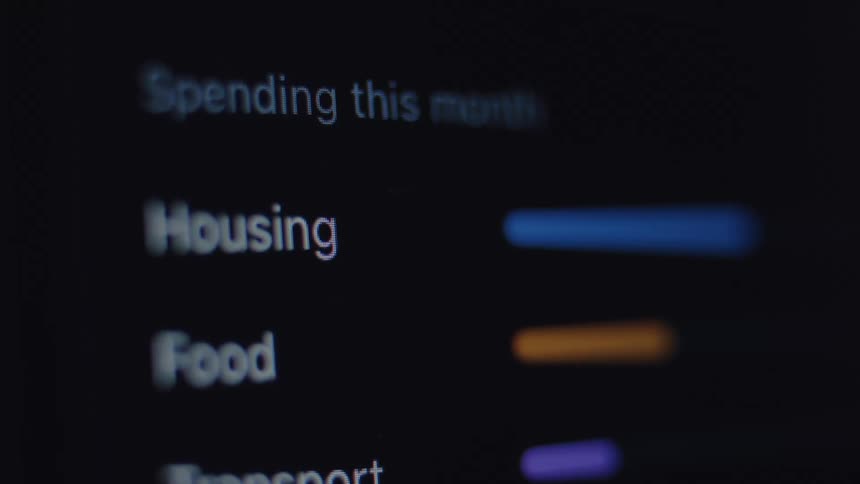
A close-up macro shot of a personal finance app displaying monthly spending on housing, food, and transport
An animated bar graph on a digital screen shows a steady upward trend and exponential growth
Close up of an electronic screen displaying a trading interface with blue candlesticks against a dark background
Flatline on an electrocardiogram monitor
A screen glitches out
The line chart on the computer has different shades of color
Light flashes on the grid on a scientific device
A real-time digital trading chart fluctuates on a screen, with the line graph indicating financial gains and losses
Orbit Shot of a Blue AI Neural Network - Abstract Data Flow - Machine learning - Nodes and Lines
White lines curve and cross each other across the screen
An out-of-focus close-up of a digital screen displaying a budgeting application tracking monthly spending on housing, food, and transport
An animated blue bar chart with a glowing effect illustrates increasing data and positive growth on a digital screen
Financial candlestick chart against a gray screen
Animated 3D scatter plot with rainbow-colored data points being analyzed on a computer screen with a futuristic interface
A heart rate monitor device displaying a series of fluctuating lines indicating the heartbeat rhythm in realtime
A line graph shows fluctuating stock data shifting into a rising trend against a dark background
Seismograph marking waves on a letterhead
A screen displays a flickering patch of colors and a number scale
A close up of a cell phone screen with a graph displayed and numbers
The vehicle is moving fast on the tracks
A detailed, close-up view of a live financial candlestick chart showing market volatility with moving green and red bars
An animated green bar chart on a black screen illustrates a steady decline with a downward-pointing arrow
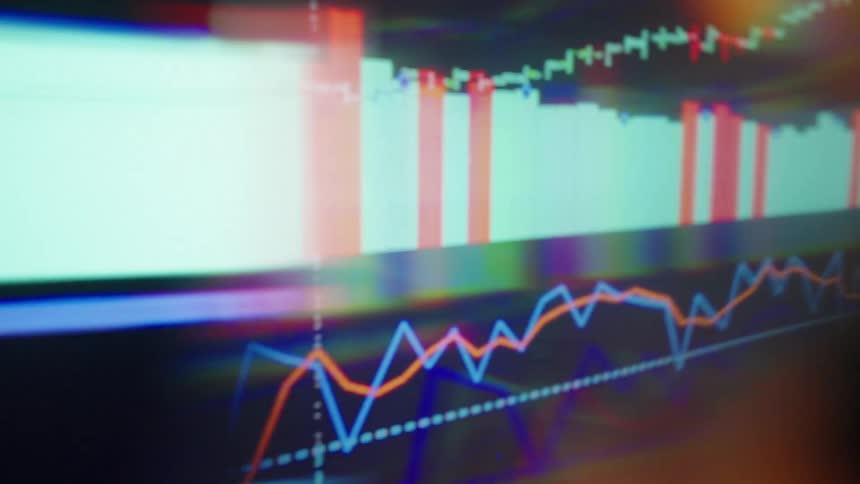
The video features a closeup cinematic shot of various financial data charts and candlestick graphs flickering across a digital screen it captures the fastpaced atmosphere of stock market trading through shifting focus and vibrant multicolored data v
An abstract animation of a rotating 3D scatter plot shows dynamic blue data points on a coordinate grid
A sound wave displayed on a monitor
Closeup of a digital trading graph with fluctuating lines and bars on a screen
A close view of a glowing white digital grid with curved lines that shift and move like waves across a dark background
Random light patterns
A graph rises on the screen
Close up of an electrocardiogram graph pulsing on a screen
A blurry close-up of a digital financial graph shows a downward trend indicating a market crash or economic recession
Close-up of a pixelated screen showing an animated bar graph with a positive upward trajectory
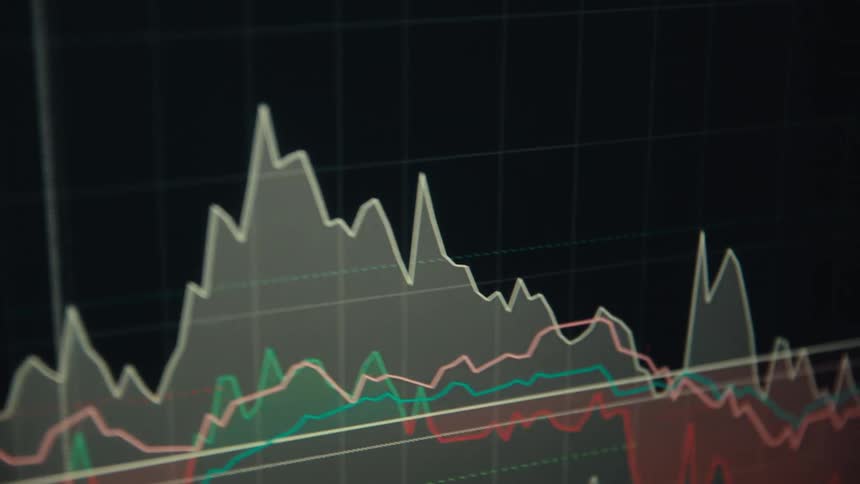
The screen is full of line graphs
Symmetrical digital animation of geometric shapes and lines forming intricate, kaleidoscopic patterns on a grid
A dark gridded screen displays glowing blue stick figures connected by lines and dots illustrating a network or social connection concept
Multi line plot and a candlestick chart share a computer screen
A vintage-style animation of a red bar graph on a black screen shows a positive upward trend
A close-up of a digital stock market chart shows a line graph rising in blue before turning red and crashing downwards
Extreme close-up of a digital screen displaying a bar graph with a downward-trending arrow, indicating a financial decline or market crash
Waves of light flow on a black background
A digital investment graph trend line shifting between going up and down as a stock trading market prognosis or index of the finance sector affected by the global economy in the darkness on black flickering retro computer screen
A financial graph with an upward trend arrow and bar chart rises on a digital screen, with smoke effects adding a mysterious atmosphere
Candlestick chart against a gray background
Cursor moves along the graph line on the screen
A dark screen displays a bright blue waveform fluctuating across a grid with various markers and dashed lines
A financial chart shows a volatile market trend with sharp rises and dips over time
A close-up of a red, pixelated bar chart with an upward trending arrow animates on a black digital screen, indicating positive growth

Need help finding the
right footage?

Have it delivered to your account within 1 business day.

This is Filmsupply

Our StoryOur FilmmakersArticlesFilmsPopular SearchesAll Categories

FM

A family of brands dedicated to empowering the creative.

FILMSUPPLY

Footage licensing for productions

MUSICBED

Music licensing for filmmakers

STILLS

Image licensing for creatives

© 2026 FM LLC.

Privacy PolicyLicense TermsTerms & ConditionsCareers