Musicbed
Filmsupply
Stills
Contact Us(800) 805-6802
Screen with indicators and symbols
A neon green retro monitor displays a chart showing the movement of a stock price with an arrow crashing with a dramatic downward or negative tendency or direction causing investors to lose money presented by data visualization
Person analyzing printed and digital charts
Green and orange colors of a candlestick chart contrast with the black background on a computer display
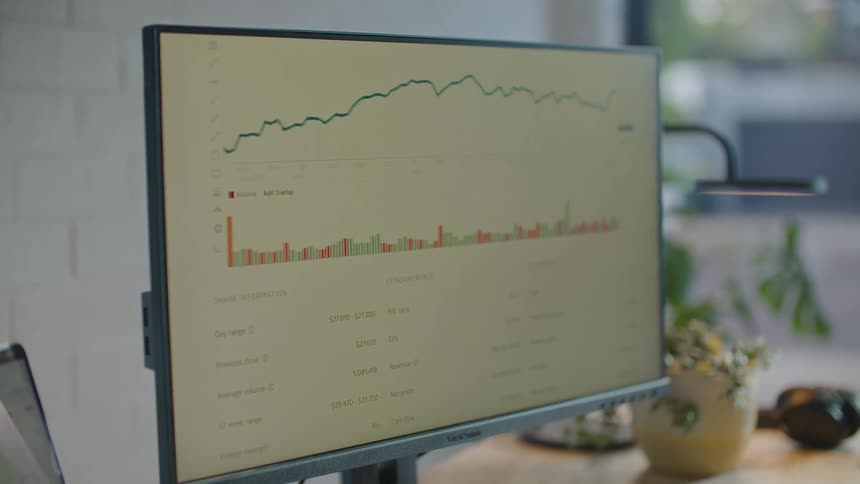
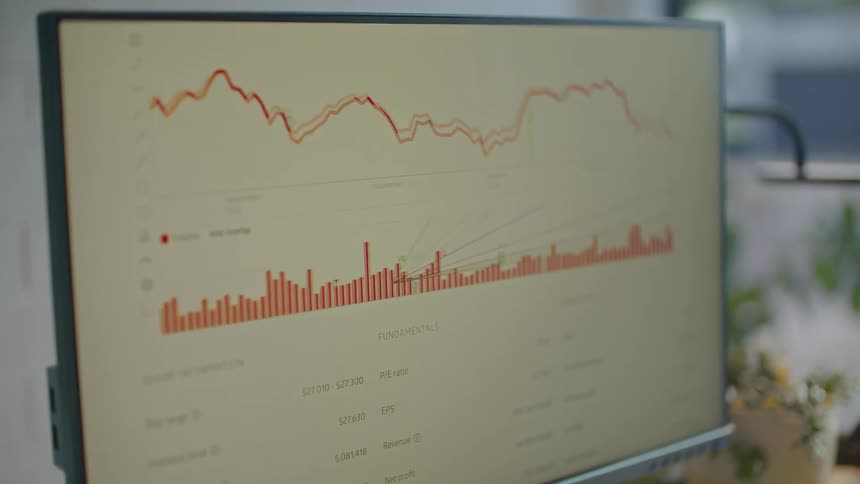
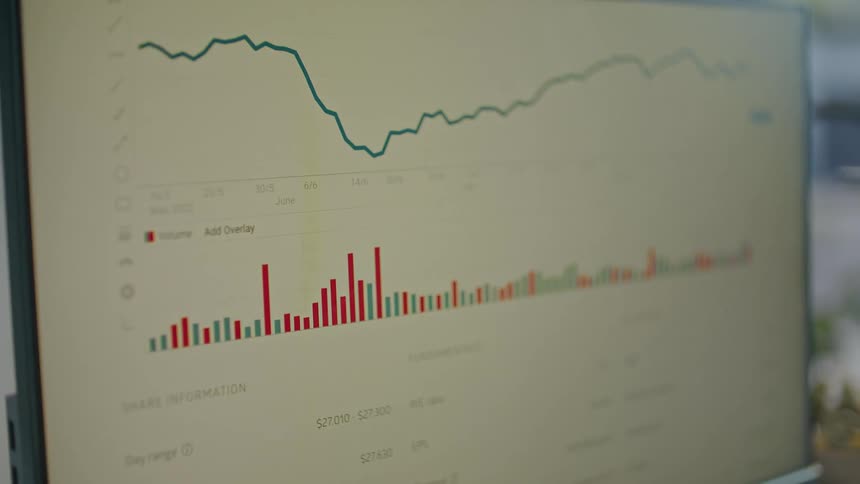
A chart showing the change in stock prices
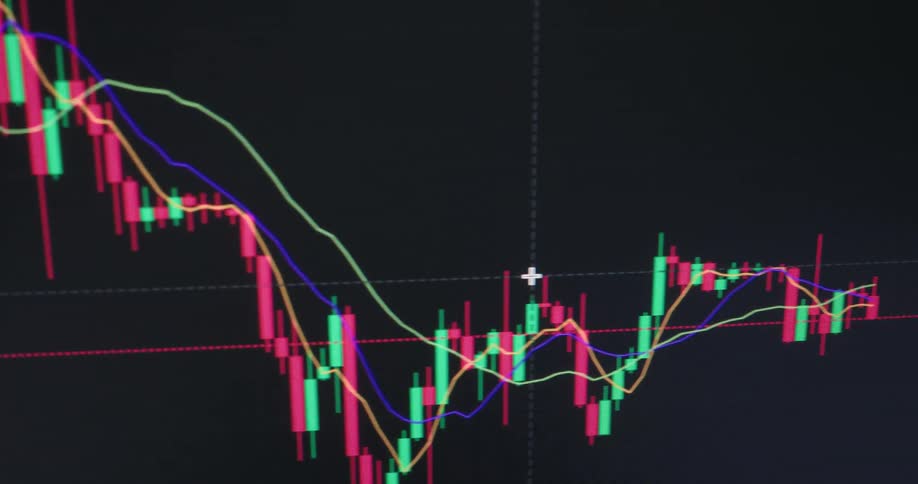
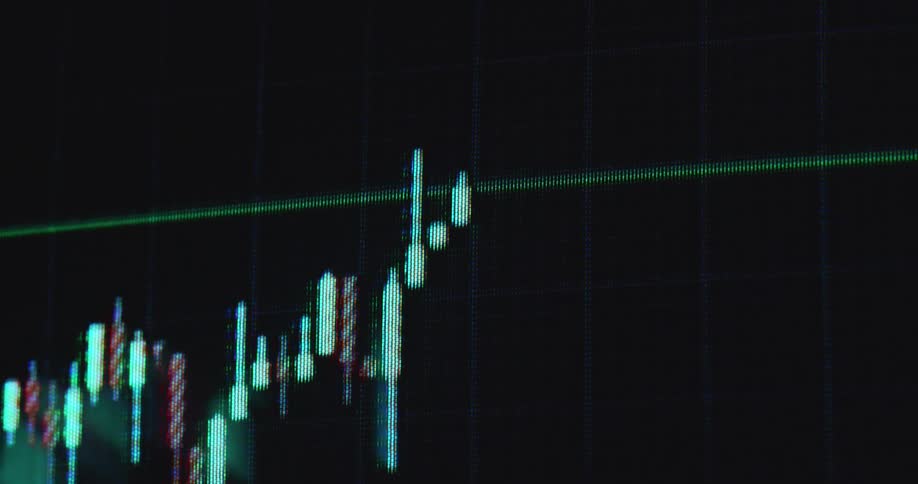
A close-up of a computer screen displaying a real-time candlestick chart for online stock, crypto, and forex trading
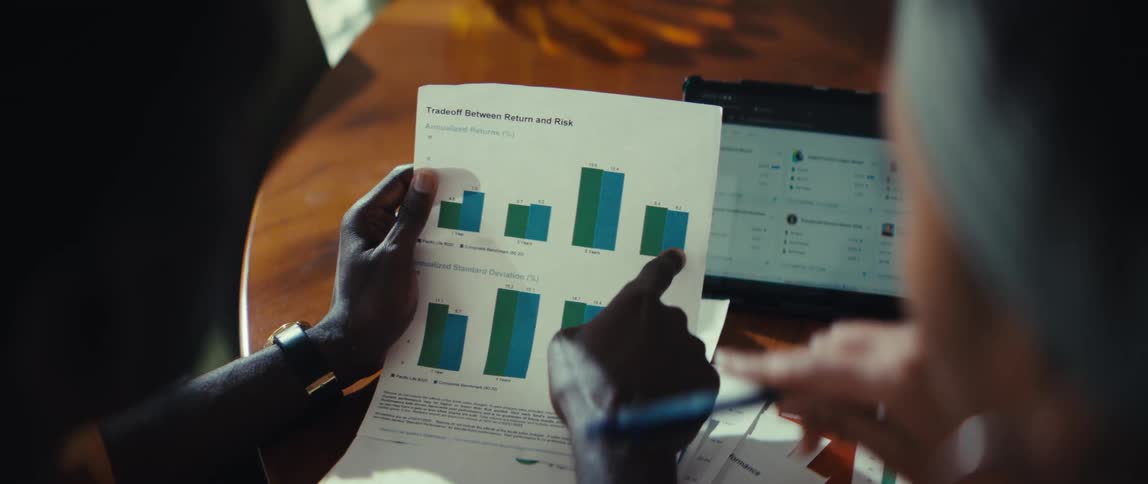
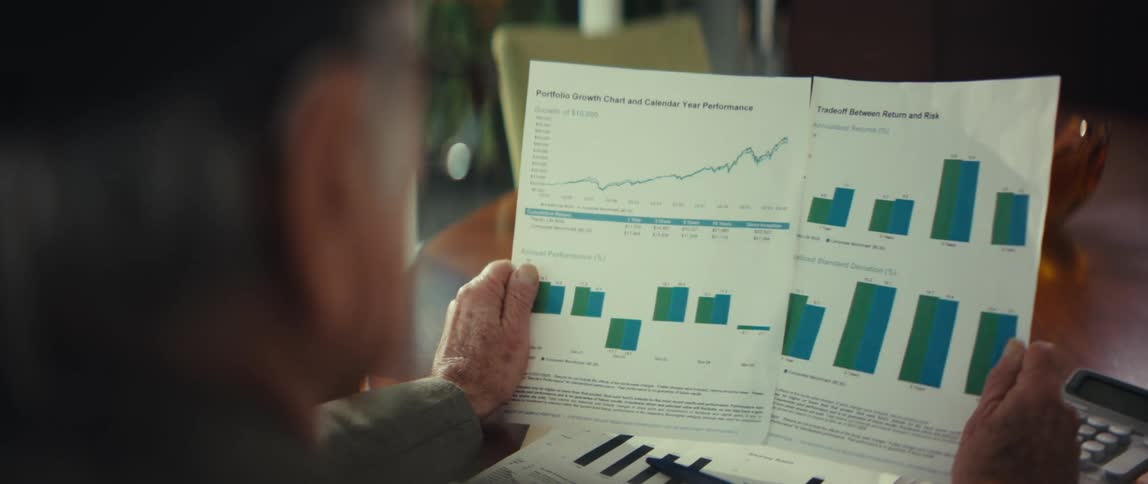
An over-the-shoulder view shows two business colleagues collaborating and analyzing a printed financial report with bar charts
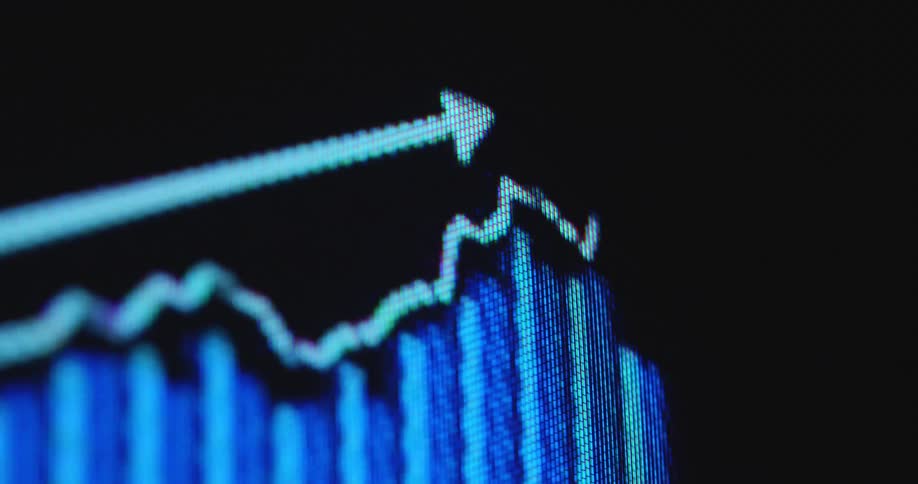
Digital pixelated graph with positive trendline going up showing growth and financial strength of the global or US economy or an economical upward trend while making progress and profiting from business opportunities
A man is sitting at a desk looking at a chart on a computer monitor and using a small portable calculator
A finger scrolls through a touchsceen
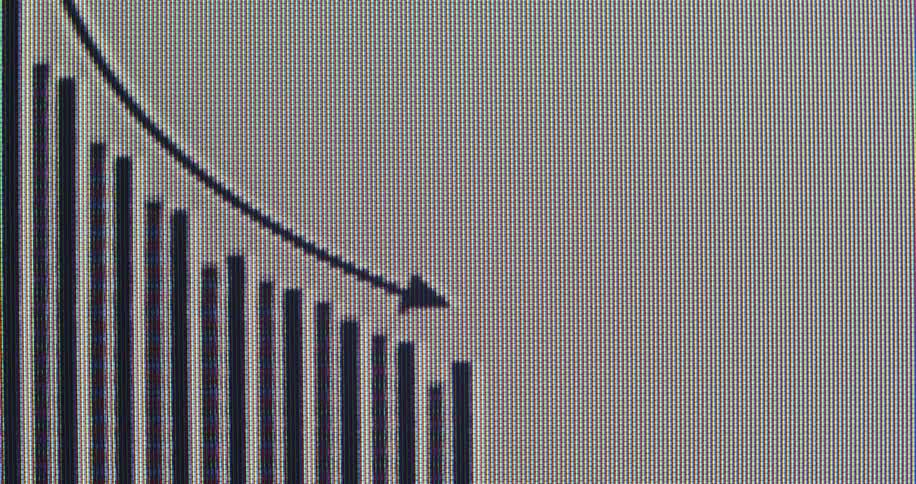
Extreme close-up of a digital screen displaying a bar graph with a downward-trending arrow, indicating a financial decline or market crash
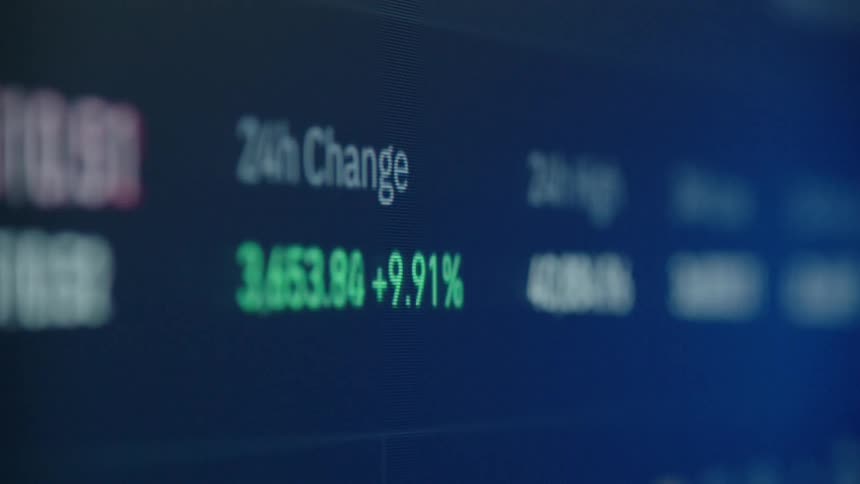
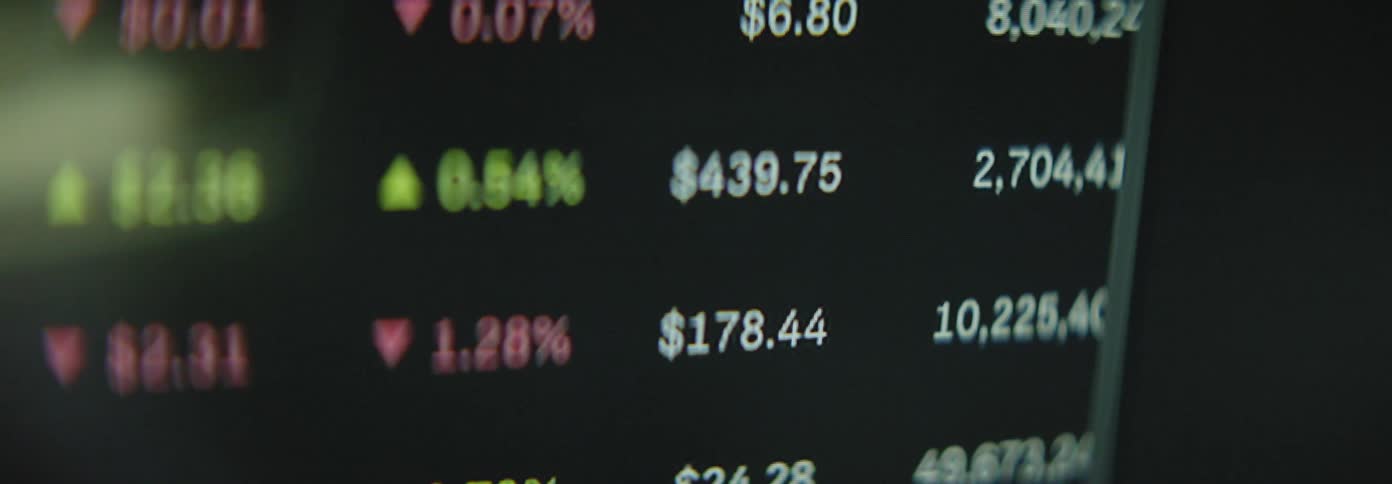
A closeup view of a stock market ticker displaying various stock symbols prices and percentage changes
The tablet display is full of numbers
Person working on a portable electronic device with a touch screen
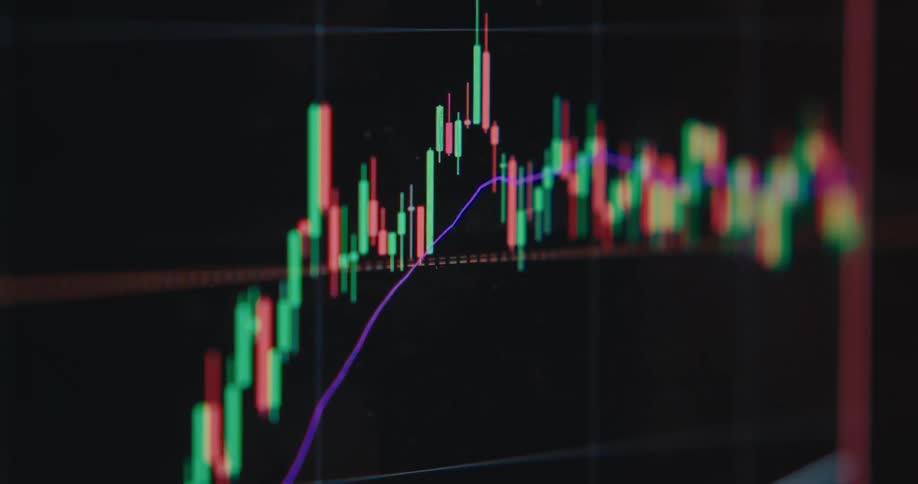
Close up of a candle diagram stock chart pattern on a digital RGB TV screen consisting of pixels and green and red candles as the graph rises with a positive upward tendency symbolising financial success and share trading
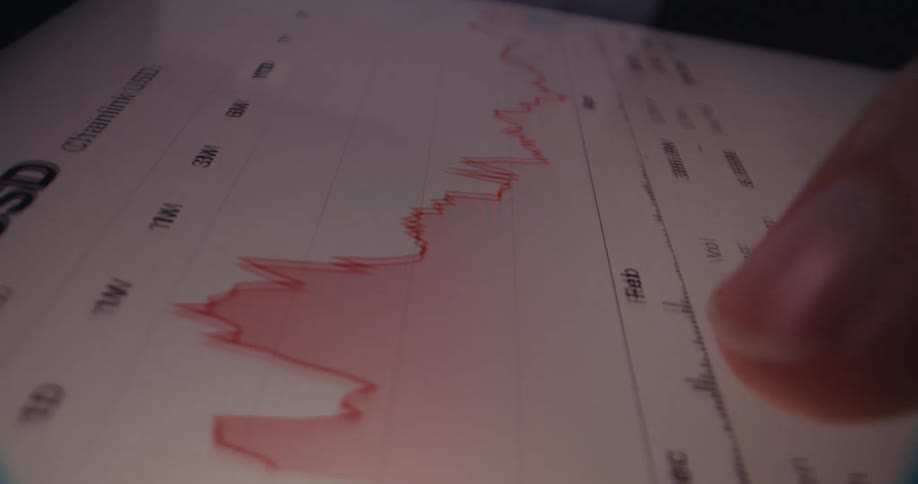
A finger traces a graph on a touchscreen
Charts are flashing on the computer screen
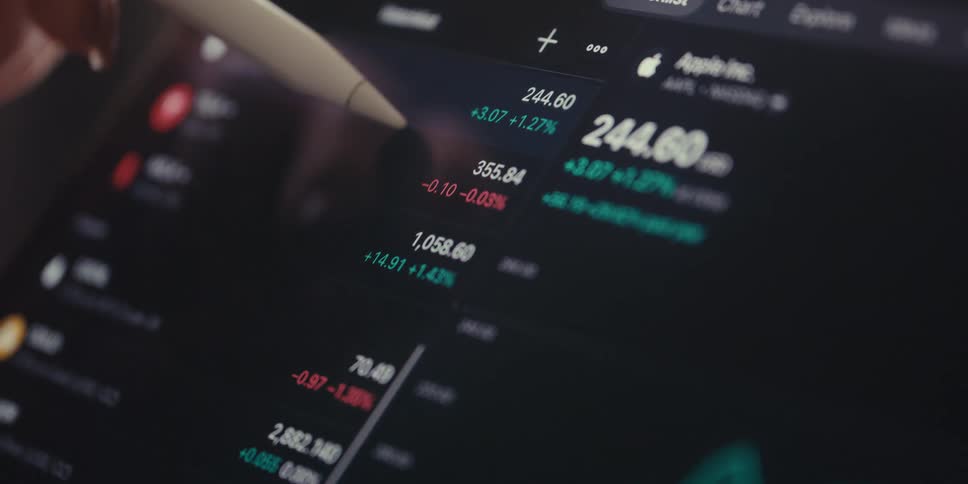
A digital pen pointing to financial data displayed on a screen with stock information for apple and other companies visible suggesting market analysis or trading
Pixelated candlestick chart on a screen or monitor panel forming a bullish flag pattern while the trading chart analysis shows that the graph is about to break resistance to the upside making the price of the stock or asset go up and increase in value
Close up view of a person browsing on their phone
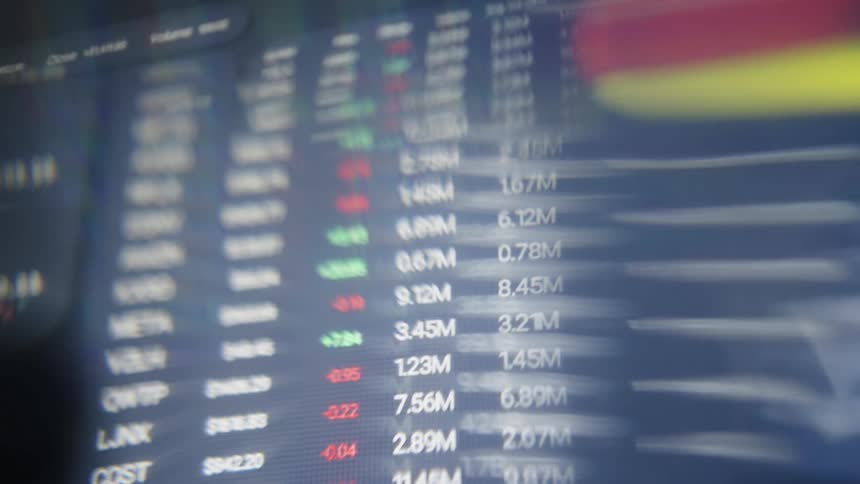
This video features a closeup blurred shot of a digital stock market ticker displaying fluctuating financial numbers and percentages the motion blur and shifting colors of red and green create a sense of fastpaced abstract data movement
An animated retro-style green bar chart with digital distortion shows a steep decline on a dark screen
Digitized trading graph crashes and falls down as the stock market collapses with a negative downward tendency into the red digits providing opportunities for new stock brokers and investment strategies in the equities or crypto currency market
Hectical macro shot with hand held camera movement of a financial candlestick trading chart crashing down into the red digits causing panic sales and fear of a recession or a rug pull as investors lose all of their money to online scammers
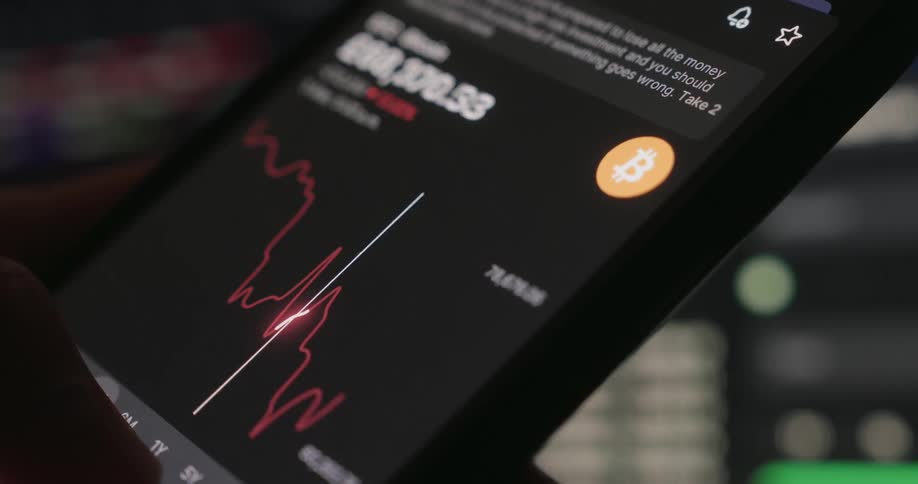
Cell phone screen with the graph of the value of bitcoins
Gold plated bitcoins on a reflective surface with a computer screen displaying a climbing graph
Handheld macro shot with dynamic camera movement of stock or crypto currency trading candlestick chart going up before crashing due to unexpected black swan event causing recession and economic depression on screen with grid and red candles
Close up of a device screen as a person swipes through currency charts in a trading application
An elderly man sitting indoors wearing glasses and reading a document at a coffee table
A close-up, out-of-focus shot of a blue digital line graph fluctuating on a dark screen, representing stock market data or financial trends
A blurry, abstract close-up of a green stock market chart on a digital screen, with graphs and data showing upward trends and growth
Finger scrolling on cell phone to see the detail of a graph of the value of bitcoins
A red fluctuating line graph rises across a blue digital screen toward a glowing targetlike marker
A computer in an office setting is displayed
An animated chart is displayed on a computer monitor
A clip of a digital chart
Macro shot of digital pixelated green trading line graph from an online finance application shifts up and down with the global economy in times of financial instability as it moves across the black screen of a flickering vintage tube TV
A close up of numbers and text animated on a screen
Extreme macro close-up of a computer monitor showing a bar graph with a downward arrow indicating a financial market crash, economic recession, or loss
Financial advisors review and analyze printed bar chart data on MPT statistics during a business meeting
A person scrolls through various stock market charts on a smartphone app checking fluctuating prices with a television on in the background
A finger moves a dot along a graph
A clip of a digital chart
A look at a screen of stock market prices
Finger points to a highlighted point on a line graph showing variations in financial values
A pixelated smartphone or display device screen or monitor shows the user interface of a finance app or online broker and trading platform for buying and selling stocks and crypto currencies such as Bitcoin or ETH as the trading chart moves up
Extreme close-up macro shot of a blue financial bar graph on a computer screen with a white arrow indicating a downward trend
Close-up of a real-time digital stock market candlestick chart showing a bullish upward trend on a computer screen
Multiple data points at different values are continuously plotted next to a candle chart of a stock or crypto currency trading graph in a finance application or app on a dark pixelated computer screen
A financial analyst compares data from a printed report with a live stock market chart on a laptop screen
The bar graph goes up and down across the entire computer screen
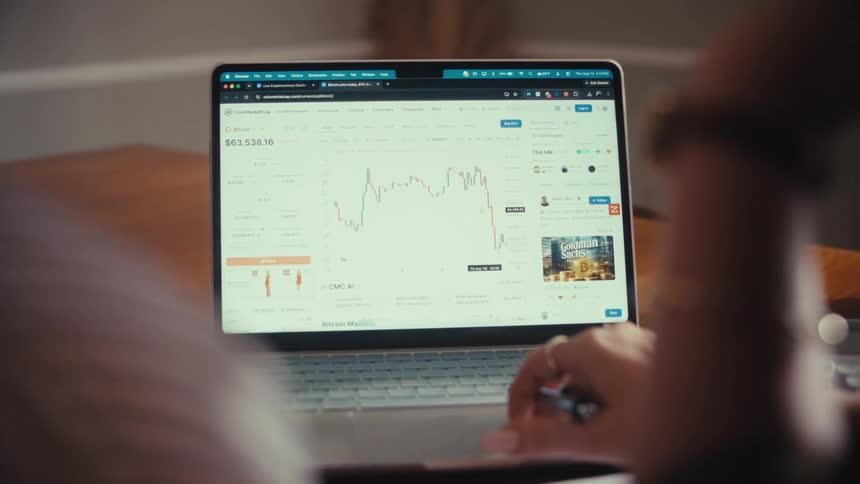
Over-the-shoulder view of a person monitoring the Bitcoin cryptocurrency price chart on a laptop screen
Numbers representing stock information change on the screen
A candlestick chart or trading graph animation showing a stock price or crypto currency rising over time with exponential growth and a positive trend or development on a dark computer screen with RGB pixels as symbol for a growing shares or bond market
A stylus pen points to and scrolls through various financial figures cryptocurrency market caps for usdt and xrp and fluctuating line graphs displayed on a dark digital screen in a dimly lit room
A computer screen shows a website with a graph
A digital dashboard displays various animated stock market tickers charts and graphs in a dark mode interface
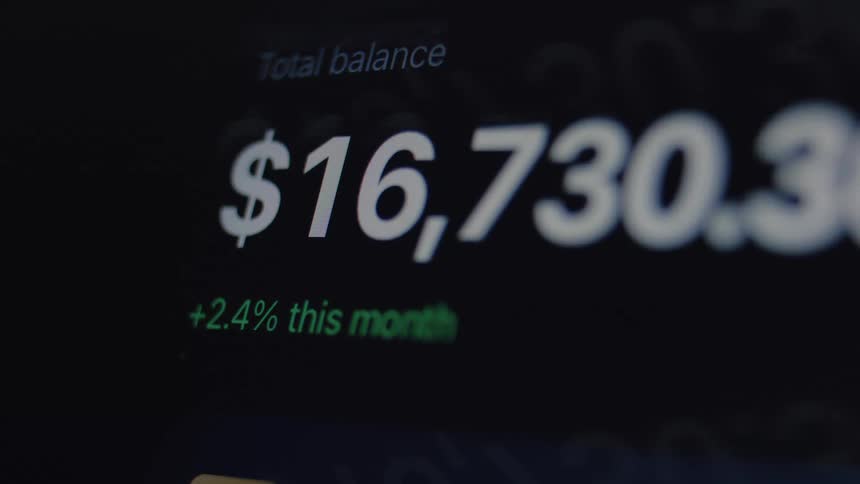
A close-up of a digital financial account where the total balance flashes red, indicating volatility or a warning
Extreme macro shot of a digital bar chart with a downward-pointing arrow, symbolizing financial crisis, decline, and loss
A graph is moving across a computer monitor screen
Macro view of a digital screen showing a white animated financial graph and arrow moving upwards on a black background
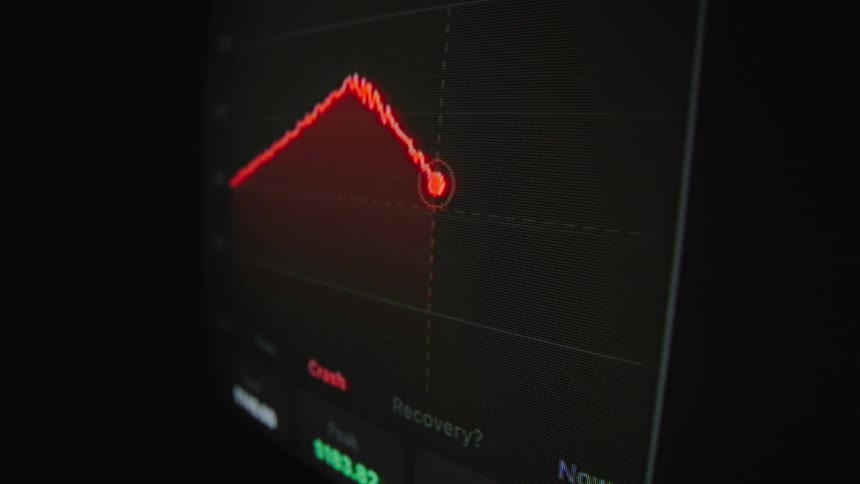
Close-up on a digital stock market chart showing a sudden and dramatic price crash after reaching its peak
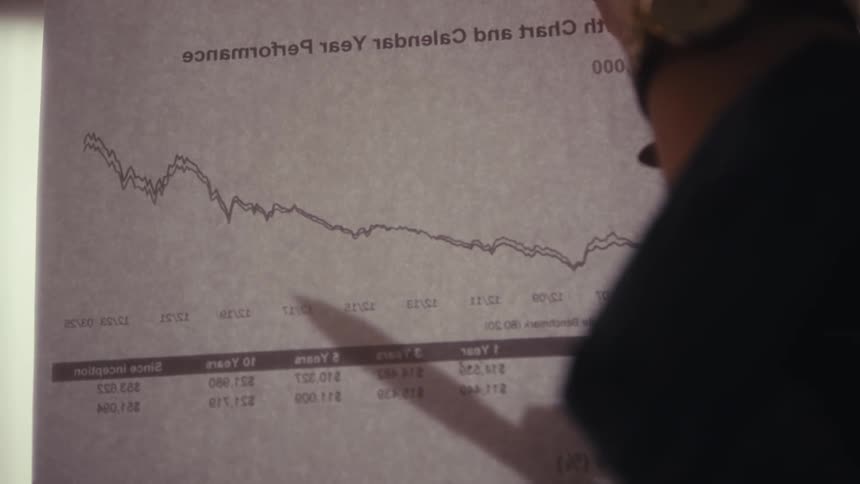
Person points to a specific section of a declining chart printed on paper

Need help finding the
right footage?

Have it delivered to your account within 1 business day.

This is Filmsupply

Our StoryOur FilmmakersArticlesFilmsPopular SearchesAll Categories

FM

A family of brands dedicated to empowering the creative.

FILMSUPPLY

Footage licensing for productions

MUSICBED

Music licensing for filmmakers

STILLS

Image licensing for creatives

© 2026 FM LLC.

Privacy PolicyLicense TermsTerms & ConditionsCareers