Musicbed
Filmsupply
Stills
Contact Us(800) 805-6802

Market Analysis Stock Video Footage

Licenses 1431 high quality Market Analysis stock video clips in 4K, raw formats

Digital devices screen macros

Father & Sun

Animations on pixelated computer screen

Philip Casey

US Currency

Nick Midwig

New York Time Lapses

Lumixar

Burning Objects

Evolve
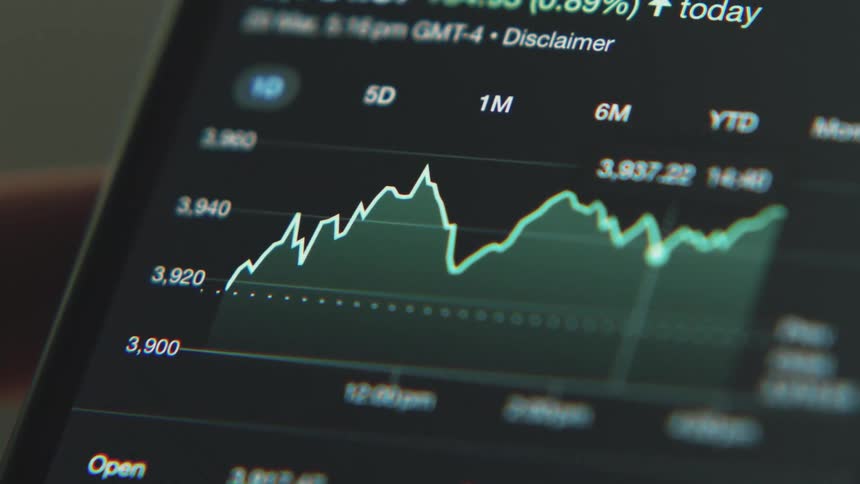
A stylized, out-of-focus close-up of a digital stock market chart showing fluctuating data with glowing lines
A bar and line graph shows an upward trend with an arrow emphasizing growth and increasing savings on the bank account for a solid retirement due to a successful pension plan and long-term investment strategy
A line graph is displayed on the monitor
The video features a closeup cinematic shot of various financial data charts and candlestick graphs flickering across a digital screen it captures the fastpaced atmosphere of stock market trading through shifting focus and vibrant multicolored data v
Graph and numbers moving on the screen of a smart phone
A person scrolls through stock market data on their phone
Cursor moves along the graph line on the screen
Gold plated bitcoins on a reflective surface with a computer screen displaying a climbing graph
A phone floats in a colorful ring
Screen displays pink and green graph lines on a grid
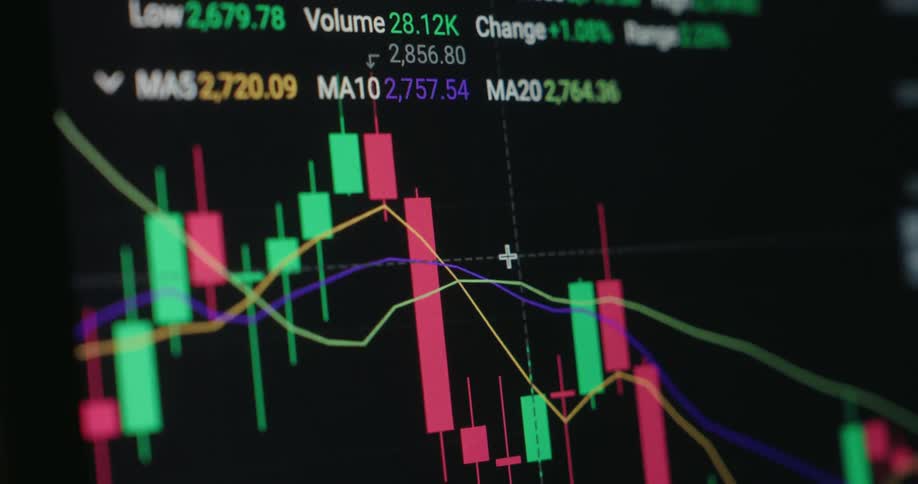
An abstract, out-of-focus animation shows a volatile candlestick chart with red and green bars moving on a digital grid
A red arrow moves upwards across the screen as a bar graph animation is forming beneath it presenting statistical data and visualizing the dramatic increase of prices and production costs
Closeup of a digital trading graph with fluctuating lines and bars on a screen
Close up of an electronic screen displaying a trading interface with blue candlesticks against a dark background

US Currency

Nick Midwig

A close-up macro view of a financial candlestick chart with red and green bars fluctuating on a digital screen
Person selects time intervals and points on graph on phone display
A footage of a digital trading screen
A person is pointing to a chart on the monitor
Close up of a device screen displaying a trading interface table scrolled through
A few coins with the bitcoin cryptocurrency logo on them are partially buried in black powder
A close-up, out-of-focus animated financial chart shows fluctuating stock market data with glowing lines and candlestick patterns
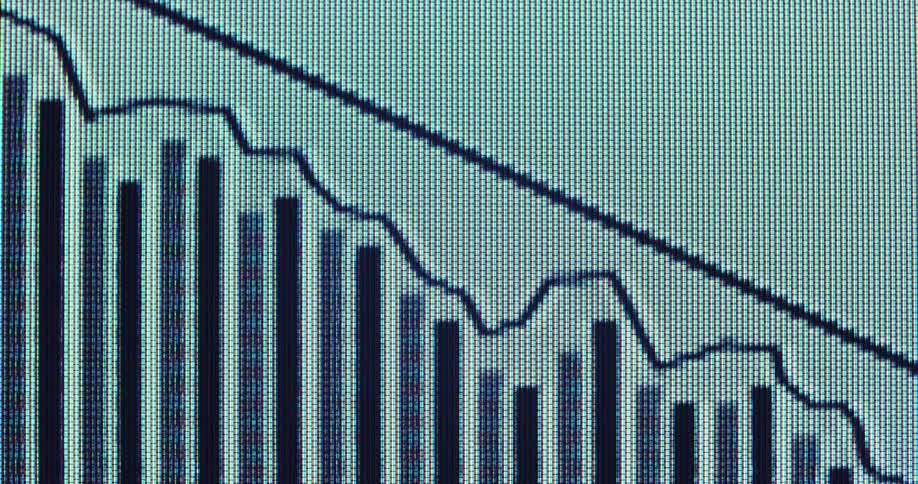
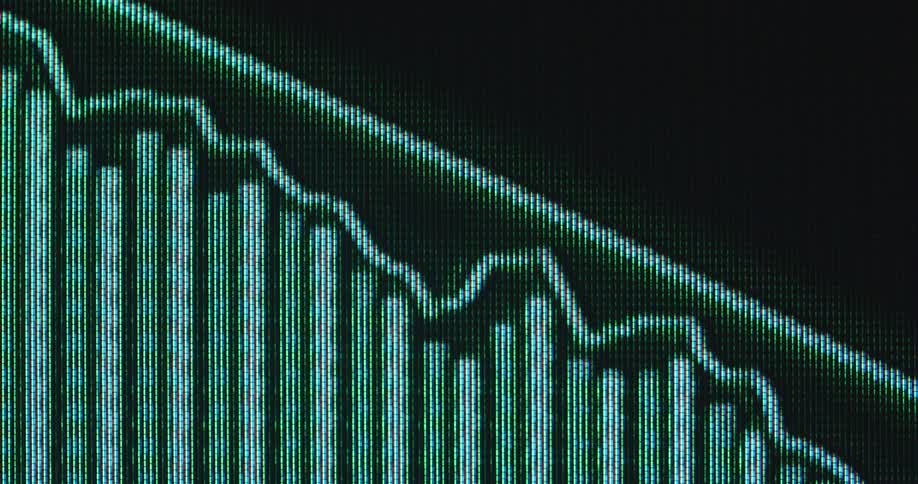
Extreme macro view of a digital screen with RGB pixels shows a black line graph with a downward pointing arrow overlaying vertical black bar charts representing a stock market crash or economic downturn with negative trend
A financial chart shows a volatile market trend with sharp rises and dips over time

New York Time Lapses

Lumixar

Burning Objects

Evolve
Financial candlestick chart against a gray screen
A macro close-up of a blue digital stock market or cryptocurrency chart on a screen showing real-time price volatility and fluctuations
Cryptocurrency graphs on a laptop screen near a tablet scrolling up and down
A high-tech digital animation shows a fluctuating green line graph on a stock market or cryptocurrency exchange chart with data analysis overlays
A man is typing on his laptop
A graph rises on the screen
Stock related data is scrolled over on a screen
A blurry, abstract animation of a candlestick chart showing stock market or cryptocurrency volatility on a digital screen
A financial graph with an upward trend arrow and bar chart rises on a digital screen, with smoke effects adding a mysterious atmosphere
A smartphone screen displays various stock market charts rapidly changing between green upward trend and red downward trend graphs for different companies and indices
A display showing charts of a stock price
An out-of-focus close-up of a live stock market or cryptocurrency candlestick chart showing real-time price fluctuations

Graph on smartphone displays data for series of points on the plot
A stock chart on a computer screen
Small stack of gold bitcoins on a counter against green lights background
The screen displays numbers and percentages
A person uses a stylus to draw a circle around text on a touch screen tablet
An abstract, glowing line graph fluctuates over a blurred candlestick chart, visualizing the volatility of the financial stock market
The neon green graph forms an old 90s computer screen showing a vintage user interface of a stock trading platform or exchange as the commodity and equity prices crash and a global recession hits the finance markets
Price chart of a stock displayed on a screen
A computer monitor displays a candlestick chart of a stock price with the graph actively scrolling to the right
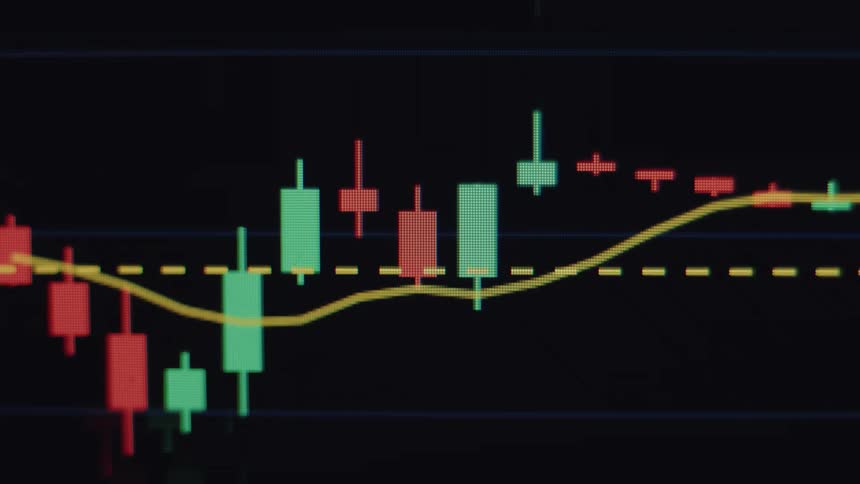
A detailed, close-up view of a live financial candlestick chart showing market volatility with moving green and red bars
A close up of a cell phone screen with a graph displayed and numbers
A graph screen with pink and green bars
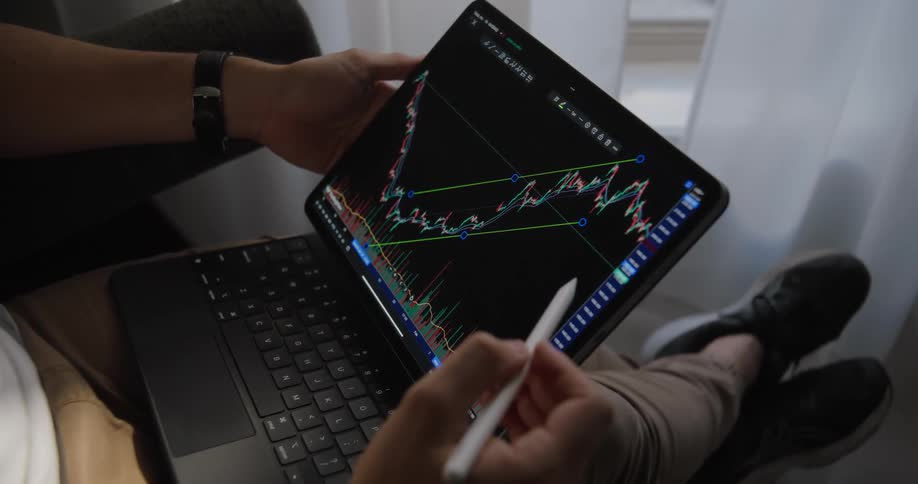
A man is using a stylus on his tablet
Multiple rows of graphs and numbers quickly scroll by on a screen
Gold bitcoin standing on a mound of black particles
An abstract, out-of-focus animation of a digital stock market chart shows fluctuating data and glowing trend lines
A candle diagram graph plots an array of data on a pixel screen with numbers representing rising and falling real estate prices or changes in the stock market or crypto currency finance sector
Price variation chart with green and red lines showing financial values
Colorful candlestick chart against a background
A futuristic blue and purple infographic on a screen shows financial data by continent
A graph on a computer screen is displayed
A chart moves around on the computer screen
Overlapping line and candlestick charts display intense financial fluctuations
A financial trading graph with colorful lines displaying market trends
Multiple plots in blue and red are scrolled over against a black background
A blurry, close-up view of a digital stock market chart with fluctuating line and candlestick graphs on a screen
Frontal macro close up of computer monitor or screen panel displaying the user interface of a stock broker or crypto currency trading exchange as a financial investment chart or data graph is going down with a negative price development
Closeup of a computer screen displaying realtime stock market charts and financial data

Need help finding the
right footage?

Have it delivered to your account within 1 business day.

This is Filmsupply

Our StoryOur FilmmakersArticlesFilmsPopular SearchesAll Categories

FM

A family of brands dedicated to empowering the creative.

FILMSUPPLY

Footage licensing for productions

MUSICBED

Music licensing for filmmakers

STILLS

Image licensing for creatives

© 2026 FM LLC.

Privacy PolicyLicense TermsTerms & ConditionsCareers