Musicbed
Filmsupply
Stills
Contact Us(800) 805-6802
Multiple plots in blue and red are scrolled over against a black background
Financial market candle chart against abstract background
Man and woman discuss stock numbers on large digital display in dark room lit by single bright blue light
A hand uses a stylus to interact with a stock market graph on a tablet
The screen displays numbers and percentages
Glowing green and red digital line graphs display financial data on a dark background
Extreme close-up macro shot of a blue financial bar graph on a computer screen with a white arrow indicating a downward trend
A series of cryptocurrency price lists displayed on a stock market website on a computer screen
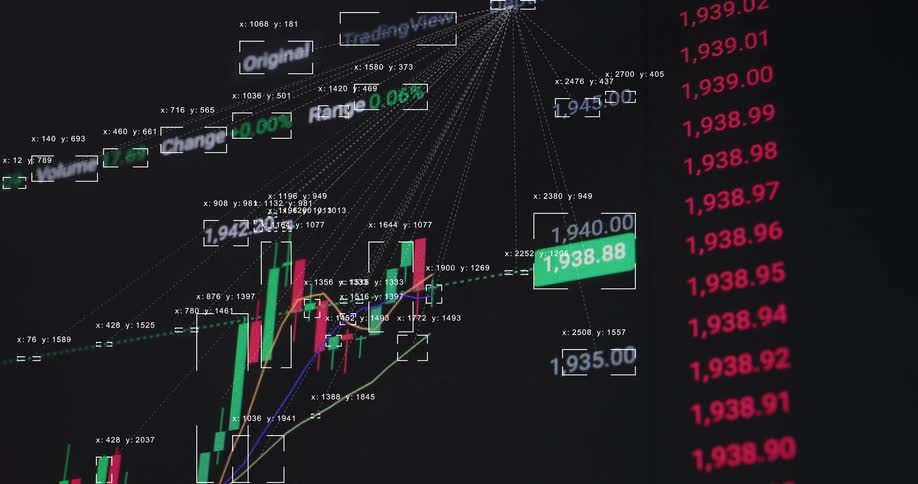
A financial trading graph with colorful lines displaying market trends
An animated candlestick chart on a digital screen displays fluctuating stock market or cryptocurrency data and analytics
Retro computer monitor or screen displaying a neon green growing graph of a vintage broker or trading software enabling users to buy and sell stocks online in order to make profit and earn money and invest for their future
Rapidly changing digital financial data scrolls across a screen in a dark, abstract view
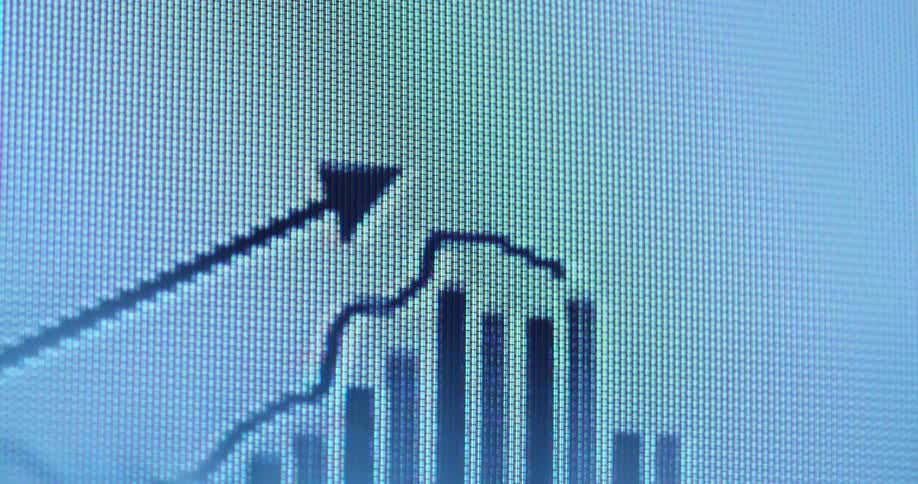
Macro close-up view of a digital screen shows an animated graph with a rising line chart and an upward pointing arrow overlaying vertical bar charts representing market growth or financial success on a white computer screen background
Screen displaying bearish financial market graph as candlestick chart crashes while stock and crypto currency markets decline and assets lose their value due to drastically decreasing and falling prices causing panic sales and recession with volatility
An american one hundred dollar bill
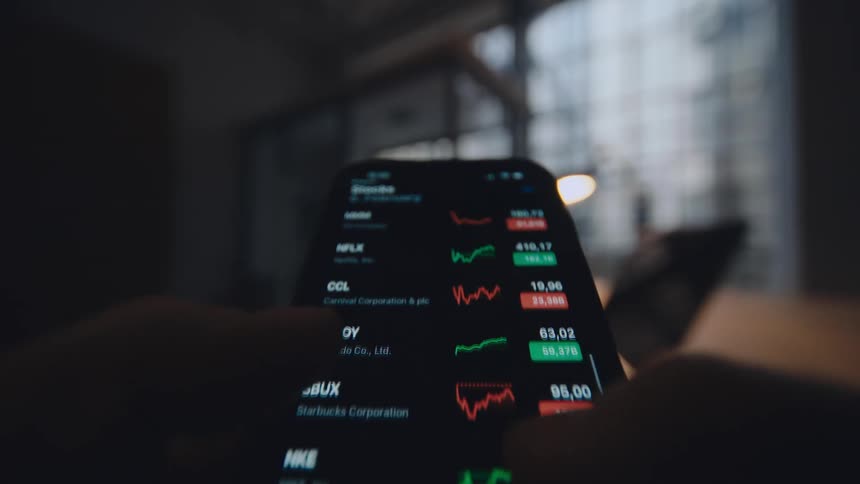
Scrolling through the phone
Red and neon green glowing candles create a bullish candlestick chart pattern with upward movement and positive price development as symbol for a healthy commodity or equity market or profitable stock or crypto trades via online broker app
Pixelated RGB computer or display device screen presenting a candlestick trading chart with positive exponential price development as the green candles go up indicating a healthy global economy and stock market reaching new all-time highs
Screen of a portable electronic with numbers and graphs
Black swan event hits global economy or financial markets causing crash crisis or meltdown and stocks and shares or other investments collapse into red digits or figures causing panic and massive losses followed by economic recession and bear market
A digital screen shows a volatile stock market or cryptocurrency candlestick chart with a line graph fluctuating up and down
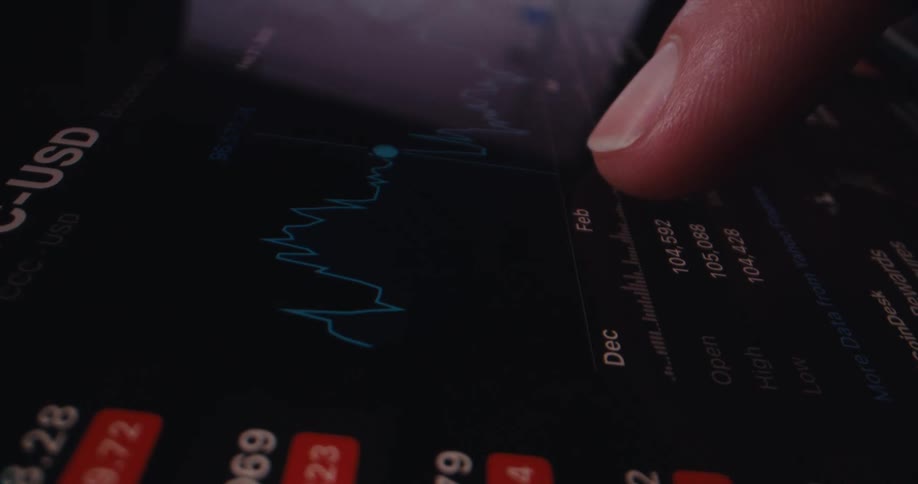
Close up of a device screen as a person swipes through currency charts in a trading application
A finger scrolls through a touchsceen
A vintage-style animation of a red bar graph on a black screen shows a positive upward trend
Financial market candle chart against a gray screen
President on a dollar bill
The numbers move fast on the monitor
A graph rises on the screen
A graph speeding through the evolution in price of a stock over several years
Computers screens are full of information
White and blue lines
Extreme macro close-up of a pixelated candle of candlestick trading chart changing between the colors green and red as symbol for volatility and uncertainty in the financial markets while the price of the stock or cryptocurrency rises and falls
The candlestick trading chart or graph steadily rises with a positive upward tendency and trend showing the price development of the MSCI World or S&P 500 or another ETF as a store of value and protection against inflation
Closeup shots of computer and laptop screens showing realtime stock market fluctuations
Pixelated macro close-up of a digital screen showing the user interface of an online trading platform or finance app or broker application displaying a candlestick chart or graph with green candles as the price increases and goes up with a positive trend
Small lines form image on american paper money
Benjamin franklin on united states one hundred dollar bill
Person working on a portable electronic device with a touch screen
A currency bill is slowly lit up
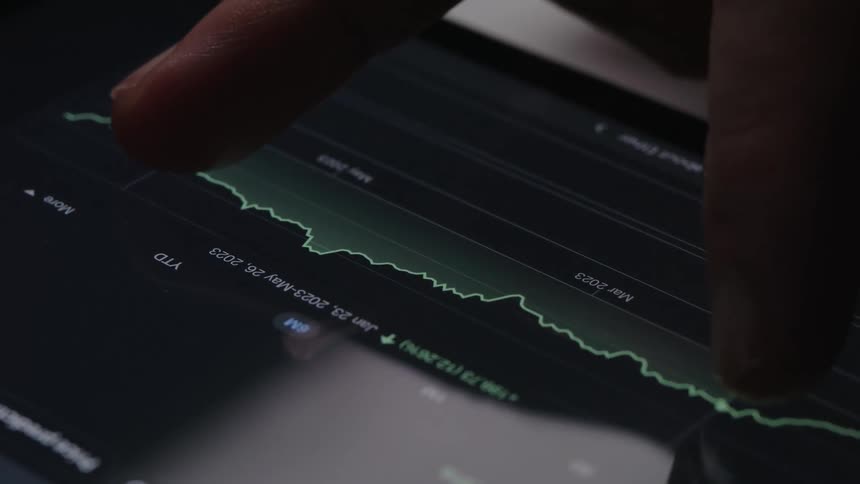
A finger traces a graph on a touchscreen
Informational graphs cover the computer screen
Woman examines the plot of a stock on a smartphone
Price variation chart with a red line followed by a green line over time
A green rising digital bar chart appears on the computer screen symbolizing financial freedom and success due to economical growth and an upward trend of the global economy and digital stock markets and crypto trading platforms
Closeup of a screen displaying distorted stock market data
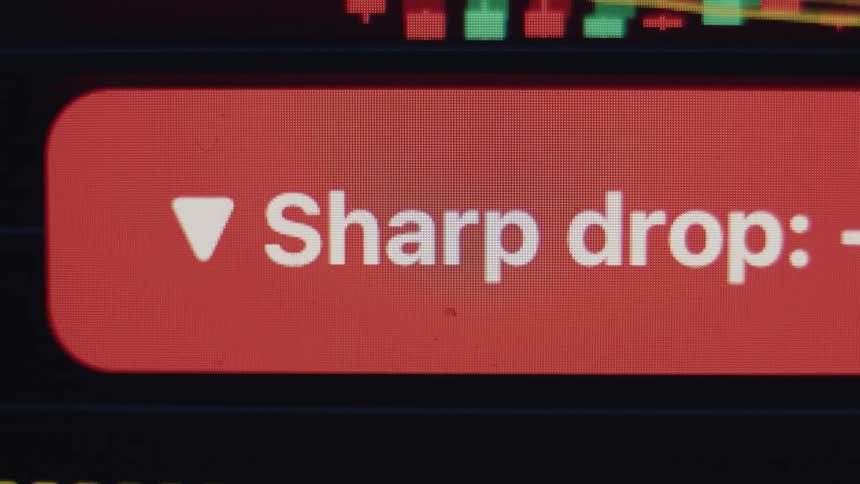
A macro shot of a financial chart on a screen displaying a red 'Sharp drop' notification indicating a market crash
Cryptocurrency graphs on a laptop screen near a tablet scrolling up and down
A close-up, out-of-focus shot of a blue digital line graph fluctuating on a dark screen, representing stock market data or financial trends
This video features a closeup blurred shot of a digital stock market ticker displaying fluctuating financial numbers and percentages the motion blur and shifting colors of red and green create a sense of fastpaced abstract data movement
A person puts their fingers on their cellphone screen
A large computer monitor shows a graph with zigzag lines and numbers
A computer screen shows a website with a graph
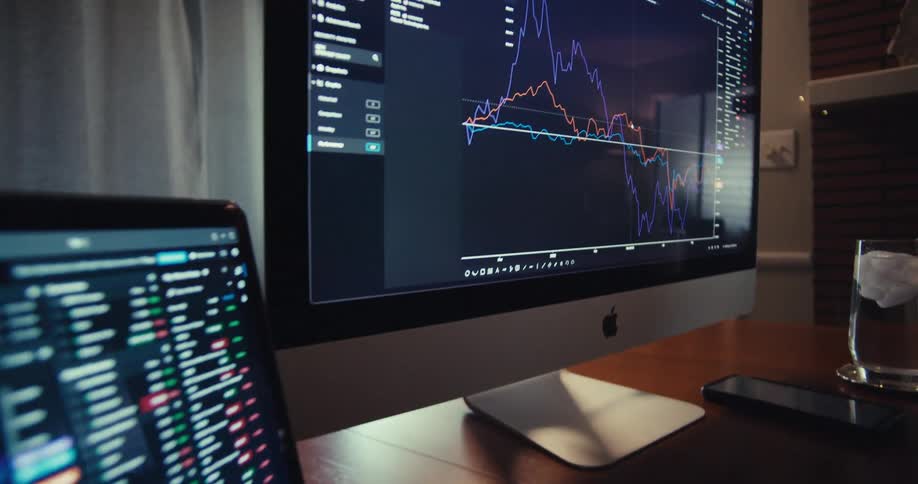
A screen with red and blue graphs
Walking down a hall while scrolling on a phone
A close-up, shallow depth of field shot of a colorful candlestick graph displaying fluctuating financial market data on a screen
A closeup shot reveals multiple stacks of one hundred dollar bills each held together by a tenthousanddollar currency band
Close up of the artwork on various england bank notes
A neon green retro monitor displays a chart showing the movement of a stock price with an arrow crashing with a dramatic downward or negative tendency or direction causing investors to lose money presented by data visualization
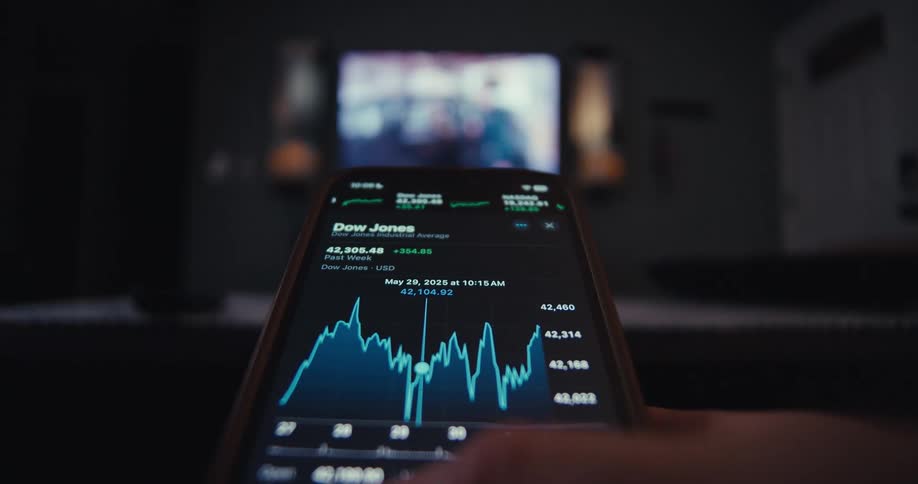
pov close up of smartphone screen while person is scrolling through stock market data 2
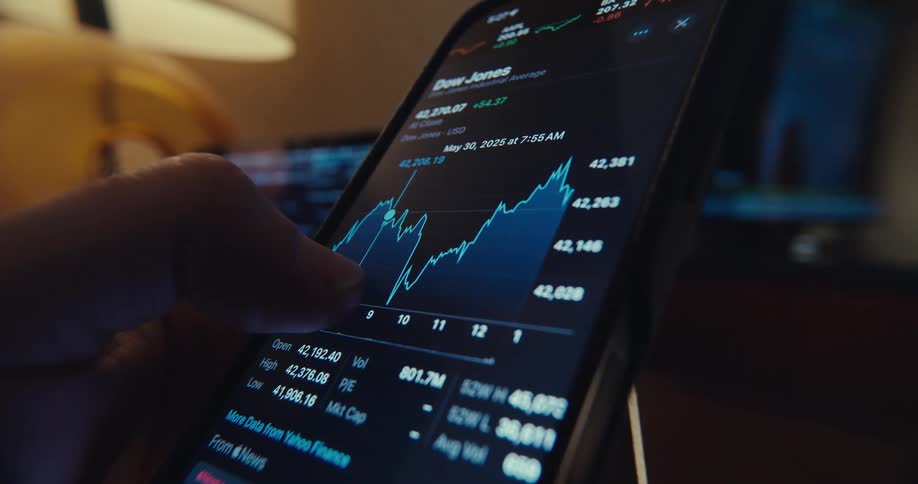
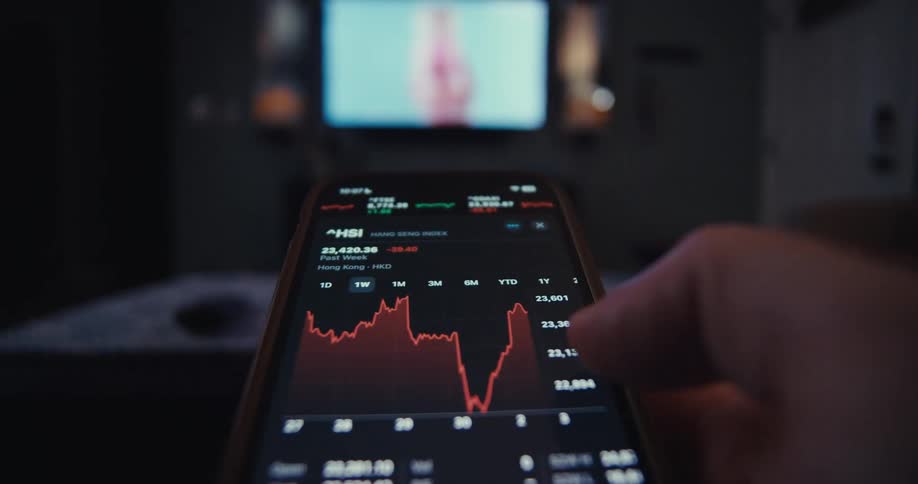
In a dimly lit room a finger scrolls through a fluctuating red stock market graph on a smartphone with a television glowing in the background
Falling financial market chart against a background of abstract numbers
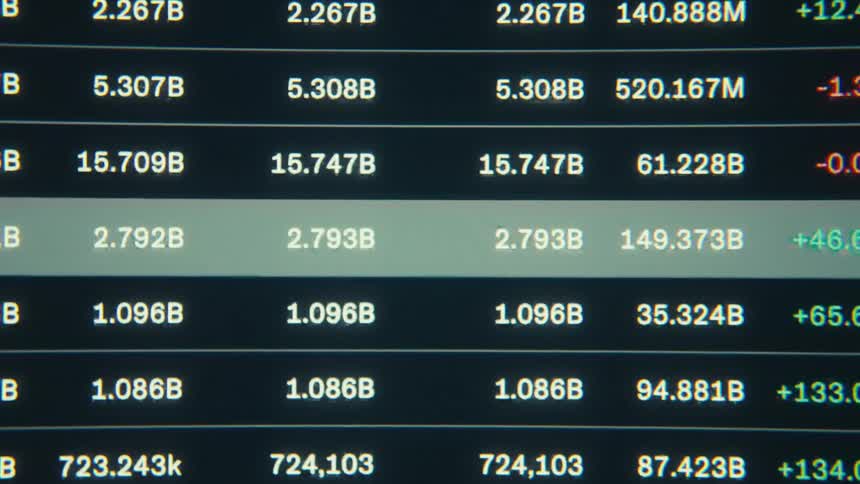
Digital quotation table showing values percentage changes and market charts
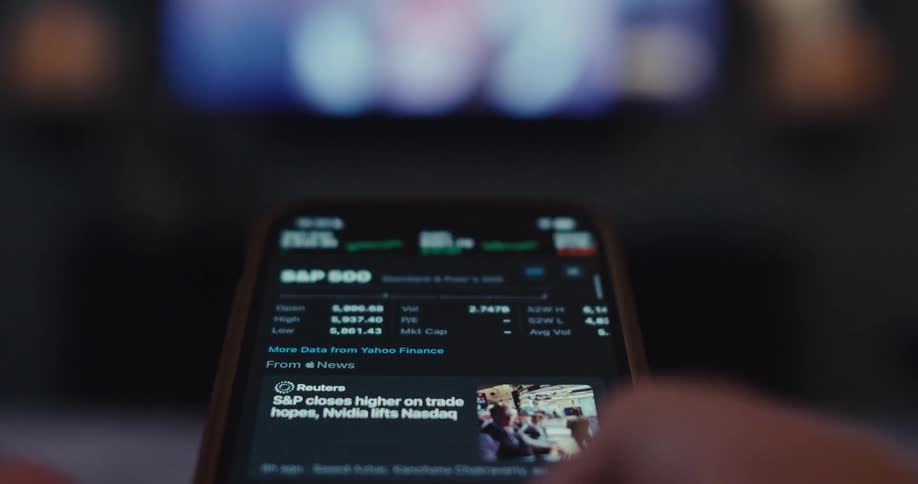
A smartphone shows a stock chart with a blurry tv in the background

Need help finding the
right footage?

Have it delivered to your account within 1 business day.

This is Filmsupply

Our StoryOur FilmmakersArticlesFilmsPopular SearchesAll Categories

FM

A family of brands dedicated to empowering the creative.

FILMSUPPLY

Footage licensing for productions

MUSICBED

Music licensing for filmmakers

STILLS

Image licensing for creatives

© 2026 FM LLC.

Privacy PolicyLicense TermsTerms & ConditionsCareers