Musicbed
Filmsupply
Stills
Contact Us(800) 805-6802
A dollar bill sits on a stack of other bills
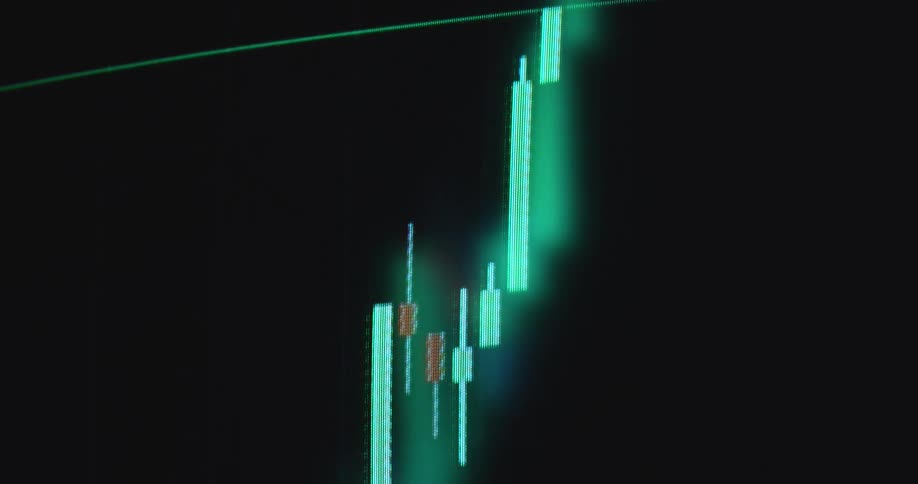
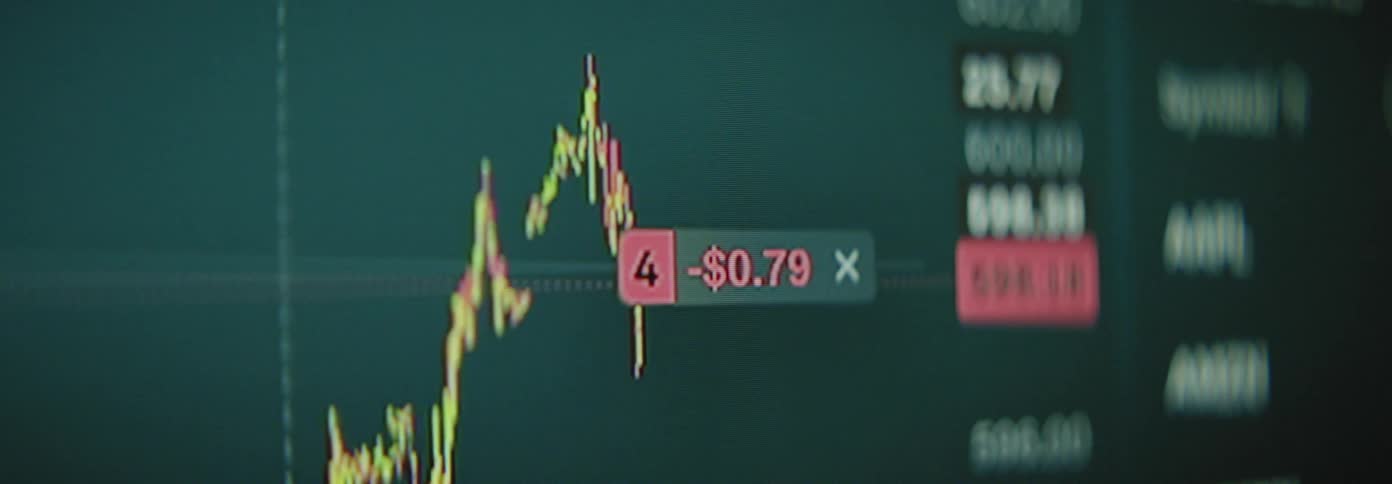
Retro Macintosh computer screen displaying financial market chart of an online trading platform or broker application for buying stocks or shares with bright neon green candles as the price goes up or increases with a positive trend
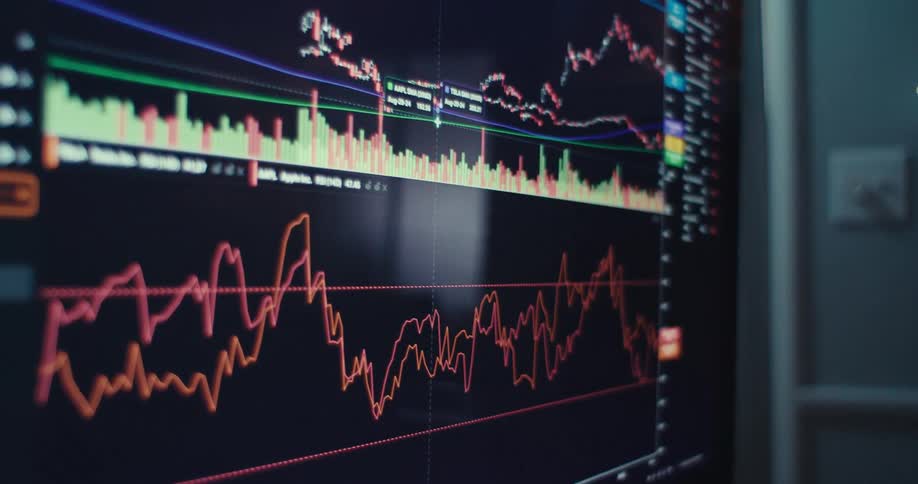
A computer screen displays fluctuating stock market charts and trading data
Charts of currencies rising and falling
A macro close-up of a blue digital stock market or cryptocurrency chart on a screen showing real-time price volatility and fluctuations
An open suitcase filled with stacks of money slowly rotates
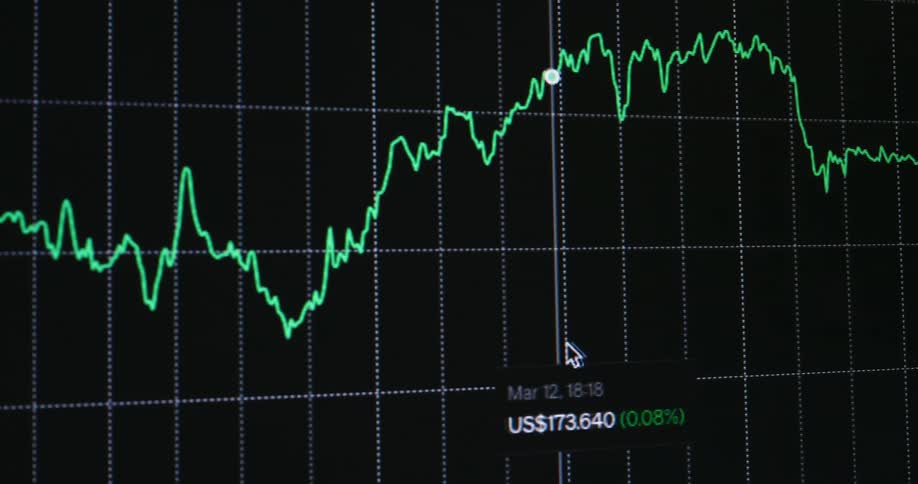
A line graph moves left to right on a laptop screen
A computer monitor displays a candlestick chart of a stock price with the graph actively scrolling to the right
A blurred, close-up, and stylized animation of a digital stock market chart with glowing lines and fluctuating data
An abstract, glowing line graph fluctuates over a blurred candlestick chart, visualizing the volatility of the financial stock market
United states bank notes piled on a flat surface
A red arrow moves upwards across the screen as a bar graph animation is forming beneath it presenting statistical data and visualizing the dramatic increase of prices and production costs
Graphs flash on the screen
Futuristic digital display shows a dynamic candlestick chart of stock market or cryptocurrency trading with algorithmic analysis
A close-up of a digital candlestick chart on a screen shows financial data fluctuating in real-time
The screen displays numbers and percentages
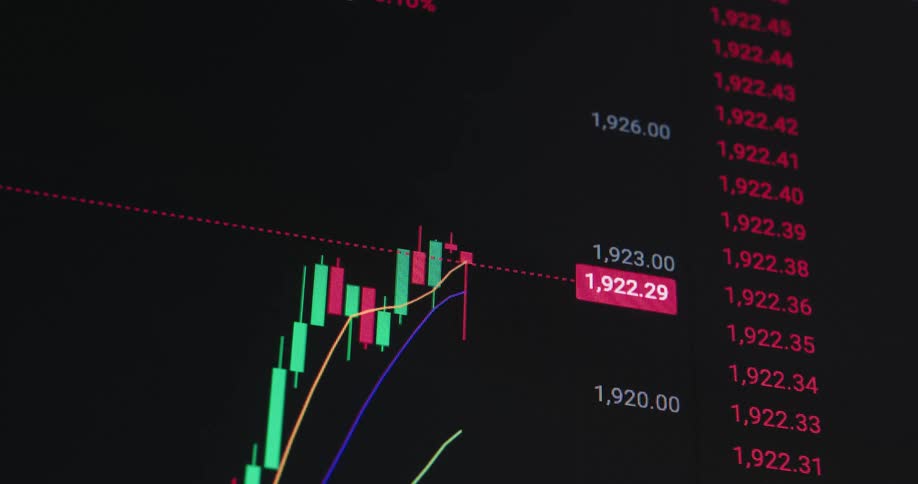
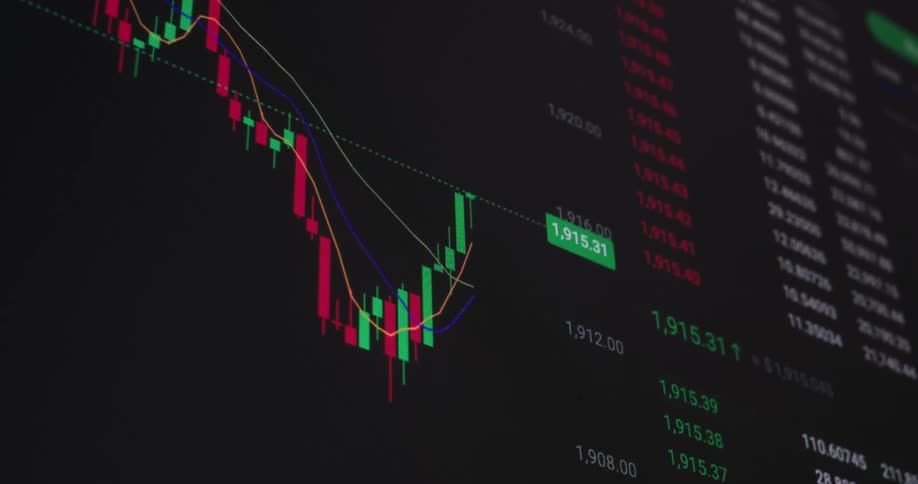
Candlestick chart of a stock market price displayed on a computer screen with green and red candles
Financial market candlestick chart against a dark background
A green graph on a monitor
Soft focus close up of a digital stock market candlestick chart displaying volatile price movements
A number of shiny coins with the bitcoin logo on them are piled on a very wet surface
Multiple data points at different values are continuously plotted next to a candle chart of a stock or crypto currency trading graph in a finance application or app on a dark pixelated computer screen
Stacks of money on fire on the floor in a dark room
Cursor causing the screen to scroll to the right as it moves along the graph line
A close-up of a live stock market candlestick chart displays fluctuating financial data on a digital screen
The video features a stylized glowing bitcoin symbol prominently displayed on a circuit boardlike background with digital connections radiating outwards the focus periodically shifts creating a dynamic visual of cryptocurrency in action
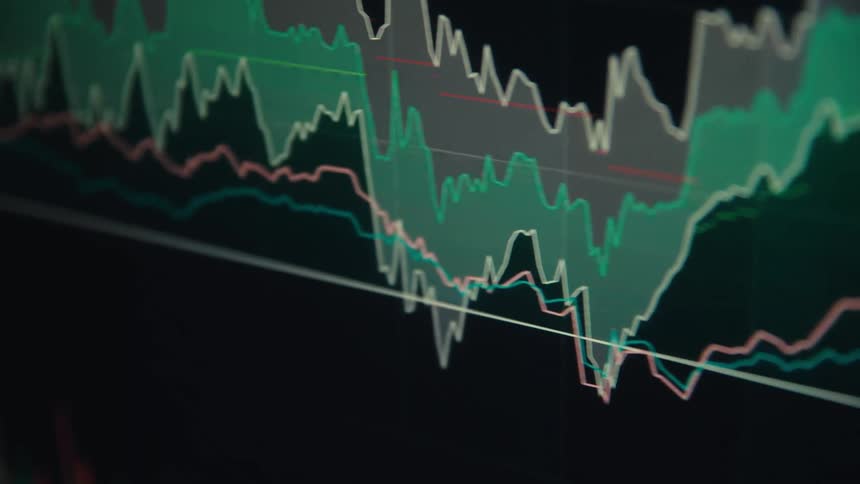
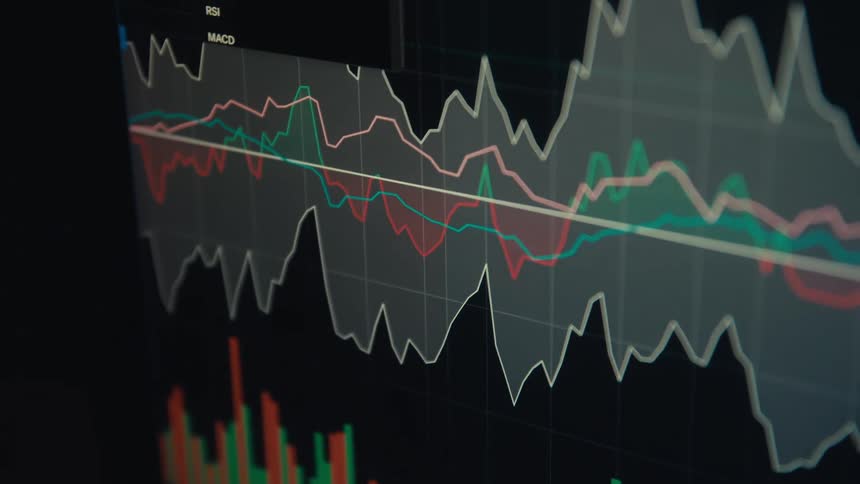
A closeup shot shows a digital screen displaying a financial graph with multiple colored lines representing different market trends the camera pans slowly from right to left revealing the volatile jagged movements of the lines as they shift up and dow
A clip of a screen displaying a digital trading candlesticks
Colorful candlestick chart against a background
Blurry close-up of a digital screen displaying a live stock market candlestick chart with fluctuating prices
American banknotes fall onto a surface one by one
Extreme macro close-up of a pixelated candle of candlestick trading chart changing between the colors green and red as symbol for volatility and uncertainty in the financial markets while the price of the stock or cryptocurrency rises and falls
A screen shows a financial chart with lines and bars moving up and down
The numbers on the monitor change frequently
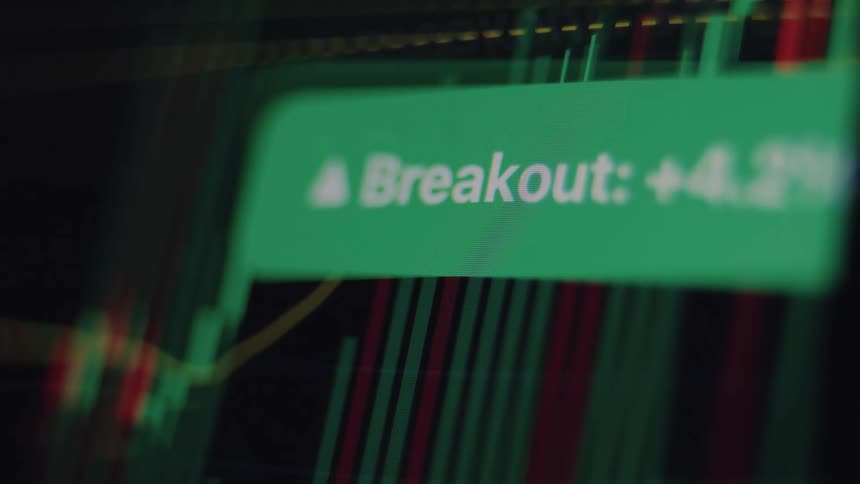
A digital stock market chart shows a bullish breakout with a green notification indicating a significant price increase
A spotlit silver briefcase filled with stacks of cash rotates against a black background
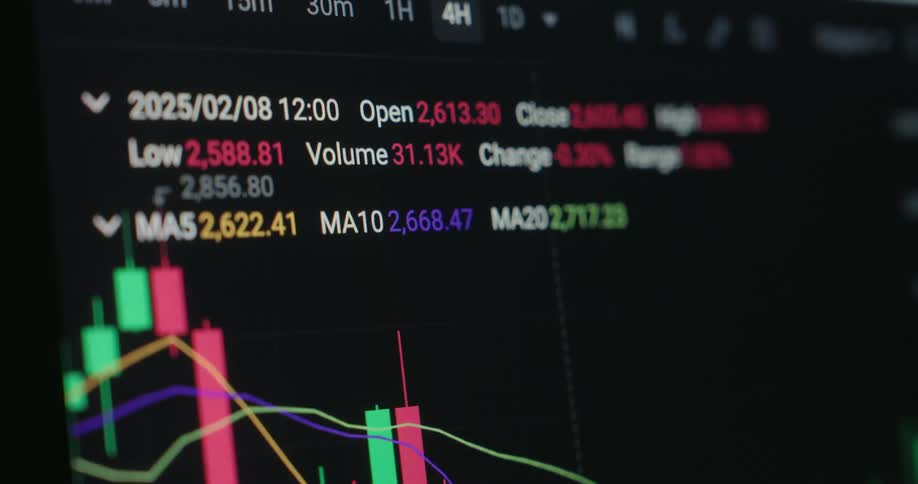
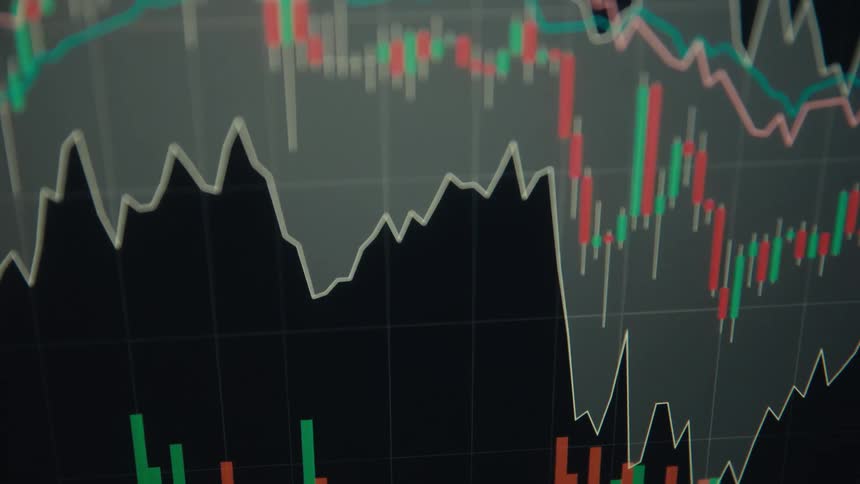
A computer screen displaying a stock market candlestick chart with fluctuating red and green lines indicating market trends
A close view shows blurry digital graphs and stock market data with red and green bars moving quickly across a dark screen
A line graph is displayed on the monitor
An abstract, out-of-focus animation of a digital stock market chart shows fluctuating data and glowing trend lines
A united states one hundred dollar bill with blue security stripe and july 4th date
The animated EUR or € sign in the colors of the EU flag pulsates in round circle flashes transforms and moves on the television display with rgb pixels representing the European economic area
Close up of a blurry device screen displaying a trading interface in green over a dark background
A chart moves around on the computer screen
A close-up of a digital stock market chart shows fluctuating asset prices with candlestick patterns and changing numbers
Thats a close up shot of a stock ticker or financial data display showing fluctuating numbers and possibly candlestick charts
A monitor displays a stock market candlestick chart with green and red candles moving across a dark grid
An angled closeup shot captures the dramatic peaks and valleys of a digital financial analytics chart with glowing yellow and green lines
Computer monitors are showing graphs and data
A colorful, stylized animation of a financial candlestick chart displays market volatility on a digital grid
Small stack of gold bitcoins on a counter against green lights background
Close up of a candle diagram stock chart pattern on a digital RGB TV screen consisting of pixels and green and red candles as the graph rises with a positive upward tendency symbolising financial success and share trading
The pile of cash is on fire
Graph of the value of a currency
Green numbers fluctuate rapidly on a dark stock market ticker screen, displaying real-time financial trading data
Multiple rows of graphs and numbers quickly scroll by on a screen
A person is pressing the tablet
Closeup of a graph of financial data that occasionally shows spots of light
Financial candlestick chart against a gray screen
An abstract, out-of-focus close-up of a digital candlestick stock market chart shows financial data fluctuating over time
British banknotes lying in a pile
The animated trading graph or candlestick chart is moving on the computer display as a recession hits the global finance markets and the prices crash as red candles symbolize the end of a market cycle and the beginning of a financial crisis or depression
Candlestick and line charts display variations on a financial panel

Need help finding the
right footage?

Have it delivered to your account within 1 business day.

This is Filmsupply

Our StoryOur FilmmakersArticlesFilmsPopular SearchesAll Categories

FM

A family of brands dedicated to empowering the creative.

FILMSUPPLY

Footage licensing for productions

MUSICBED

Music licensing for filmmakers

STILLS

Image licensing for creatives

© 2026 FM LLC.

Privacy PolicyLicense TermsTerms & ConditionsCareers