Musicbed
Filmsupply
Stills
Contact Us(800) 805-6802
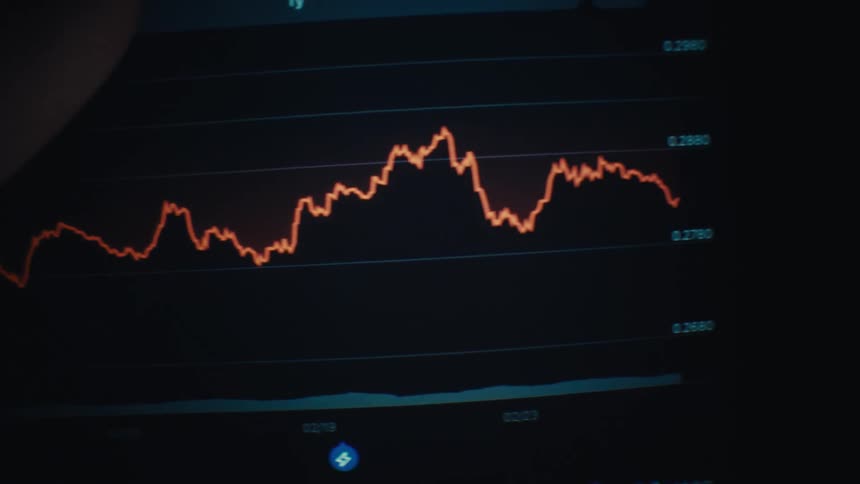
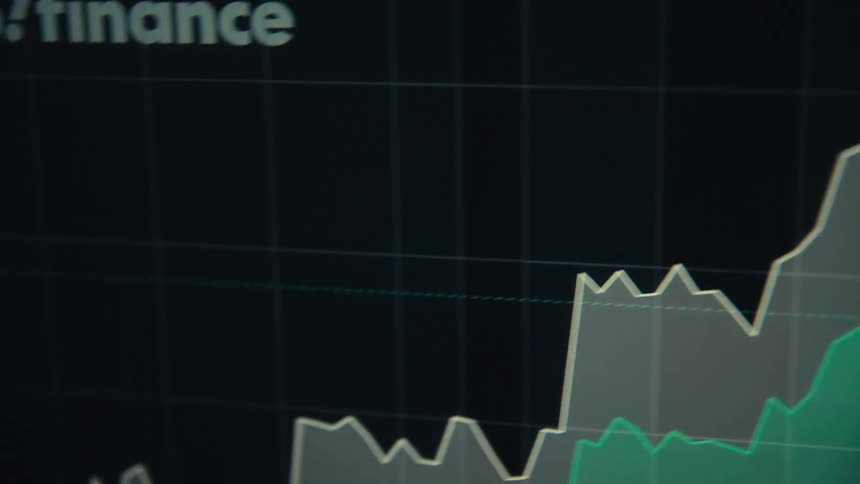
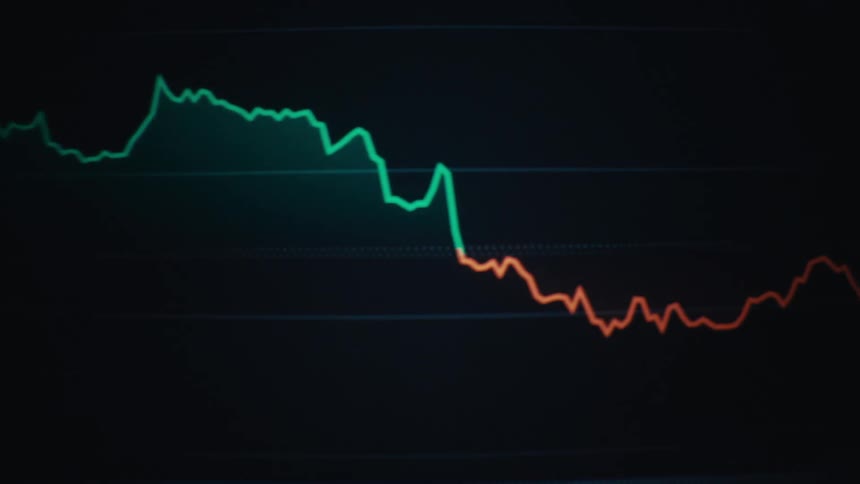
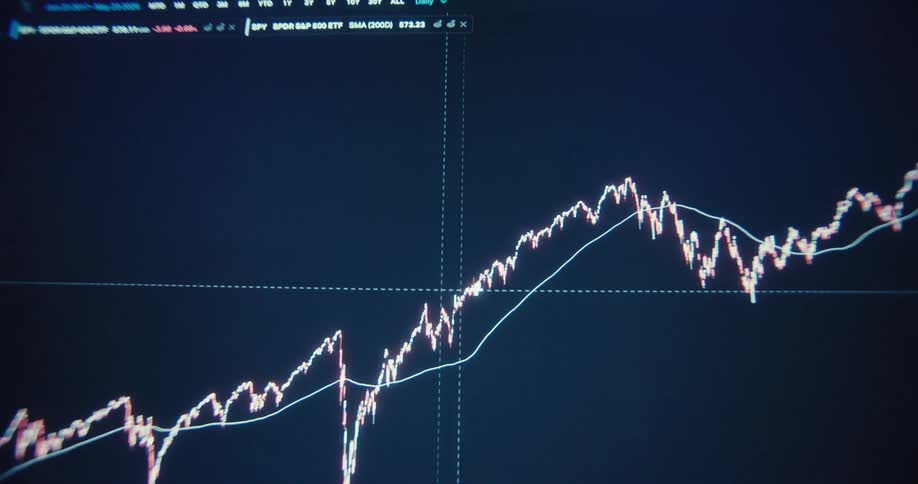
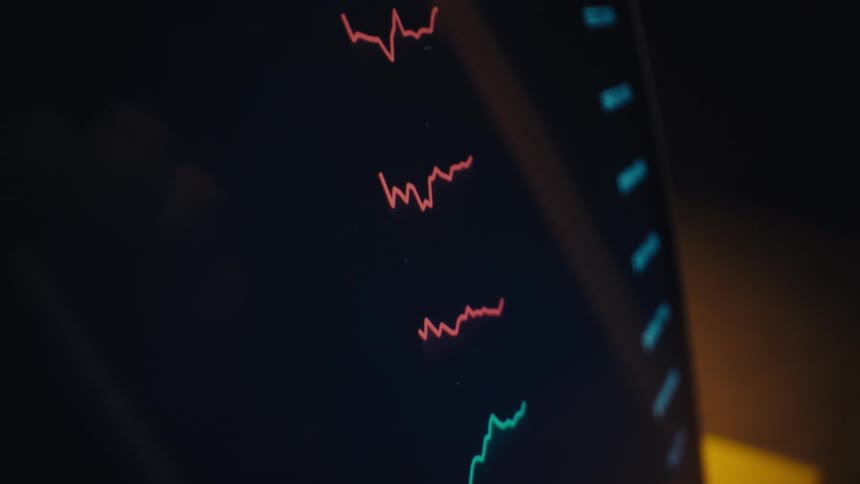
Price variation chart with a red line followed by a green line over time
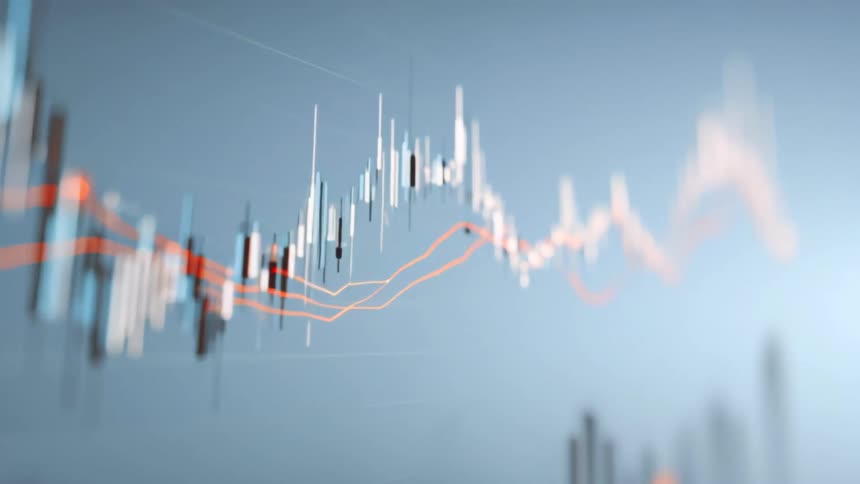
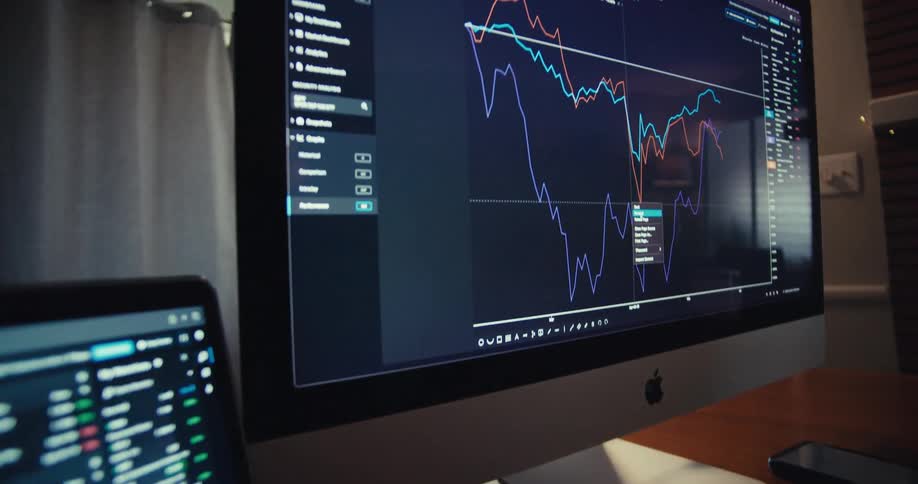
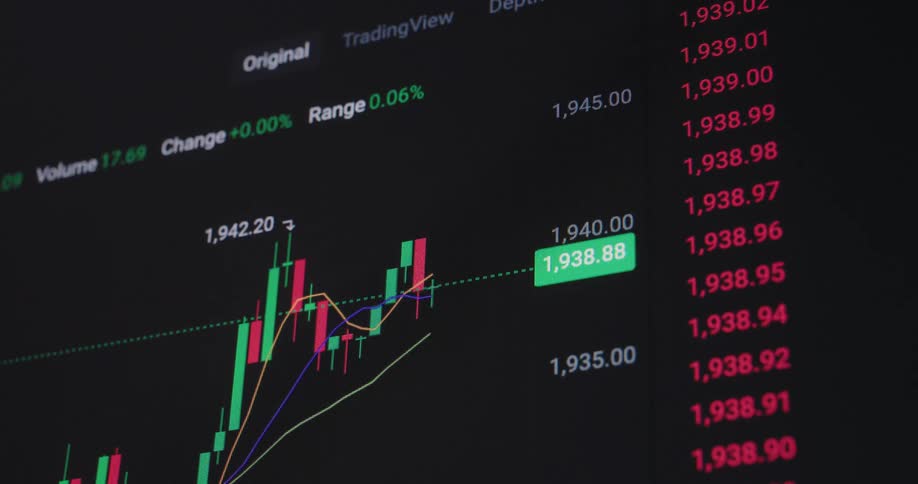
A computer monitor displays a stock market candlestick price chart
A clip of a screen displaying a digital trading candlesticks
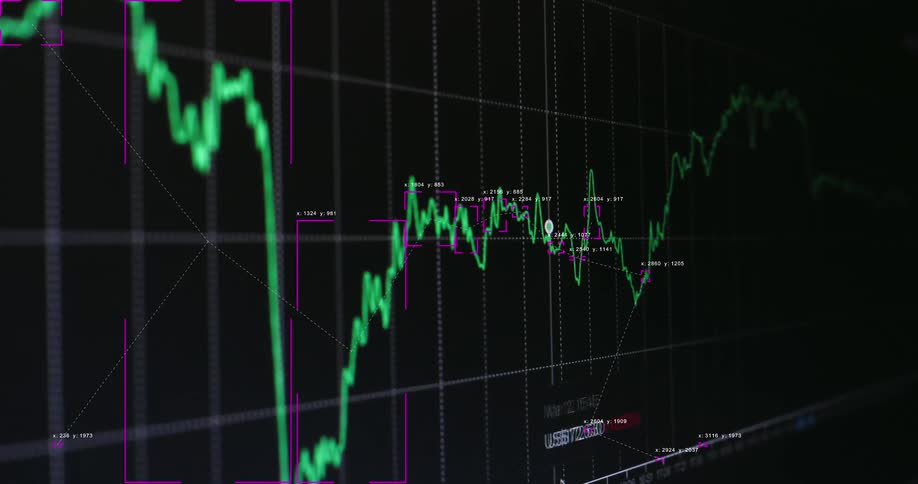
A high-tech digital animation shows a fluctuating green line graph on a stock market or cryptocurrency exchange chart with data analysis overlays
Negative statistical data presented on a pixelated display device as the bars and arrow trend line follow a declining price development symbolizing a failure of the financial system and recession of the global economy
Informational graphs cover the computer screen
A macro shot of a digital screen displays the volatile movement of stock market prices
A number of shiny coins with the bitcoin logo on them are piled on a very wet surface
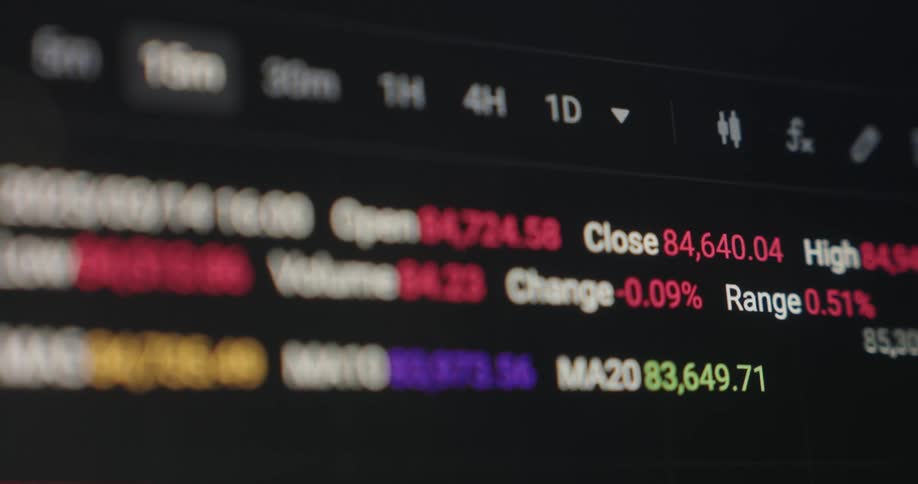
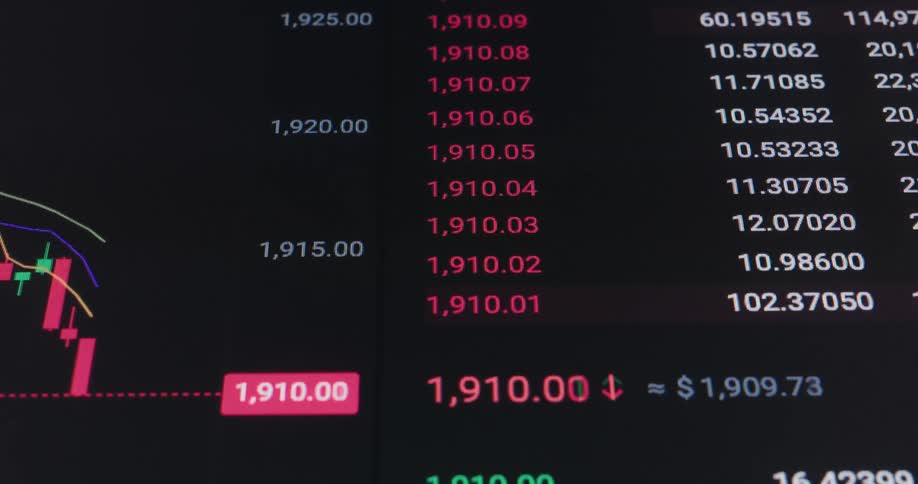
A close up of numbers on a screen
A close up view of financial data charts and graphs displayed on a screen with light distortions
A screen shows a financial chart with green and orange bars moving up and down
The graphs change on the computer display
The primary visual is a dynamic jagged trend line that changes color and style throughout the clips in the initial shots it appears as a sharp white line tracing rapid price fluctuations later it shifts to a vibrant green glowing line that follows
An animated candlestick chart on a digital screen displays fluctuating stock market or cryptocurrency data and analytics
Financial candlestick chart against a gray screen
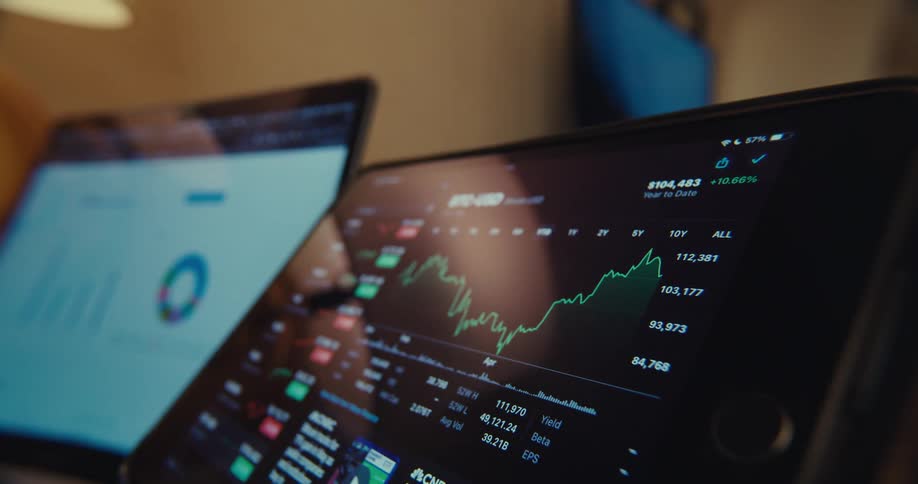
A person uses their tablet to check stocks
Red and blue candle chart
Numbers and a line chart are on the computer monitor
A footage of a trading chart screen
Line graphs and information are displayed on the computer screens
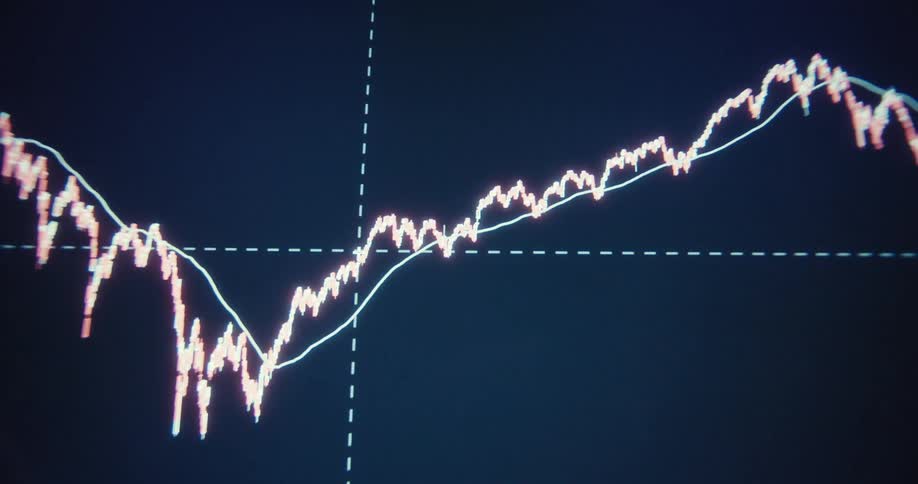
A stock price chart is displayed on a computer screen
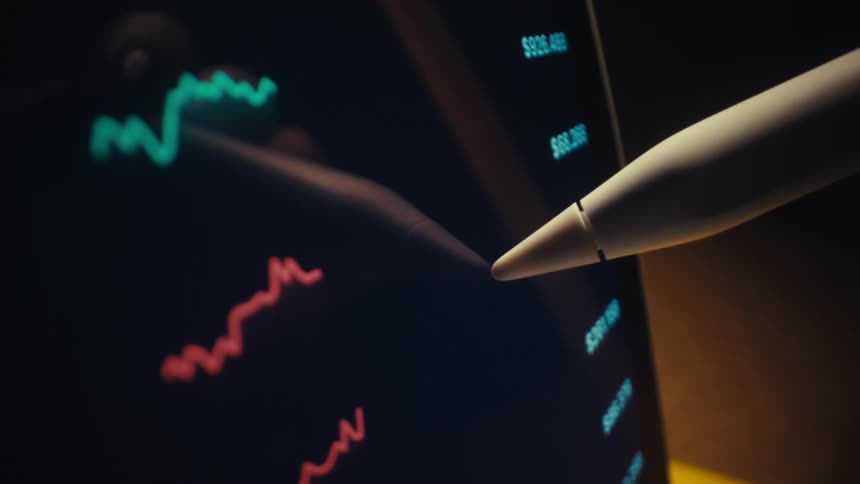
A stylus points at colorful fluctuating line graphs displayed on a digital screen suggesting data analysis or market tracking
Screen showing numbers scrolling and switching between red and green due to the stock market
A smartphone screen displays various stock market charts rapidly changing between green upward trend and red downward trend graphs for different companies and indices
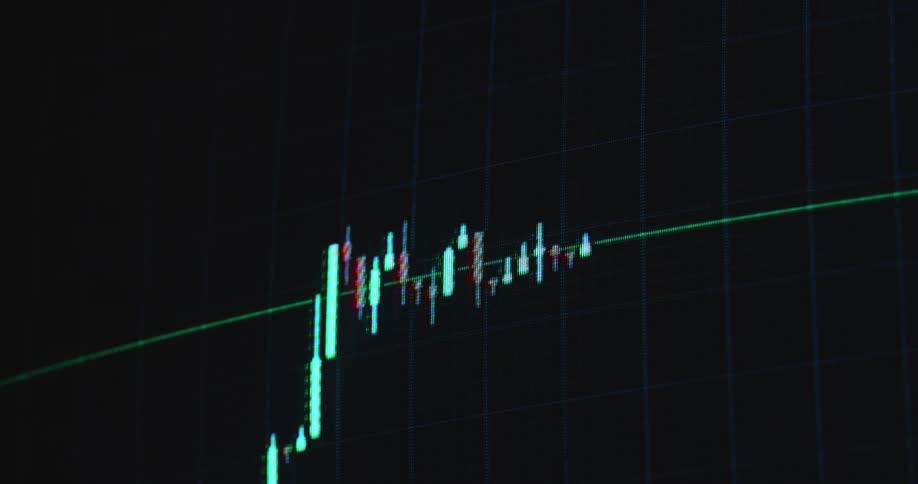
Tube TV screen displaying pixelated finance animation of trading chart pattern with long green bar and red candles as the price of the asset or stock retraces after a pump or move to the upside followed by a consolidation and sideways movement
The graph rises and falls on the screen
White and blue lines
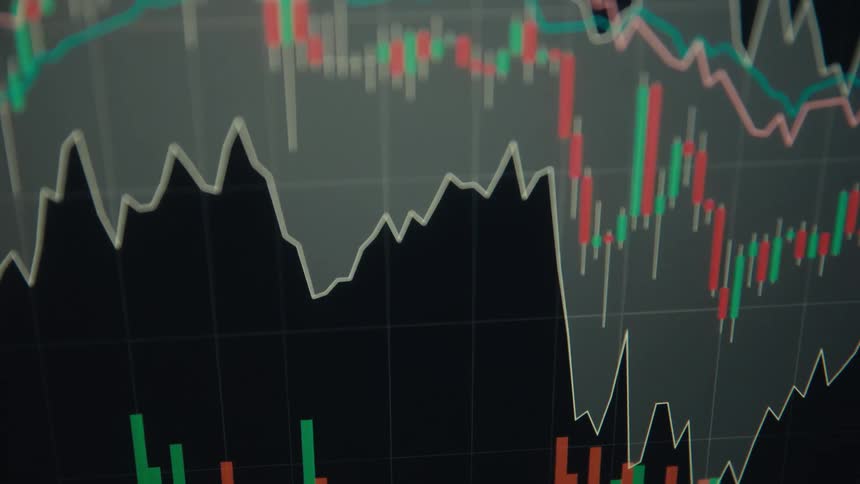
Candlestick and line charts display variations on a financial panel
Closeup of a monitor displaying a financial market chart
This video features a closeup blurred shot of a digital stock market ticker displaying fluctuating financial numbers and percentages the motion blur and shifting colors of red and green create a sense of fastpaced abstract data movement
Finger pointing at a market line chart displayed on a digital screen
Candlestick chart against a gray background
A graph rises on the screen
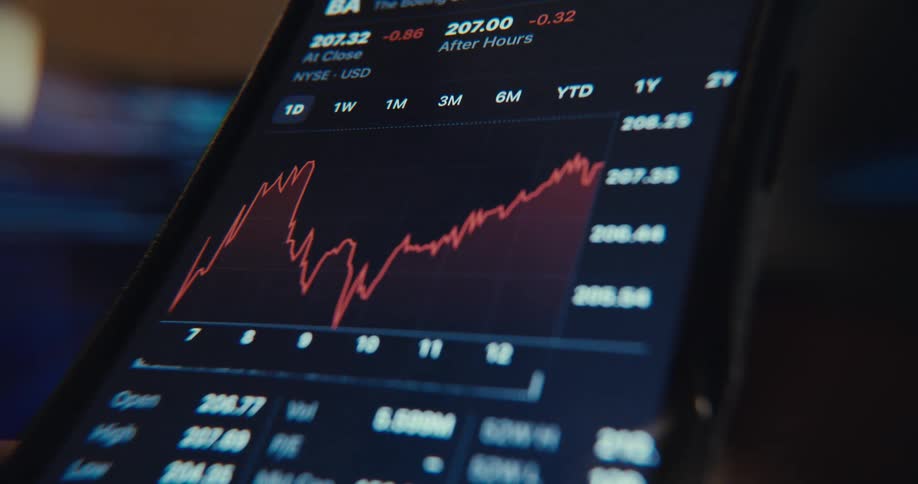
Smartphone tracking the changes in stock price
A close view shows blurry digital graphs and stock market data with red and green bars moving quickly across a dark screen
Blue and orange financial chart lines displayed on a digital screen
Two computers display plots and graphs relevant to stock information
Stack of golden coins with the bitcoin logo printed on them in front of a screen showing a financial line graph
Close up of a device screen as a person swipes through trading charts in a currency trading application
Financial charts with colored bars and lines displayed on a digital screen
A monitor displays a stock market candlestick chart with green and red candles moving across a dark grid
A close up of red and green lines on a graph
A computer screen with a green graph on it
A stock chart on a computer screen
A line graph is displayed on a monitor on the side of a building
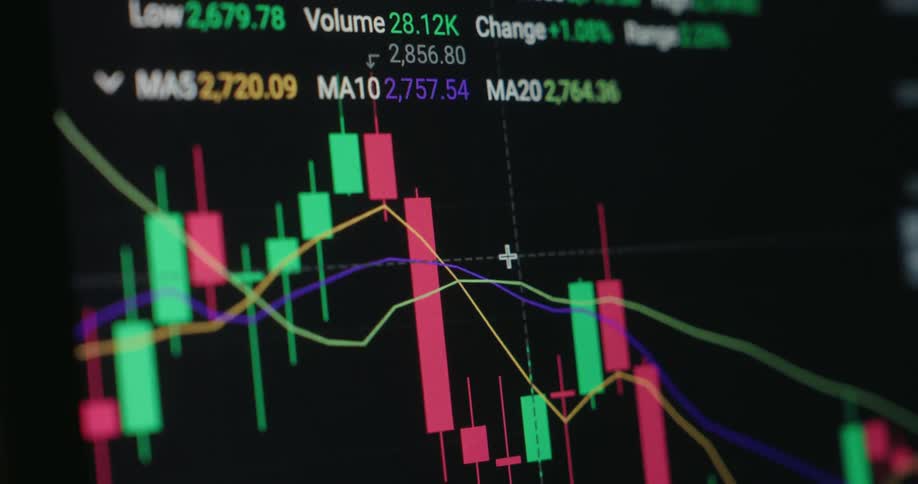
Close up of a screen displaying a trading interface with candlesticks and other trading indicators
A stylized 3d animation shows a glowing candlestick stock chart with a strong upward trend on a futuristic digital interface
Financial chart with colored lines and areas showing market fluctuations
A person traces his finger across the monitor
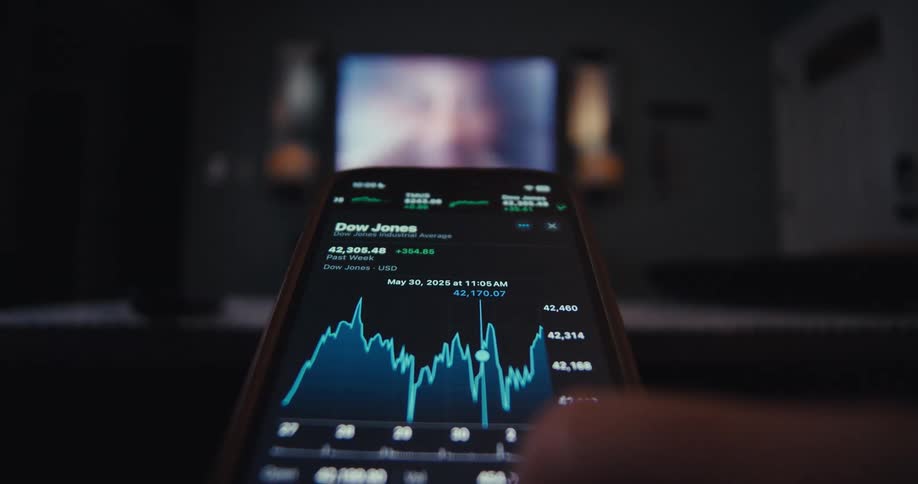
A persons hand holds a mobile device checking stock market prices while sitting in front of a television indoors
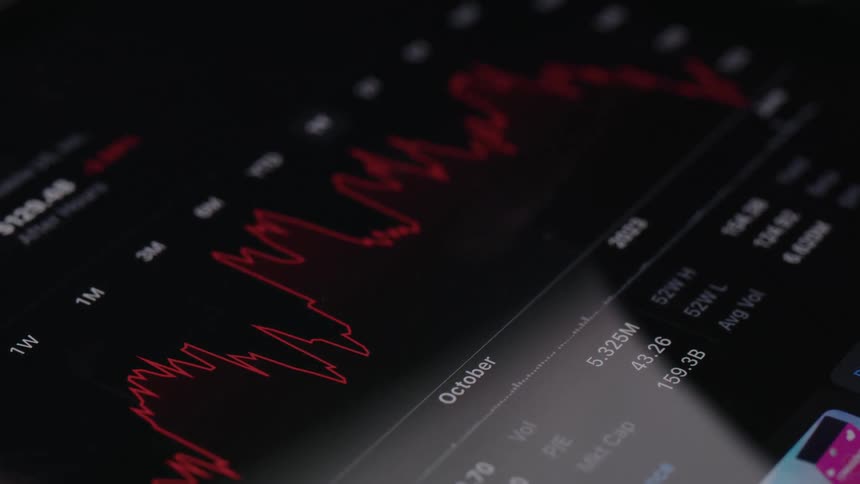
A red and green line graph depicting a sharp decline is prominently displayed on a dark background suggesting a financial downturn and loss
Computer monitors on a desk are displaying graphs
Closeup of a computer screen displaying realtime stock market charts and financial data
Crypto currency values and the associated chart change as time progresses
A bullish bull flag chart pattern is displayed on a dark monitor as the red and green candlestick candles form sideways consolidation before breaking resistance for a massive move to the upside with positive price development and profit in a bull run
A graph screen with pink and green bars
A stock market candlestick chart projected with a golden light on a display screen
Price chart of a stock displayed on a screen
Hands of two people pointing at a laptop screen displaying a graph
The numbers scroll by on the monitor
Swiping on a phone to see different charts
A stylus points at colorful fluctuating line graphs displayed on a digital screen suggesting data analysis or market tracking
Closeup of a graph of financial data that occasionally shows spots of light

Need help finding the
right footage?

Have it delivered to your account within 1 business day.

This is Filmsupply

Our StoryOur FilmmakersArticlesFilmsPopular SearchesAll Categories

FM

A family of brands dedicated to empowering the creative.

FILMSUPPLY

Footage licensing for productions

MUSICBED

Music licensing for filmmakers

STILLS

Image licensing for creatives

© 2026 FM LLC.

Privacy PolicyLicense TermsTerms & ConditionsCareers