Musicbed
Filmsupply
Stills
Contact Us(800) 805-6802
A fastpaced sequence of glowing candlestick charts and fluctuating stock market tickers appears through glitchy transitions and bright light leaks creating a highenergy atmosphere of digital financial trading
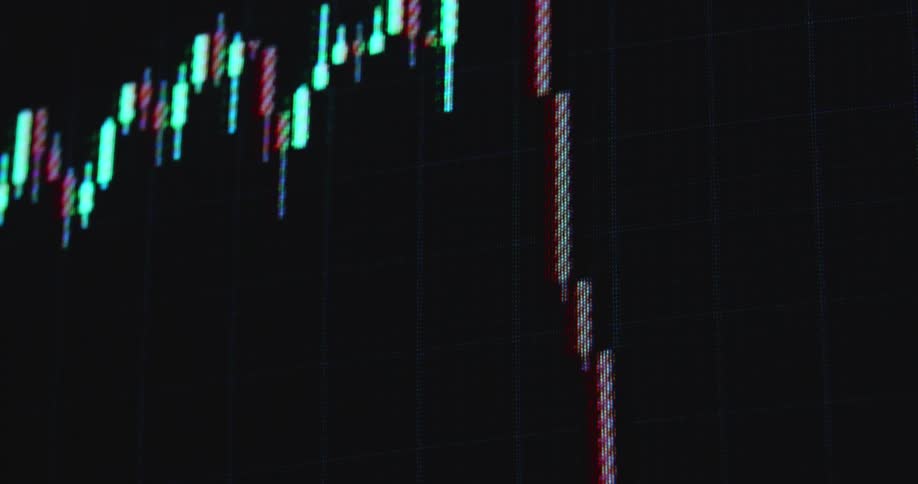
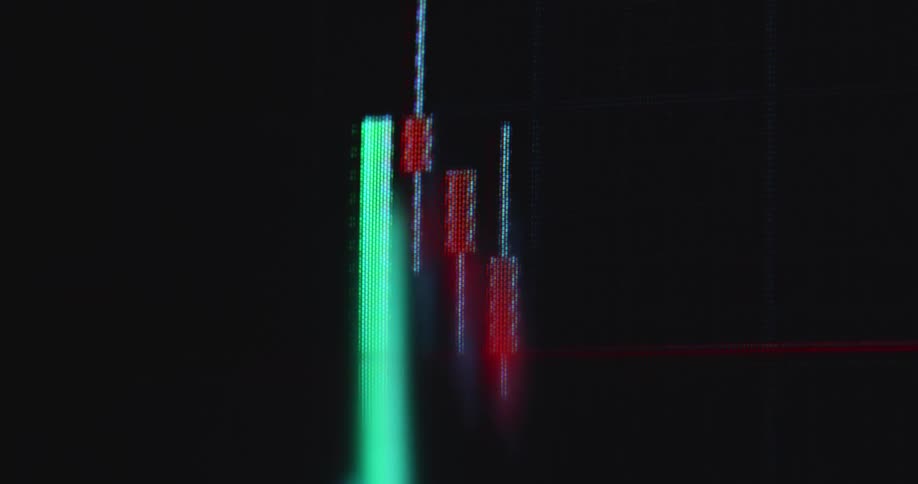
The financial markets are crashing due to a recession making stocks and shares drop and go down in price with decreasing value symbolized by a falling candlestick chart with red candles on a RGB pixel screen with black background
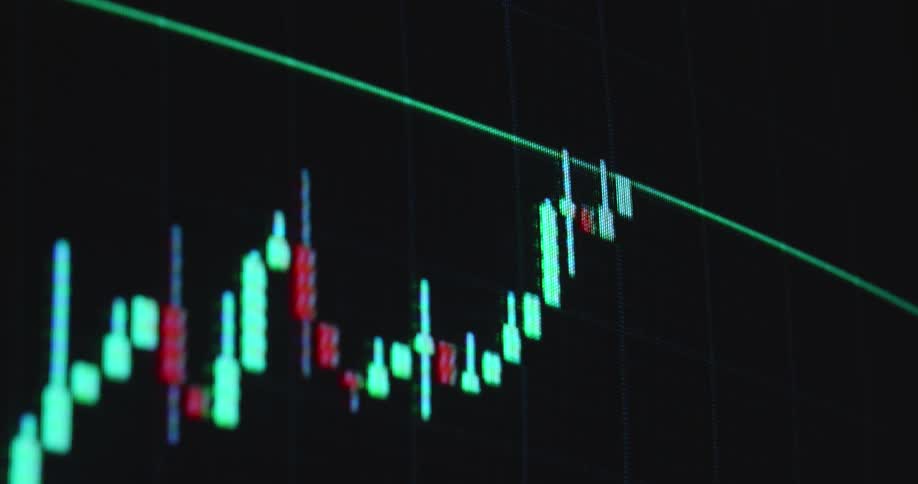
Handheld macro close-up of bullish financial market chart or candlestick trading graph on black screen displaying the UI of stock or crypto broker application or platform as the price surges and the value of the asset increases during investment bull run
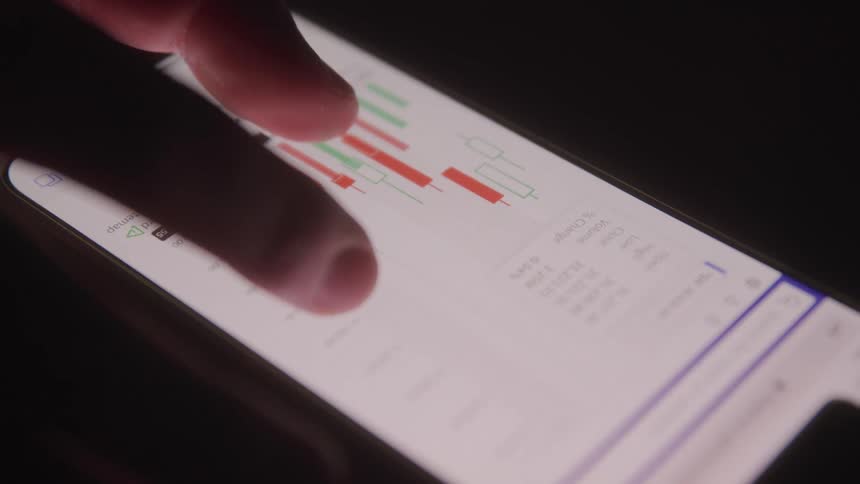
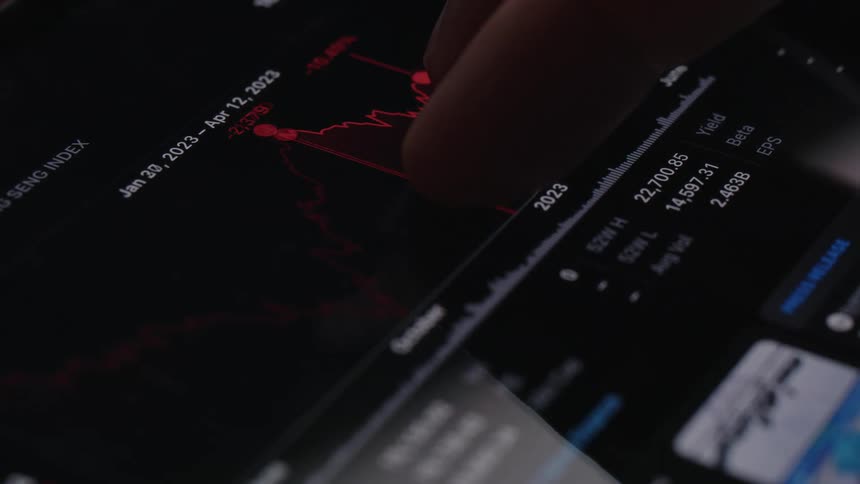
Fingers touching a touchscreen displaying a stock market graph with red and green bars
Multiple rows of graphs and numbers quickly scroll by on a screen
Close-up of a digital stock market screen displaying a portfolio's value with fluctuating red and green numbers
A close-up, out-of-focus shot of a digital stock market ticker screen shows fluctuating prices and trading volume
Small stack of gold bitcoins on a counter against green lights background
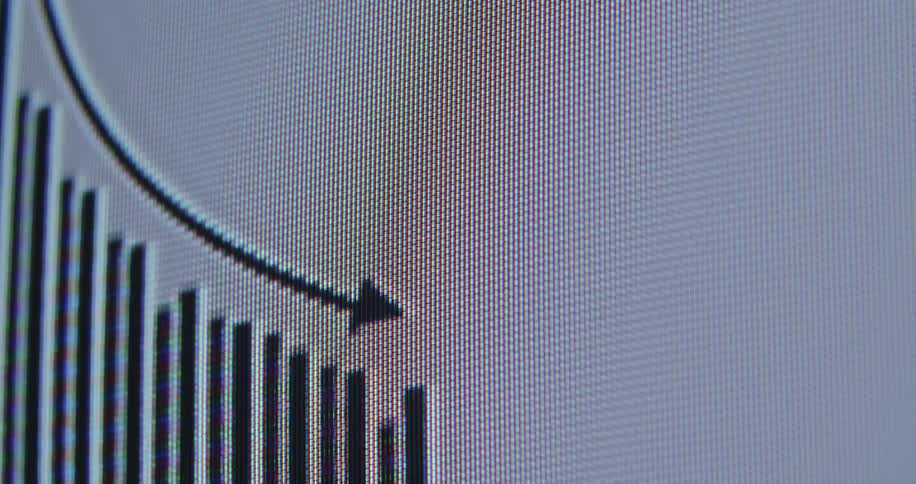
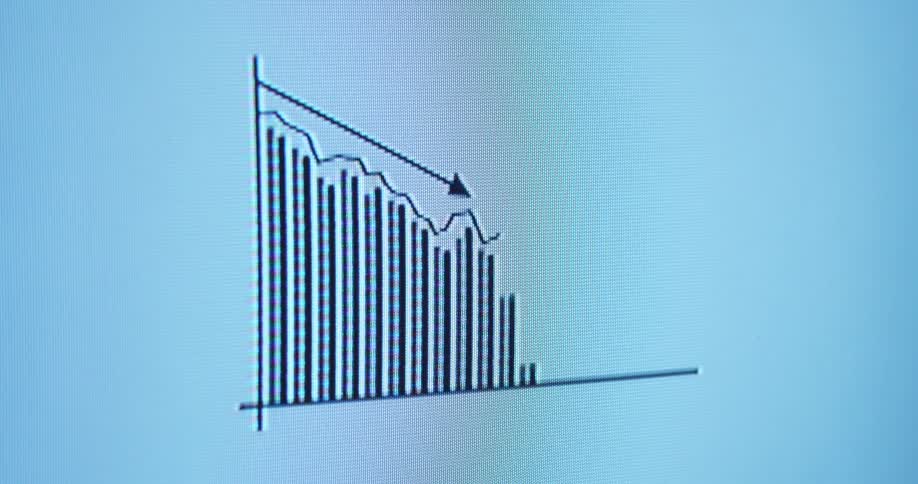
Three variations of an animated digital bar graph show a downward trend, symbolizing financial loss or decreasing statistics
The pixelated computer screen shows the financial market reacting to a black swan event such as 9/11 causing a global economic crisis and crash followed by recession and great depression as the stock market collapses

Soft focus close up of a digital stock market candlestick chart displaying volatile price movements
A futuristic animated stock market or cryptocurrency trading chart displays real-time fluctuating values and data analysis
An abstract, out-of-focus close-up of a digital candlestick stock market chart shows financial data fluctuating over time
Swiping on a phone to see different charts
A shallow depth of field close-up captures a vibrant, fluctuating candlestick chart on a digital financial trading screen
A stylus points at colorful fluctuating line graphs displayed on a digital screen suggesting data analysis or market tracking
A person traces his finger across the monitor
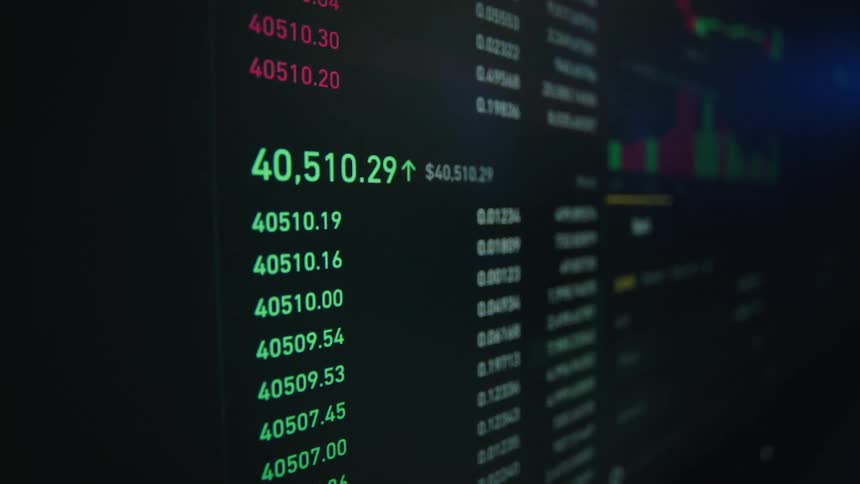
Green numbers fluctuate rapidly on a dark stock market ticker screen, displaying real-time financial trading data
A close-up of a digital candlestick chart on a screen shows financial data fluctuating in real-time
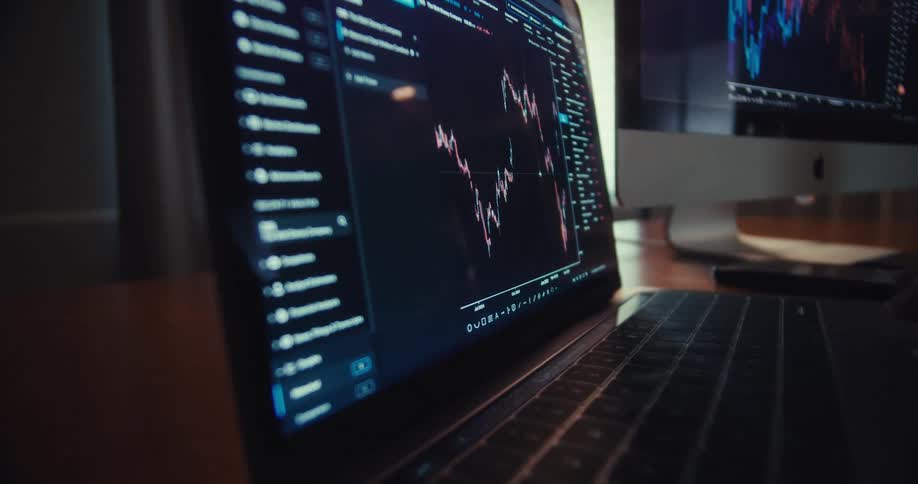
The laptop shows moving lines on a graph
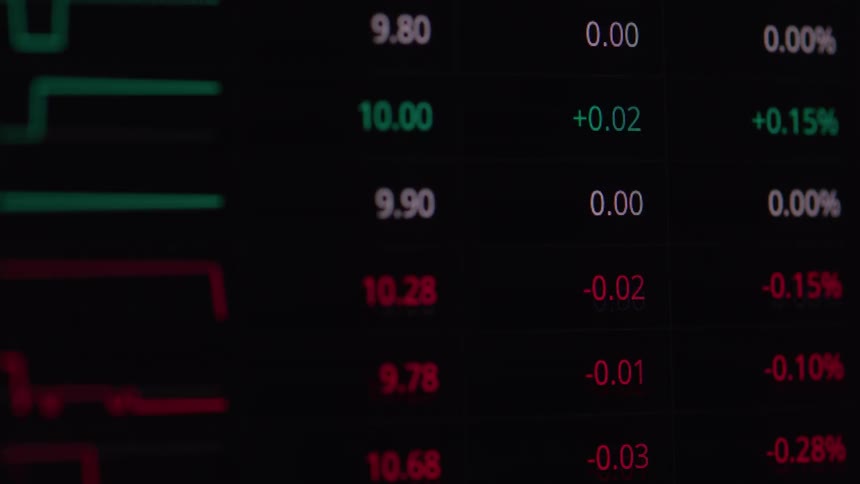
Values and changes in red and green displayed on a financial market board
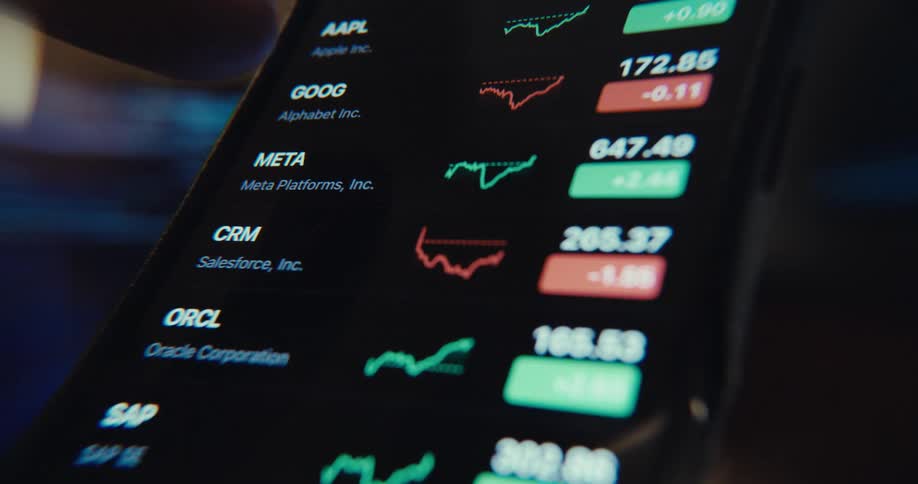
A person is interacting with a financial market app on a smartphone accessing the watchlist menu while viewing stock quotes
A person uses their tablet to check stocks
A rapid distorted pan across a financial monitor displays a flurry of stock symbols and fluctuating dollar amounts with bright green and red indicators shimmering through a heavy fisheye lens effect
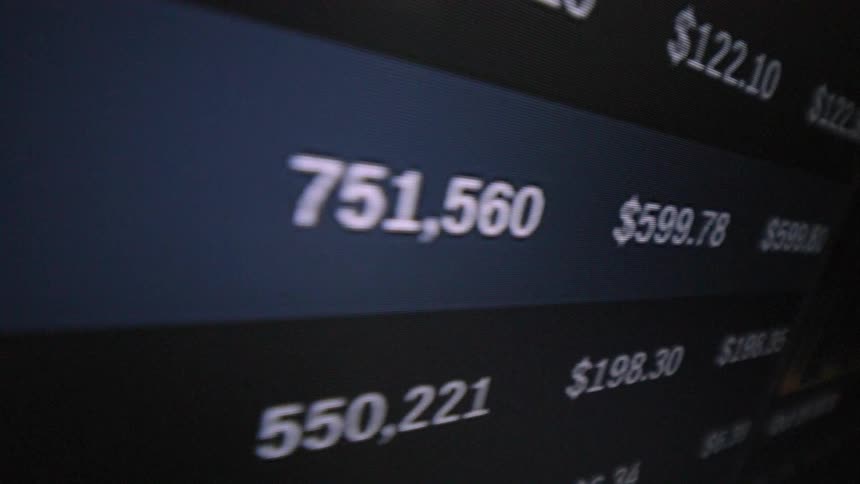
A closeup shot of a digital screen displaying blurred financial data with dollar values
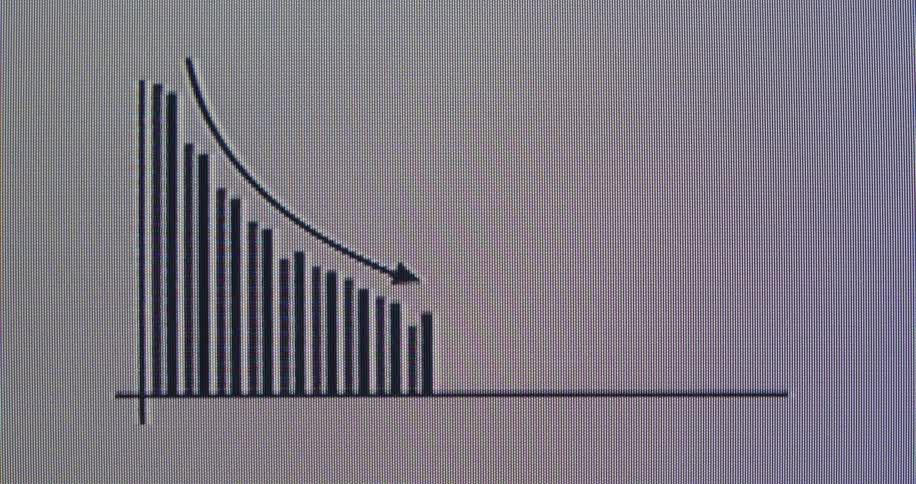
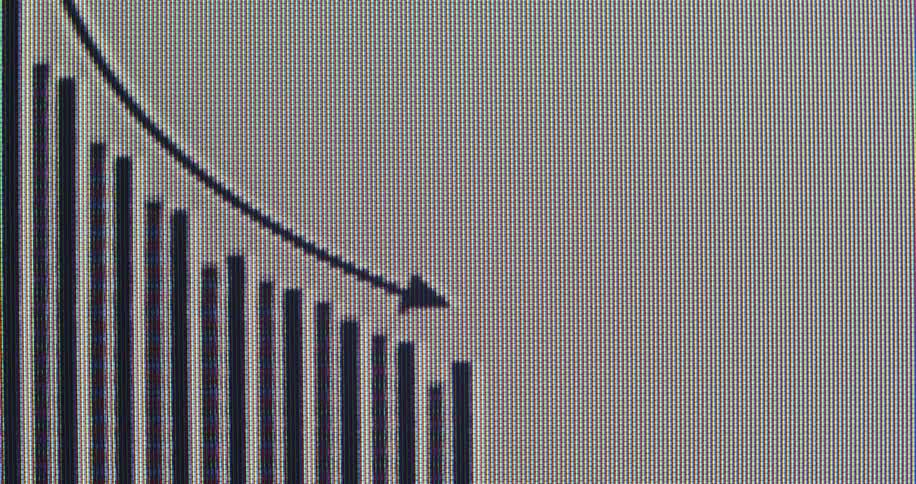
A minimalist animated bar graph on a dark screen shows a steady decline in values with a downward arrow
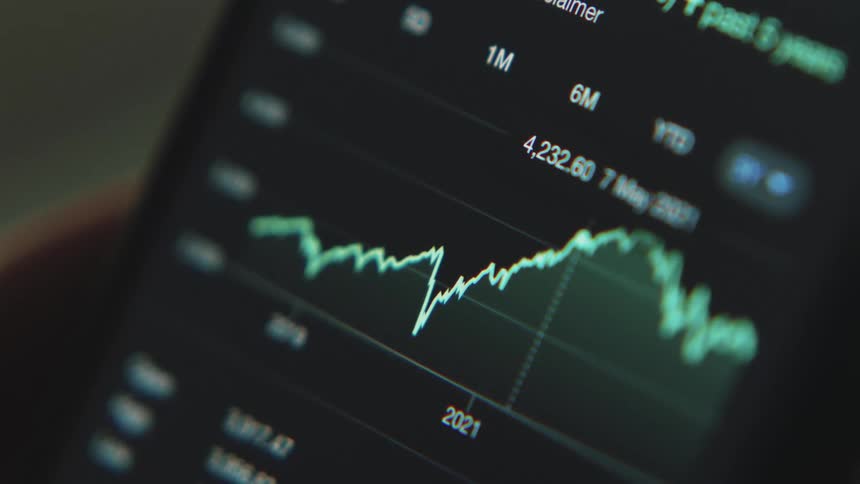
A close up of a cell phone screen with a graph displayed and numbers
A graph speeding through the evolution in price of a stock over several years
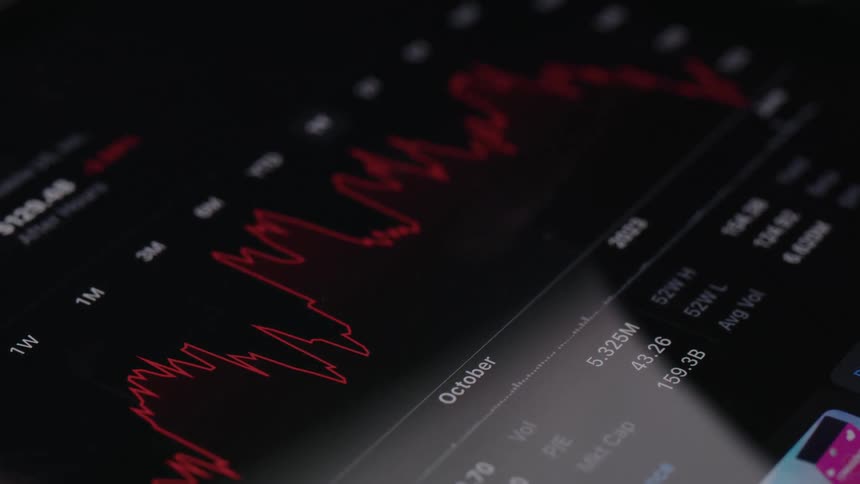
Screen displaying bearish financial market graph as candlestick chart crashes while stock and crypto currency markets decline and assets lose their value due to drastically decreasing and falling prices causing panic sales and recession with volatility
A woman is sitting at a desk with a laptop waiting for a graph to load on the screen
A clip of a digital trading chart
A close-up of a live stock market candlestick chart displays fluctuating financial data on a digital screen
A dense slightly blurred market leaderboard of tickers and redgreen figures fills the screen
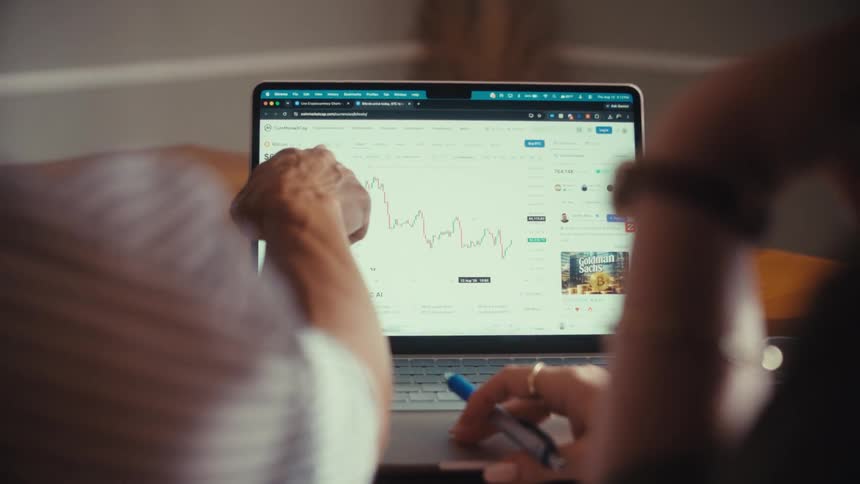
An over-the-shoulder shot shows two people analyzing a fluctuating financial graph on a laptop screen
A detailed macro shot shows a digital bar chart with an arrow trending upwards, indicating positive growth and financial success
A close-up of an animated bar graph on a pixelated computer screen showing a declining trend
A fluctuating blue digital chart line trends downwards in a dark, abstract macro shot
Extreme close-up of a digital screen displaying a bar graph with a downward-trending arrow, indicating a financial decline or market crash
A large monitor flashes red and yellow bars that look like a chart
Red candlestick charts indicate sharp market downturn with fast price movement and negative development caused by stock or finance market crash and recession displayed on digital computer screen causing stress and panic while assets lose value
A closeup view of a stock market chart with red and green candlesticks fluctuating
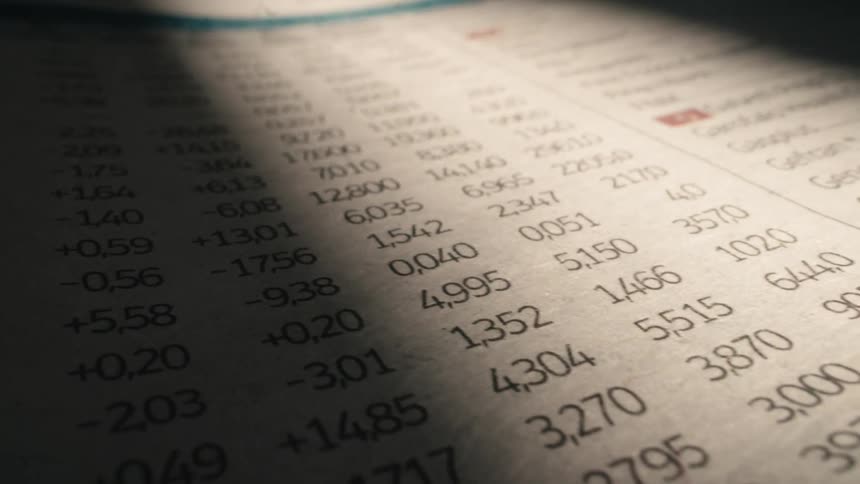
A beam of light scans across the stock market listings in a financial newspaper, highlighting the changing numbers
Closeup of a screen displaying a financial market graph
Red and neon green glowing candles create a bullish candlestick chart pattern with upward movement and positive price development as symbol for a healthy commodity or equity market or profitable stock or crypto trades via online broker app
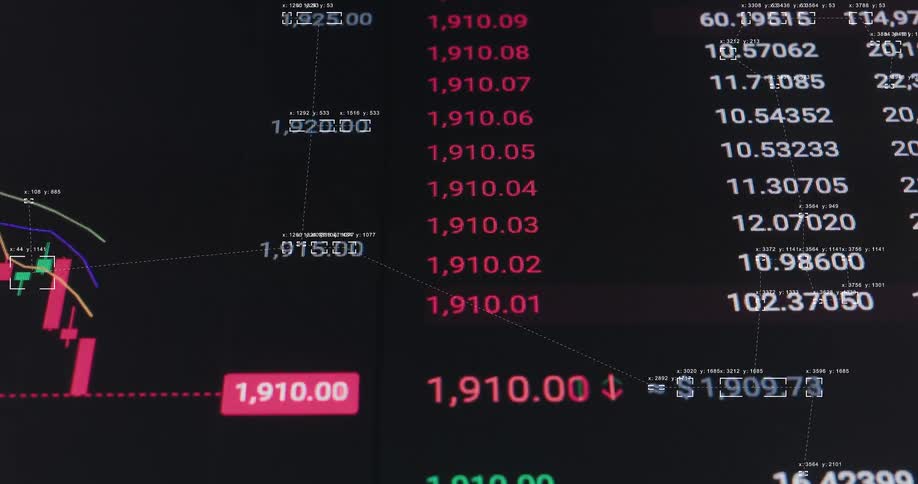
A black screen with white numbers with dollar signs and some numbers are green and some are red
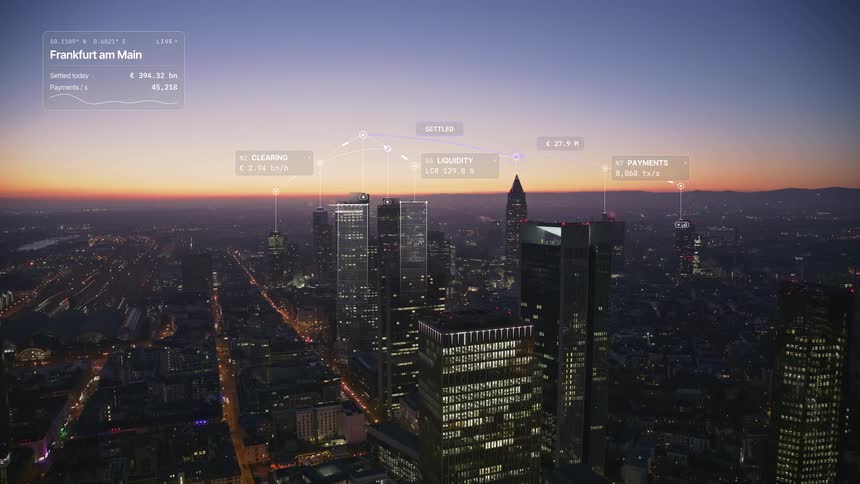
Aerial view of Frankfurt am Main at dusk with animated financial data graphics tracking live transactions across the city
Person touching a screen of an electronic device
Close up of the changing numbers on the indicators of a trading website on a screen inside a dark room
Macro shot of a financial chart on a computer screen indicating a downward trend with a black arrow
Extreme close-up on a pixelated screen shows a bar graph and arrow rising to represent business success and economic growth
A blue arrow moves across the screen while a graph with statistic bars builds beneath it with a downward or negative trendline visualizing the lowering or sinking of costs or financial income data during a corporate presentation
Close up of a person navigating a trading interface in a mobile phone app in the living room
Extreme macro close-up of a computer monitor showing a bar graph with a downward arrow indicating a financial market crash, economic recession, or loss
The animated data graph steadily goes down with a negative trend or declining tendency on the pixelated monitor presenting a financial or business statistic during a cooperate presentation with a holographic overlay or effect
A finger swipes along a tablet
Falling financial market chart against a background of abstract numbers
The numbers scroll very fast on the monitor
Candlestick chart line goes up and down slowly while green and red candles symbolize volatility and uncertainty in the financial markets providing opportunity for traders and brokers investing into stocks and shares or crypto currencies such as BTC or ETH
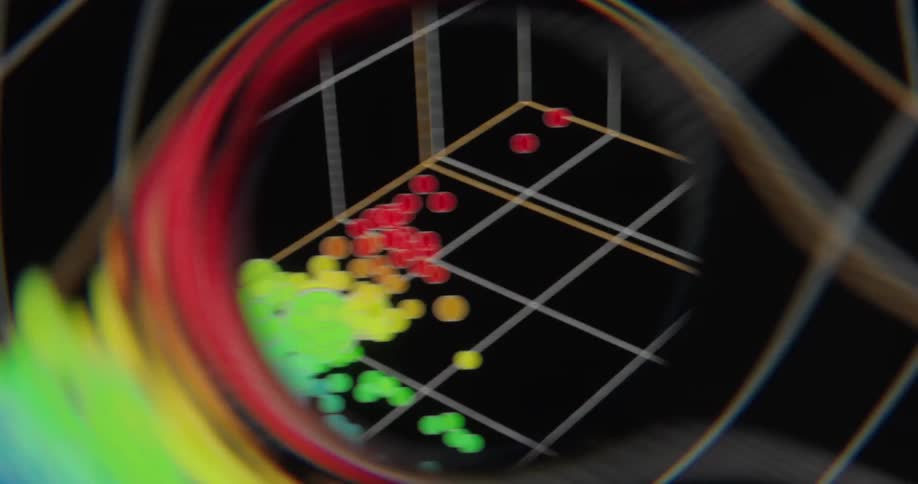
A dynamic data visualization of a 3D scatter plot with colorful dots representing protein analysis rotates within an abstract frame
Man wearing glasses observes financial charts on a screen with his hand on his chin
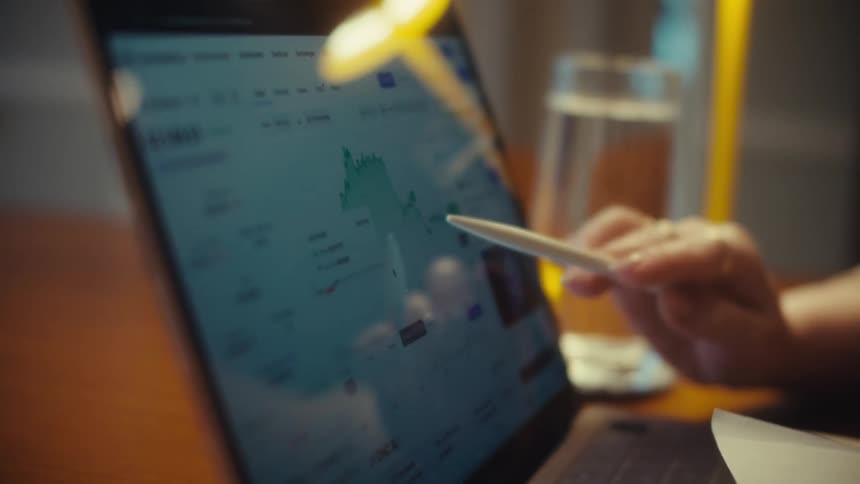
A close-up of a businesswoman analyzing a stock market chart on a touchscreen laptop with a stylus
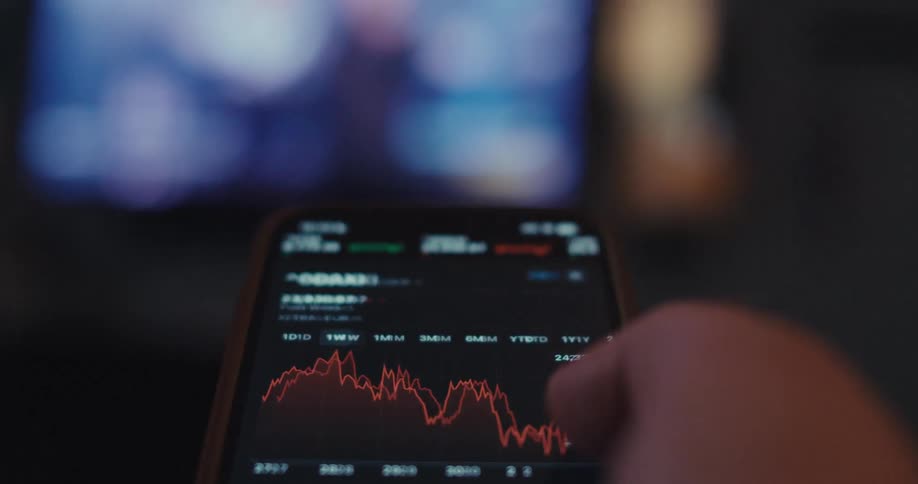
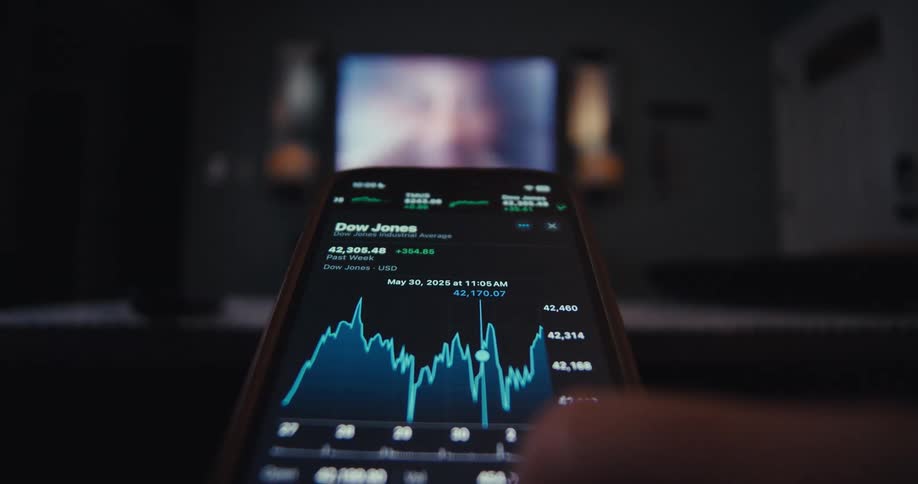
A persons hand holds a mobile device checking stock market prices while sitting in front of a television indoors
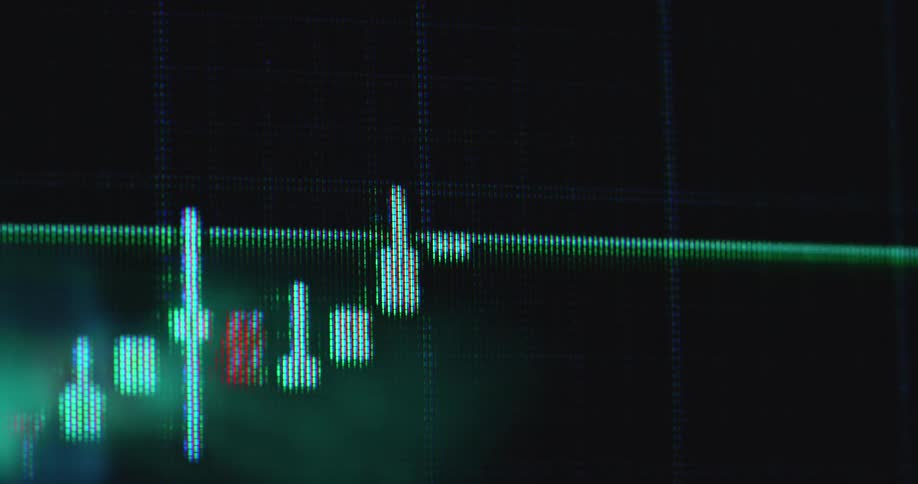
Dynamic macro footage with shaky hand-held camera movement of green and red candles of candlestick chart pattern with upward movement on a glowing financial trading graph with positive price development on dark screen or monitor

Need help finding the
right footage?

Have it delivered to your account within 1 business day.

This is Filmsupply

Our StoryOur FilmmakersArticlesFilmsPopular SearchesAll Categories

FM

A family of brands dedicated to empowering the creative.

FILMSUPPLY

Footage licensing for productions

MUSICBED

Music licensing for filmmakers

STILLS

Image licensing for creatives

© 2026 FM LLC.

Privacy PolicyLicense TermsTerms & ConditionsCareers