Musicbed
Filmsupply
Stills
Contact Us(800) 805-6802
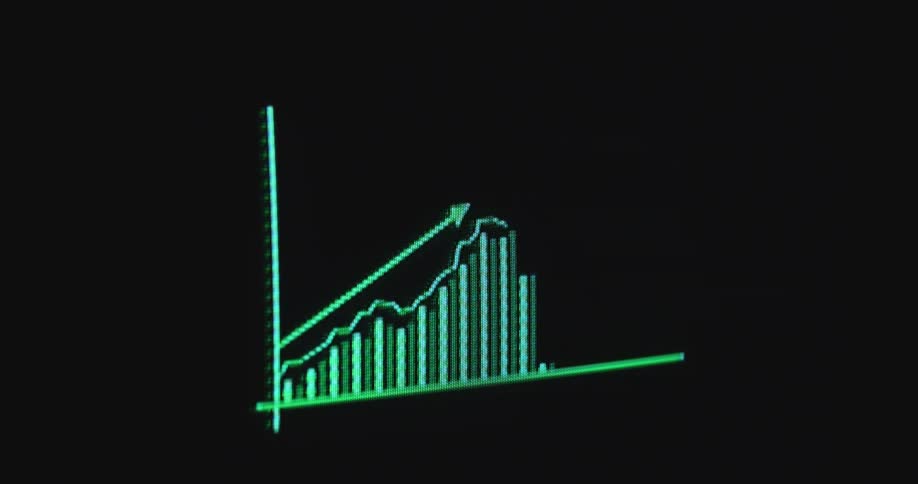
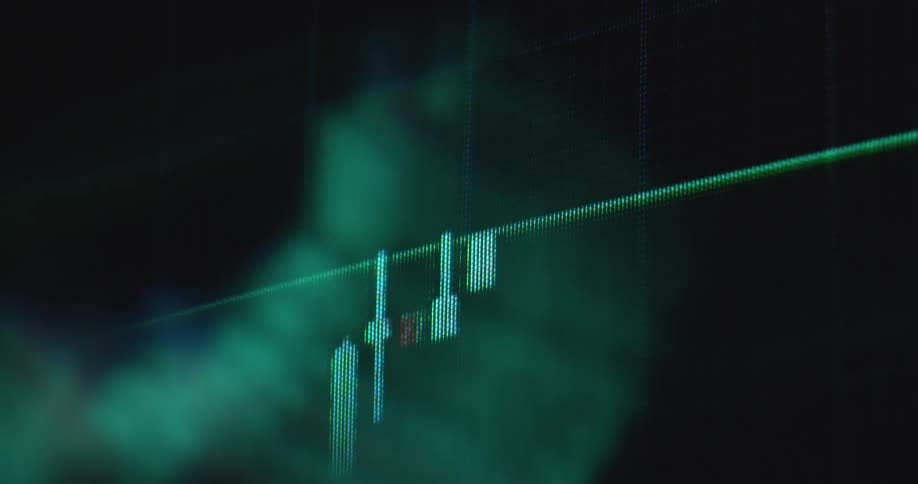
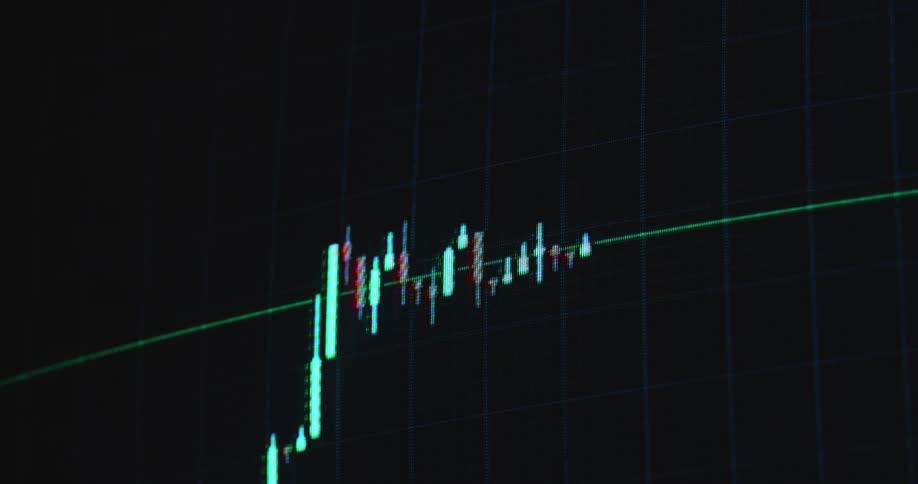
Close-up of a digital green financial bar graph on a computer screen showing a positive upward trend and growth
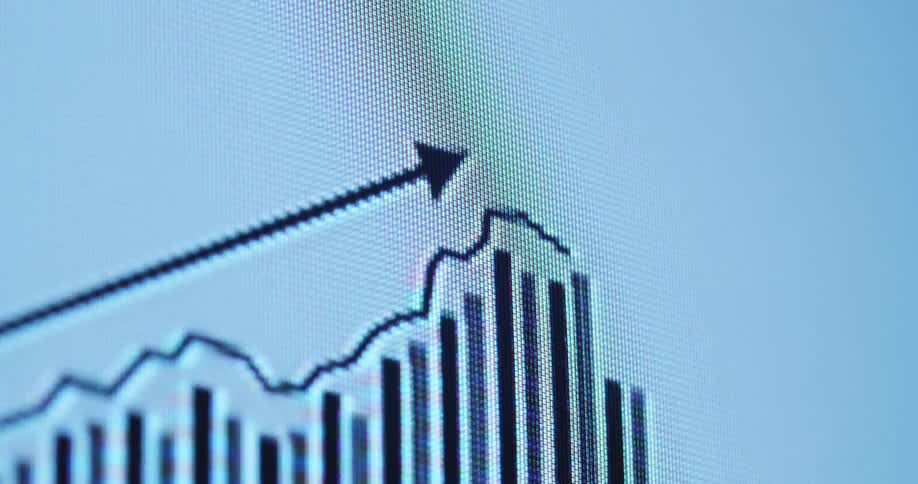
Black and white animation of bar chart of stock prices or business development features an upward arrow moving from left to right with a positive trend line and a rising value as part of financial data statistic during cooperate presentation
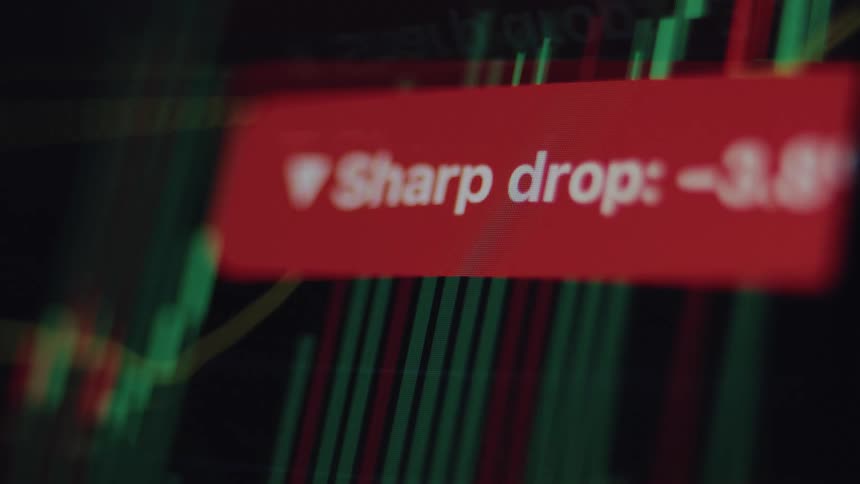
A close-up of a digital stock market chart on a screen shows a red notification alerting to a sharp drop in value
Three variations of an animated digital bar graph show a downward trend, symbolizing financial loss or decreasing statistics
A finger scrolls through a touchsceen
Closeup of a monitor displaying a financial market chart
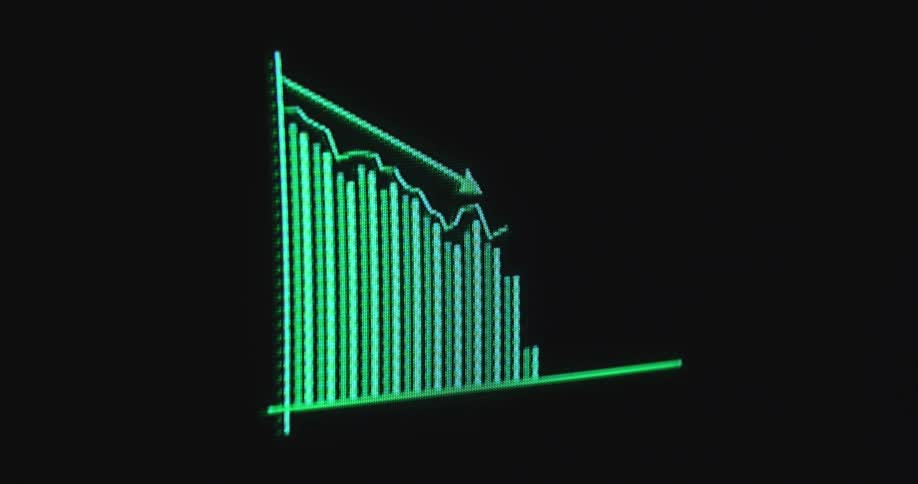
A pixelated green bar chart and line graph on a black screen animates to show a significant downward trend emphasized by a descending arrow as symbol for a stock market crash due to global economic uncertainties
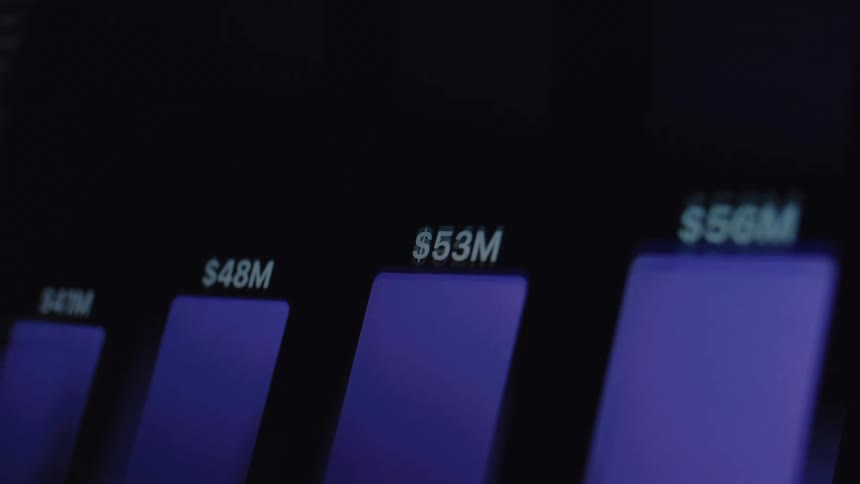
A close-up of a digital screen showing an animated financial bar graph with increasing monetary values
Extreme close-up of a digital screen showing a red bar graph and arrow trending downwards, illustrating a financial crisis or market crash
Finger pressing an illuminated circular interface with circuit patterns around it
Close-up macro shot of a bank fraud alert for unusual activity appearing on a digital screen
The monitor is displaying a flashing icon
Stylized financial chart with multicolored candlestick patterns
A close-up of a digital candlestick chart on a screen shows financial data fluctuating in real-time
A clean, minimalist animation of a white speech bubble icon with three dots pulsing, symbolizing typing or a pending message
A person scans their phone on the machine and receives a beverage
The graphic has dark moving lines
Mouse cursor clicks on a sell button displayed on a computer or PC screen in order to sell a product on a digital online market place or to trade shares on a stock exchange
An open suitcase filled with stacks of money slowly rotates
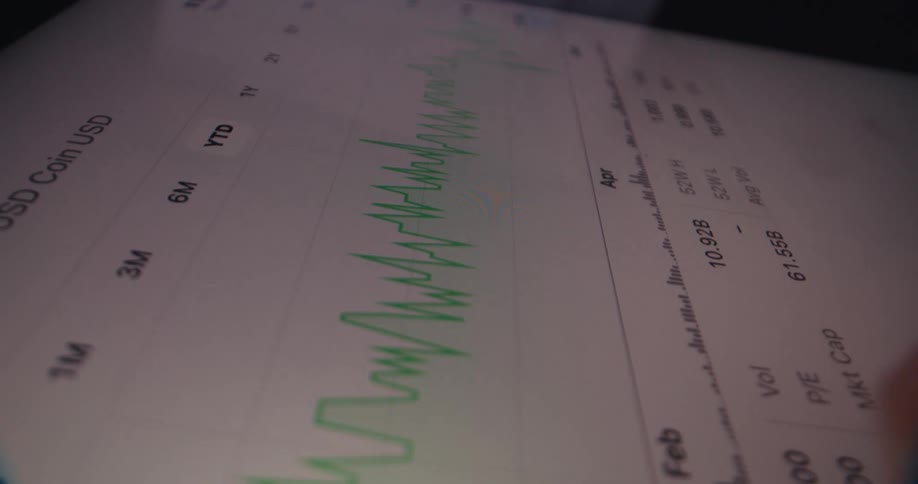
A digital graph on a screen shows a volatile stock price or cryptocurrency value fluctuating up and down, indicating gains and losses
A rapid closeup pan sweeps across a digital trading screen showcasing glowing teal and red bar graphs alongside fluctuating data lines that are softened by heavy motion blur and vibrant light streaks as the interface updates
A person scrolls through a lot of content as they swipe a smart phone screen
Closeup of a monitor displaying financial data
A person scrolls on their phone
A person reviews various stock market graphs and financial data on a smartphone in a bright modern interior
Computer monitors are showing graphs and data
Person taps their smartphone with their thumb to buy a stock
List of dollar amounts scroll on device display
Finger pressing the center of a digital interface with neon blue circuitry
A person uses a stylus to draw a circle around text on a touch screen tablet
A blurred, close-up, and stylized animation of a digital stock market chart with glowing lines and fluctuating data
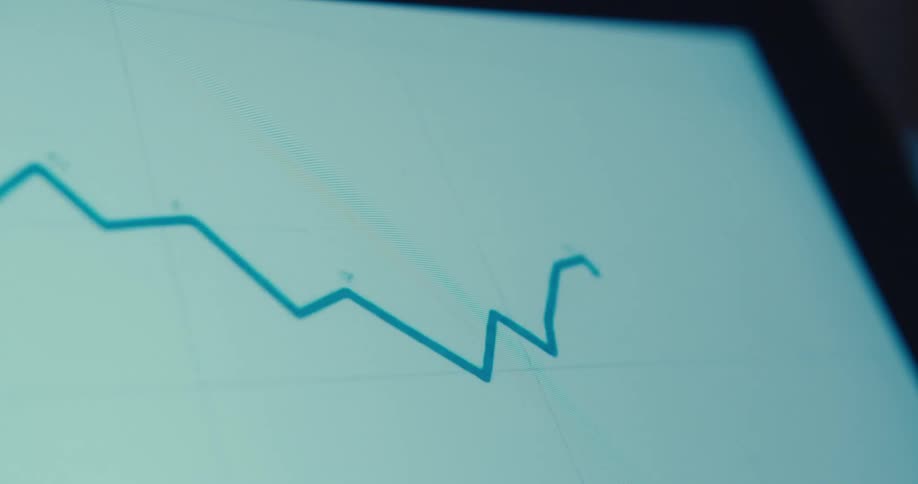
A fluctuating line graph appears on a digital screen with distinct peaks and troughs
Black bank card floats in a minimalist setting surrounded by metallic euro and percentage symbols
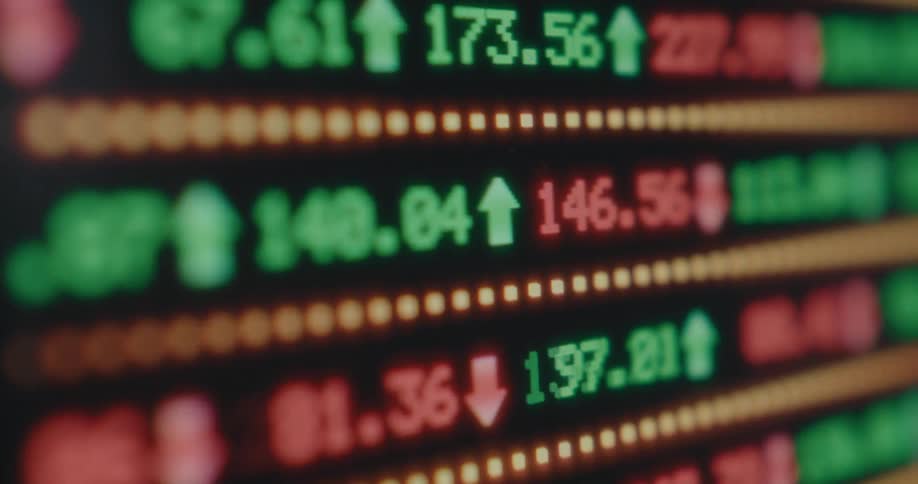
Close-up of a digital stock market board showing real-time price changes, with green numbers rising and red numbers falling
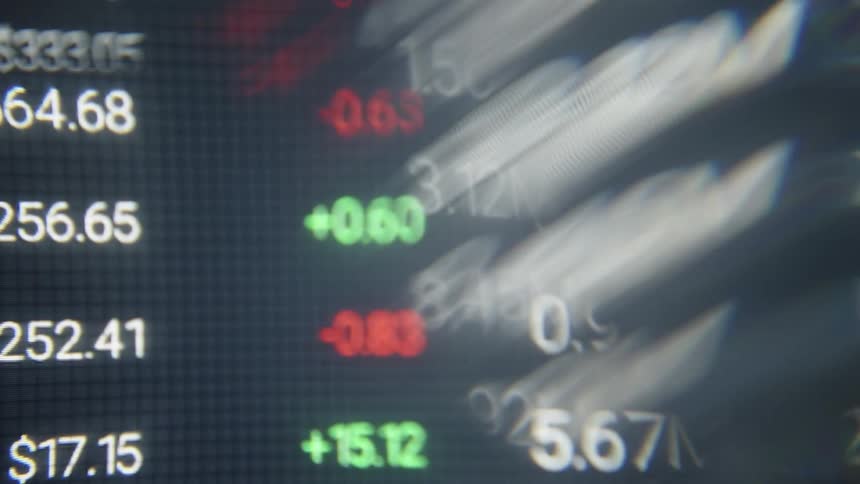
A rapid distorted pan across a financial monitor displays a flurry of stock symbols and fluctuating dollar amounts with bright green and red indicators shimmering through a heavy fisheye lens effect
Computer broker screen displaying a green rising graph animation or trading chart visualizing constantly increasing ETF or Exchange Traded Fund prices such as the MSCI World DAX Dow Jones or S&P 500
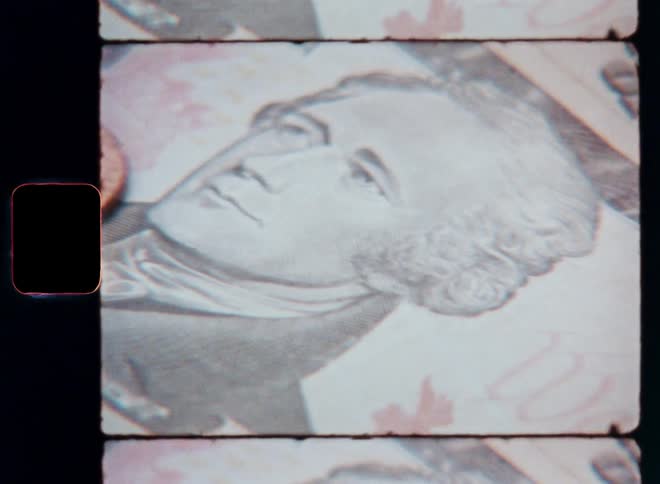
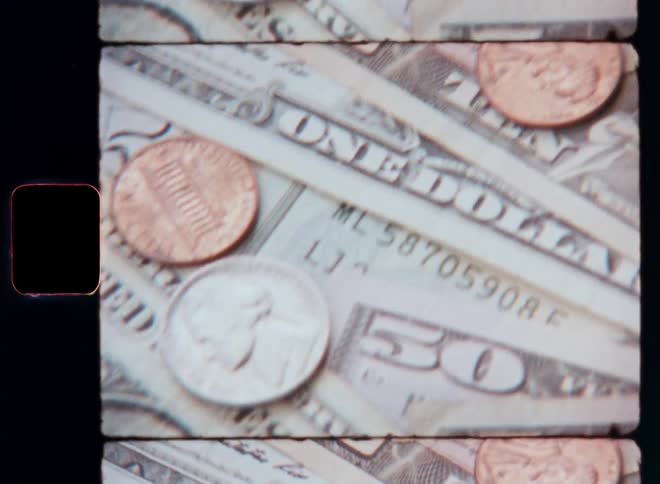
Closeup of a penny and paper money including a ten dollar bill
The candlestick trading chart or graph steadily rises with a positive upward tendency and trend showing the price development of the MSCI World or S&P 500 or another ETF as a store of value and protection against inflation
Dolly Out Shot of a Blue AI Neural Network - Abstract Data Flow - Machine learning - Nodes and Lines
An extreme close-up shows a bank transaction notification for a payment received on a smartphone screen
A close up of red and green lines on a graph
A finger scrolls a touch screen
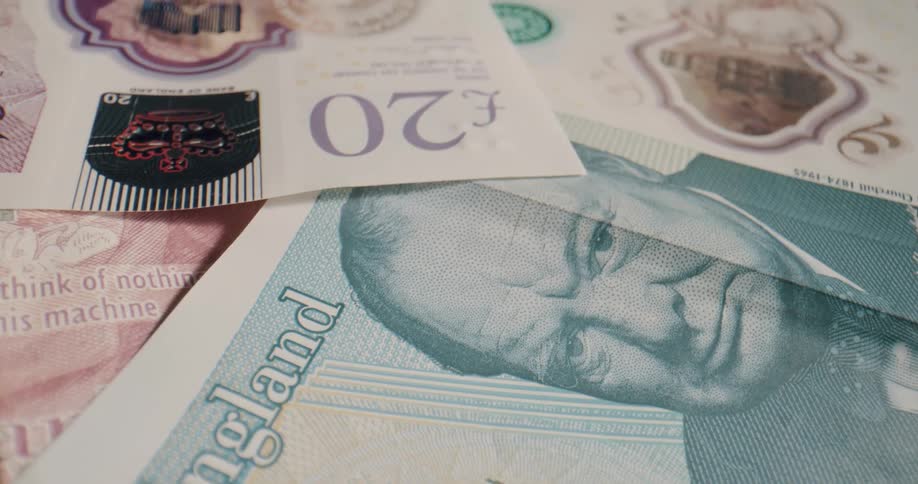
English money sits spread out on a table
A ceramic white piggy bank is dropped from above onto a dark surface shattering immediately upon impactcoins of various denominations scatter outwards in slow motion as the pieces of the broken piggy bank fly apart against a completely black backgroun
Coins being tossed up and falling down with a black background
Persons finger presses down on a cyber screen as glowing patterns spread and vanish
A bullish bull flag chart pattern is displayed on a dark monitor as the red and green candlestick candles form sideways consolidation before breaking resistance for a massive move to the upside with positive price development and profit in a bull run
A finger presses a glowing blue button embedded in a futuristic circuit board interface
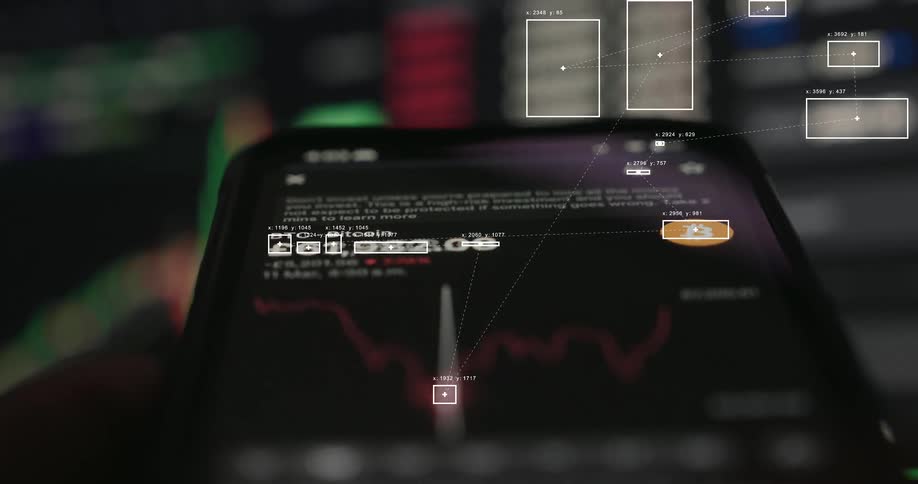
Futuristic data analysis graphics track the volatile price of Bitcoin on a cryptocurrency trading app displayed on a smartphone screen
Charts are flashing on the computer screen
Benjamin franklin on united states one hundred dollar bill
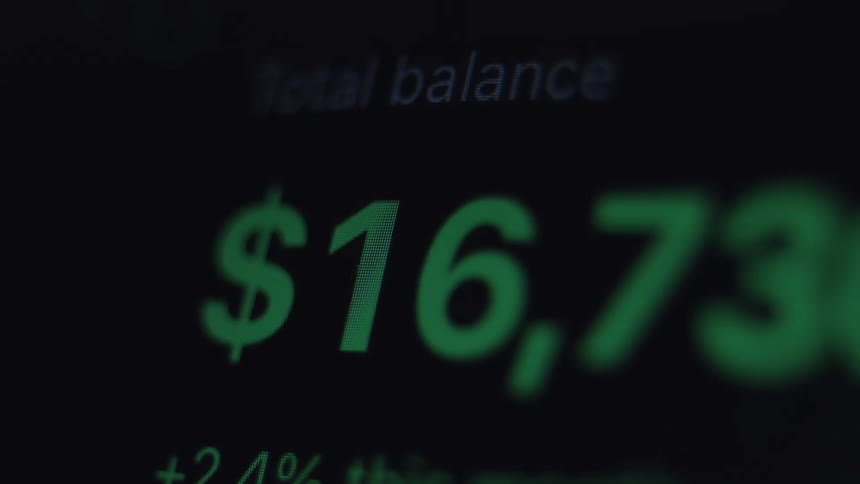
A financial investment account balance rapidly increasing on a dark digital display
Orange Bitcoin logo or symbol animation fading in and out on a black background created by matrix style animation consisting of digits or numbers 1 or one and 0 or zero on a pixelated computer screen
A glowing digital grid with bright nodes is connected by blue lines
A digital display shows multiple lines of data graphing price fluctuations over time
A stock market candlestick chart with technical indicators is displayed on a screen
Several bills on various denominations are scattered on each other
Coins are laying on the cash
Handheld macro close-up of bullish financial market chart or candlestick trading graph on black screen displaying the UI of stock or crypto broker application or platform as the price surges and the value of the asset increases during investment bull run
A line graph is on the computer monitor
Tall buildings stand out against lit sky with structure under construction on the left
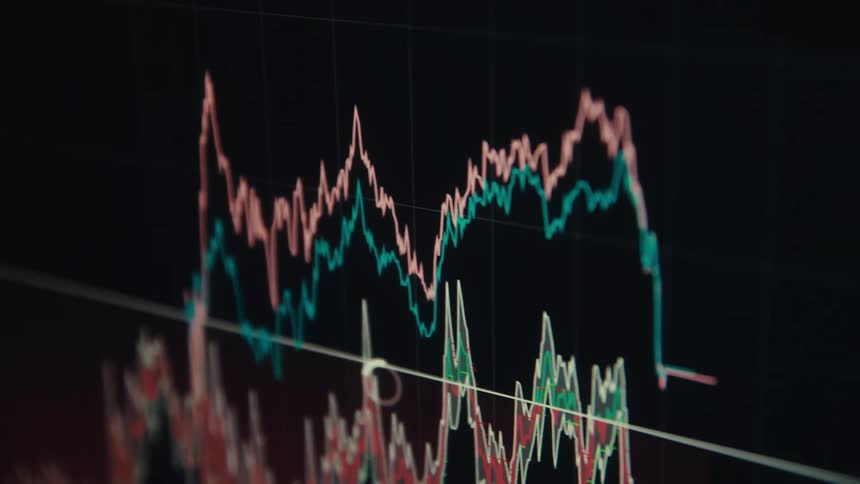
Price variation chart with a red line followed by a green line over time
Close up of a device screen displaying a trading interface in green over a dark background

Need help finding the
right footage?

Have it delivered to your account within 1 business day.

This is Filmsupply

Our StoryOur FilmmakersArticlesFilmsPopular SearchesAll Categories

FM

A family of brands dedicated to empowering the creative.

FILMSUPPLY

Footage licensing for productions

MUSICBED

Music licensing for filmmakers

STILLS

Image licensing for creatives

© 2026 FM LLC.

Privacy PolicyLicense TermsTerms & ConditionsCareers