Musicbed
Filmsupply
Stills
Contact Us(800) 805-6802
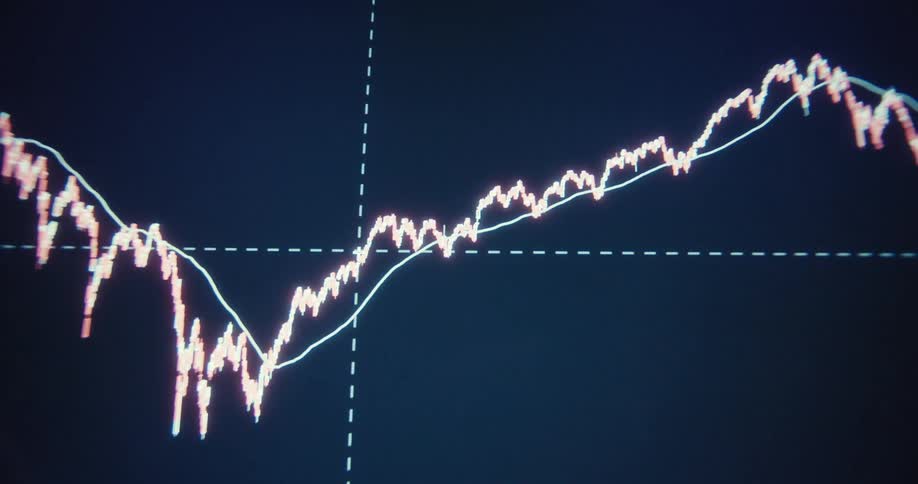
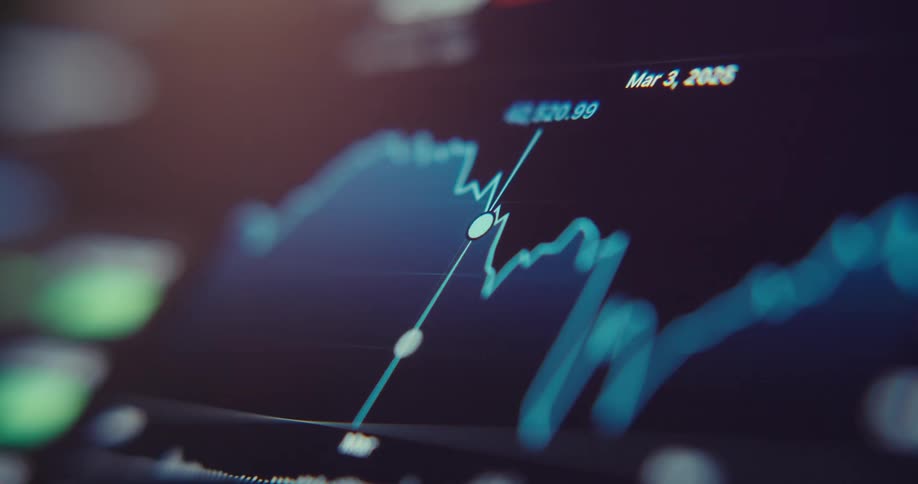
A display showing charts of a stock price
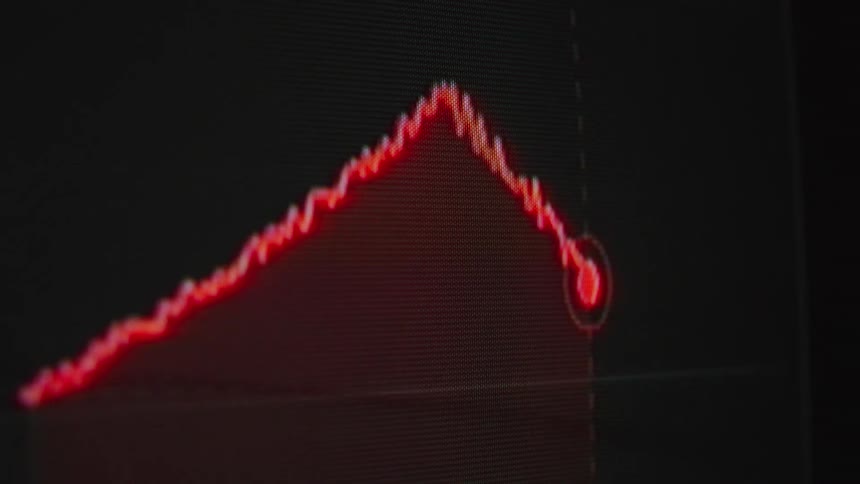
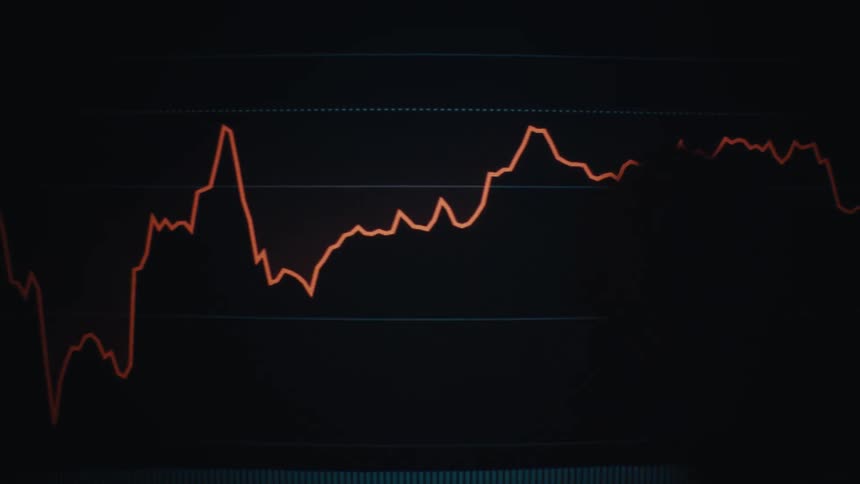
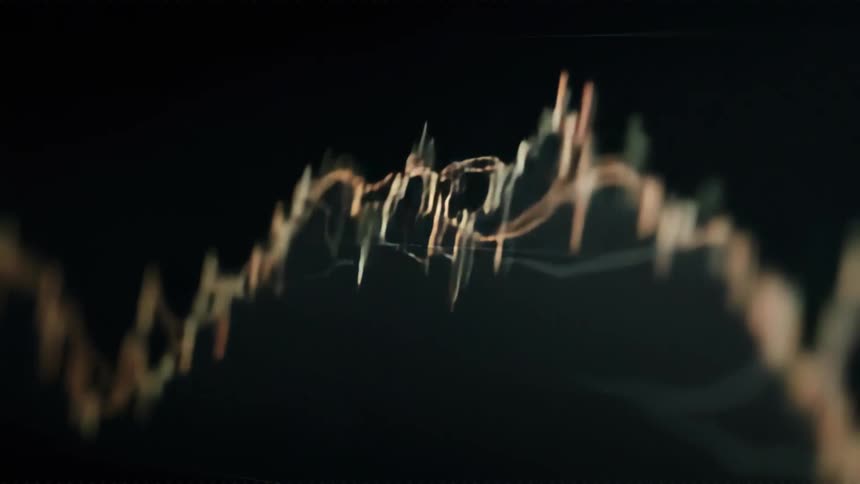
A close up view of a computer screen displays fluctuating orange and red line graphs against a dark background
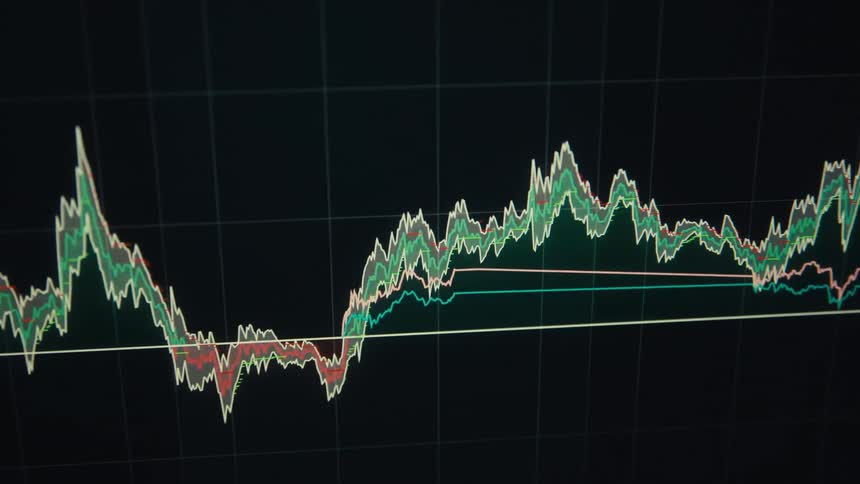
A financial trading graph with colorful lines displaying market trends
A computer monitor displays a candlestick chart of a stock price with the graph actively scrolling to the right
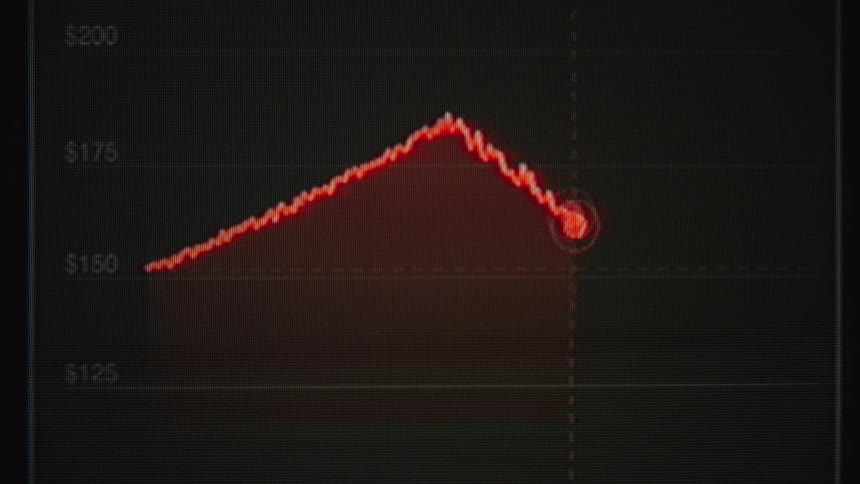
A close-up of a digital stock market chart shows a line graph rising in blue before turning red and crashing downwards
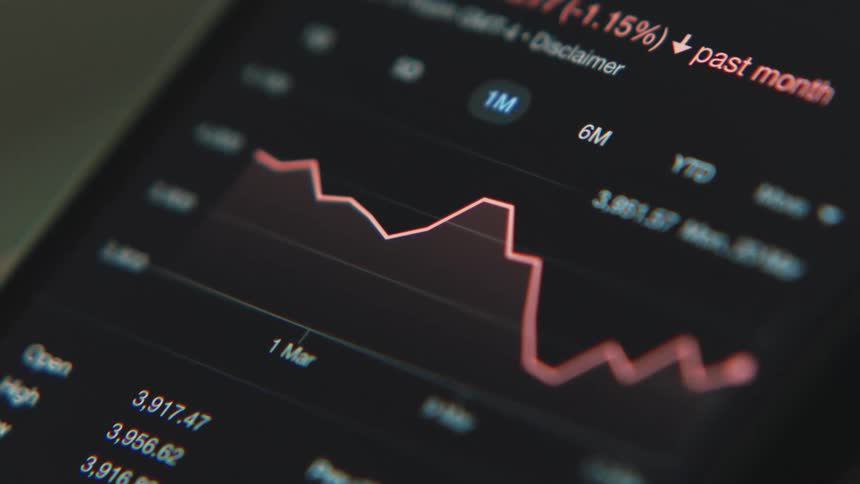
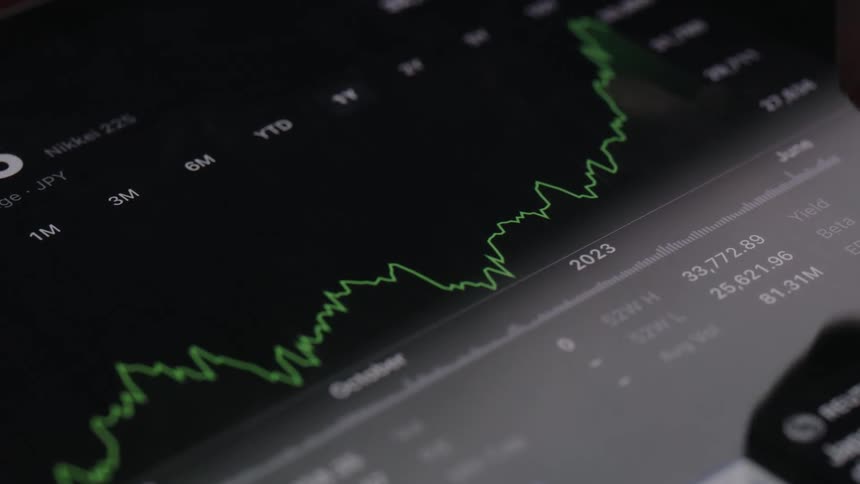
Graph of the value of a currency
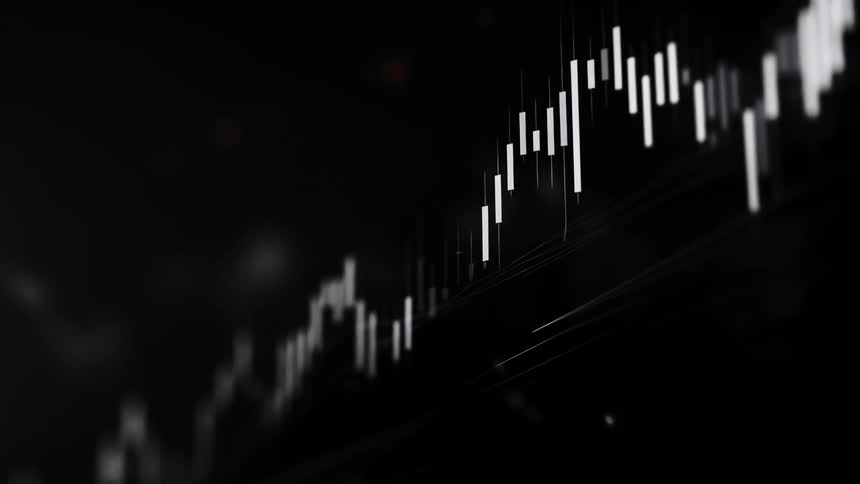
Blurry close-up of a digital screen displaying a live stock market candlestick chart with fluctuating prices
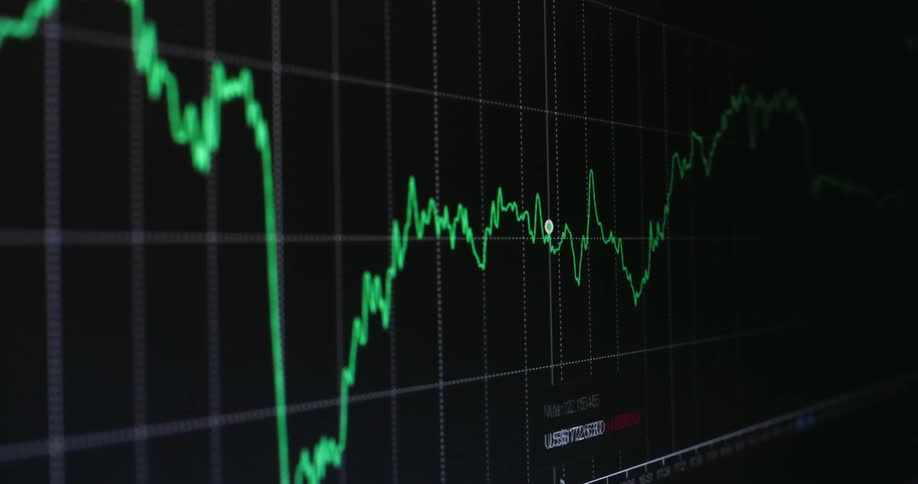
The neon green graph forms an old 90s computer screen showing a vintage user interface of a stock trading platform or exchange as the commodity and equity prices crash and a global recession hits the finance markets
Price variation chart with green and red lines showing financial values
A stock price chart is displayed on a computer screen
A blurred, close-up, and stylized animation of a digital stock market chart with glowing lines and fluctuating data
Digital display shows graph and data points
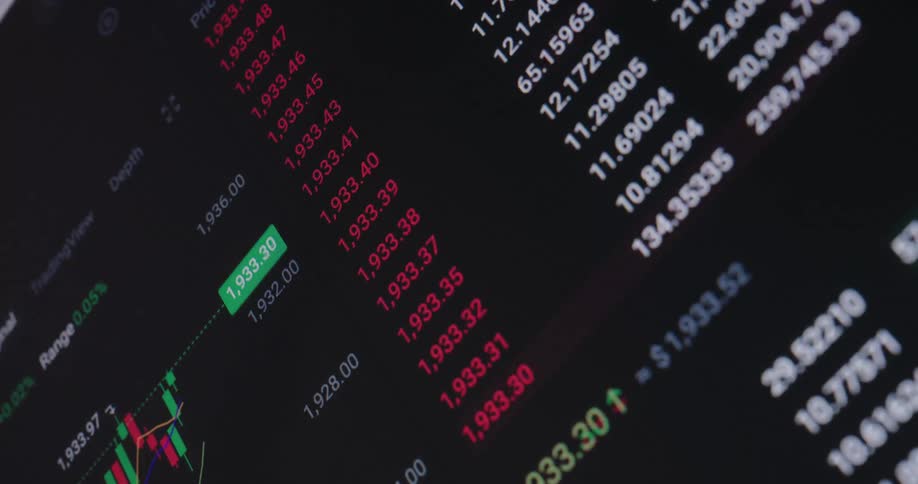
A close up of numbers and charts on a screen
A candlestick chart showing a stock price rising with green candles indicating upward movement while the Dow Jones or MSCI World ETF increases in value and price symbolizing a strong US economy and healthy global financial markets
Bullish financial market candle chart
An animated candlestick chart on a digital screen displays fluctuating stock market or cryptocurrency data and analytics
A candle diagram graph plots an array of data on a pixel screen with numbers representing rising and falling real estate prices or changes in the stock market or crypto currency finance sector
Digital black and white screen shows an animated graph with a rising line chart and vertical bars growing upward to indicate business development or financial investment success during a cooperate presentation with holographic overlay
Price chart of a stock displayed on a screen
A computer screen displays fluctuating stock market charts and trading data
A blurry, abstract close-up of a green stock market chart on a digital screen, with graphs and data showing upward trends and growth
Closeup of a digital trading graph with fluctuating lines and bars on a screen
Colorful candlestick chart against a background
Glowing green and red digital line graphs display financial data on a dark background
A closeup digital screen displays a fluctuating stock or financial chart
A footage of a digital trading screen
Close up view of a person looking at their phone
A macro close-up of a digital screen shows an animated financial chart with a positive upward trend
A vintage-style animation of a red bar graph on a black screen shows a positive upward trend
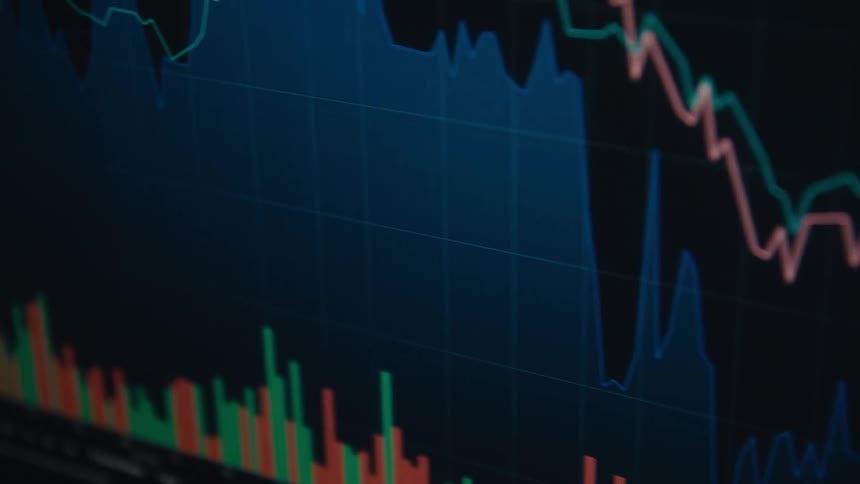
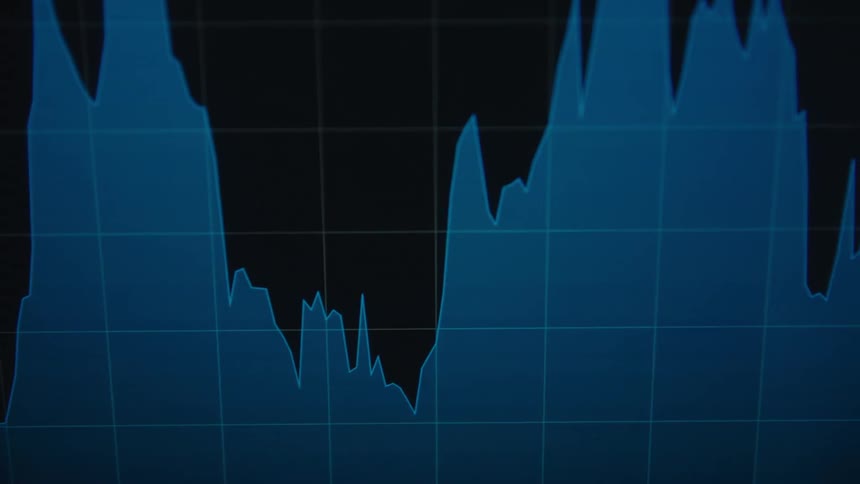
Blue colors the area under the line in a graph contrasting with the black background on a computer screen
An abstract, glowing line graph fluctuates over a blurred candlestick chart, visualizing the volatility of the financial stock market
Financial market candlestick chart against a dark background
Closeup of a graph of financial data that occasionally shows spots of light
Close up of an electronic screen displaying a trading interface in white and black
A financial graph on a screen shows a rising stock price that peaks and then suddenly crashes
Graph of the price of a currency
A screen shows a financial chart with lines and bars moving up and down
An animated green bar chart on a digital screen illustrates exponential growth with a rising arrow
A line graph shows fluctuating stock data shifting into a rising trend against a dark background
A monitor displays a stock market candlestick chart with green and red candles moving across a dark grid
Soft focus close up of a digital stock market candlestick chart displaying volatile price movements
Finger pointing at a market line chart displayed on a digital screen
Closeup of a computer screen displaying realtime stock market charts and financial data
Informational graphs cover the computer screen
The financial markets get hit by a black swan event causing a massive crash or recession leading to a global economic crisis and great depression symbolized by a trading chart or graph that sharply falls into the red digits with dramatic downward movement
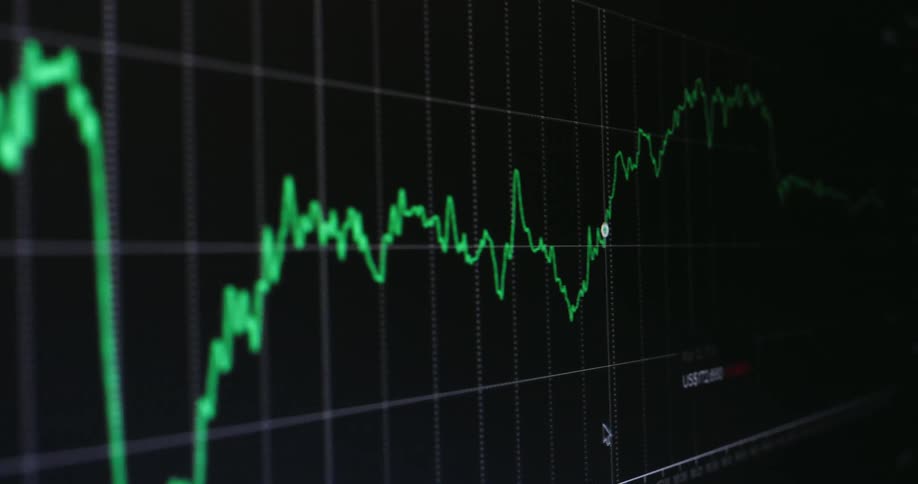
A high-tech digital animation shows a fluctuating green line graph on a stock market or cryptocurrency exchange chart with data analysis overlays
Stylized, soft-focus animation of a stock market or cryptocurrency trading chart with fluctuating data and glowing lines
An animated bar graph on a digital screen shows a steady upward trend and exponential growth
A shot shows a graph on a screen with data lines moving up and down
A closeup shot of a screen displaying fluctuating stock market graphs and numerical data
A green graph on a monitor
Closeup of a screen displaying a stock market chart
Financial market candlestick chart displayed against a blurred background of buildings
Futuristic macro close up of a retro digital CTR screen playing animated graph with a rising line chart and upward pointing arrow overlaying moving black bars representing stock market or business growth with financial success on white background
A close-up of a computer screen displaying a real-time candlestick chart for online stock, crypto, and forex trading
A close-up of a dynamic digital stock market chart shows the fluctuating value of an asset over time with technical data analysis
A blurry, close-up view of a digital stock market chart with fluctuating line and candlestick graphs on a screen
An animated bar graph shows exponential growth with an upward trending arrow
Wide angle shot of a pc screen that displays a red chart with an arrow rising from left to right while prices increase and the inflation rate keeps going up while the economy is fearing a recession as the fiat money system collapses
Closeup of a computer screen showing live stock market data and charts
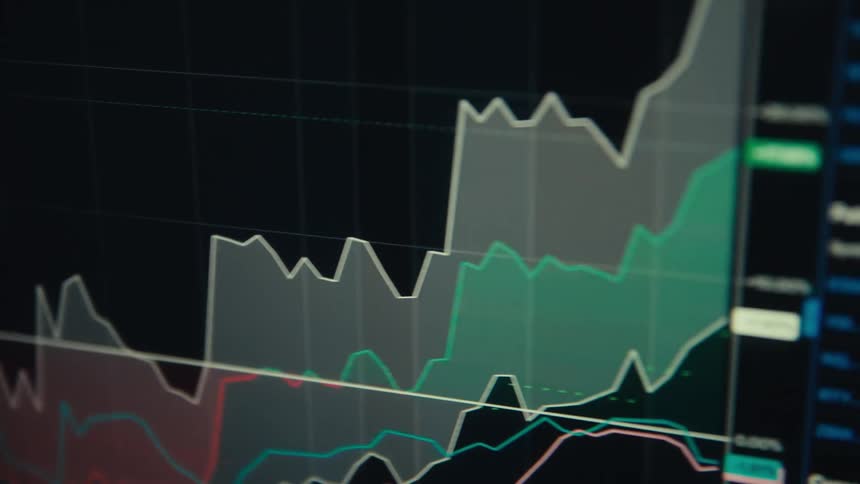
Financial charts with colored bars and lines displayed on a digital screen
Close up of device screen displaying a trading interface with candlesticks and indicators over a dark background
Bar on a graphof financial data grows and shrinks

Need help finding the
right footage?

Have it delivered to your account within 1 business day.

This is Filmsupply

Our StoryOur FilmmakersArticlesFilmsPopular SearchesAll Categories

FM

A family of brands dedicated to empowering the creative.

FILMSUPPLY

Footage licensing for productions

MUSICBED

Music licensing for filmmakers

STILLS

Image licensing for creatives

© 2026 FM LLC.

Privacy PolicyLicense TermsTerms & ConditionsCareers