Musicbed
Filmsupply
Stills
Contact Us(800) 805-6802
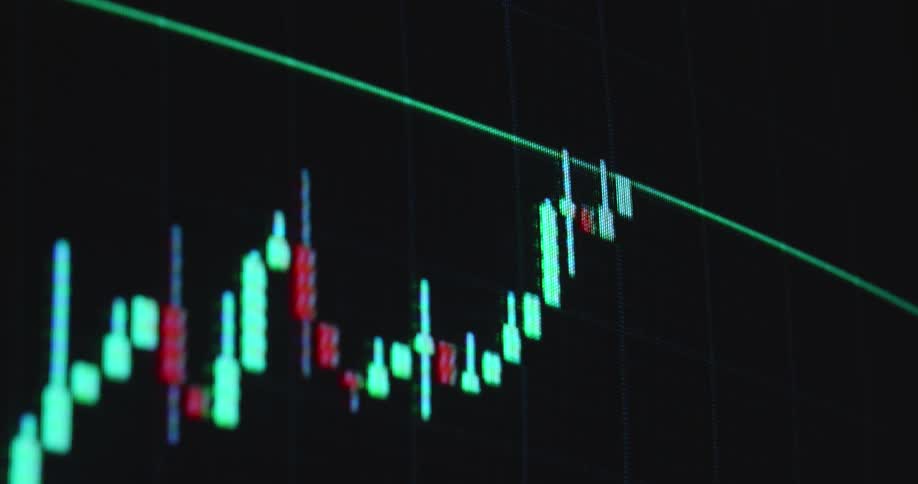
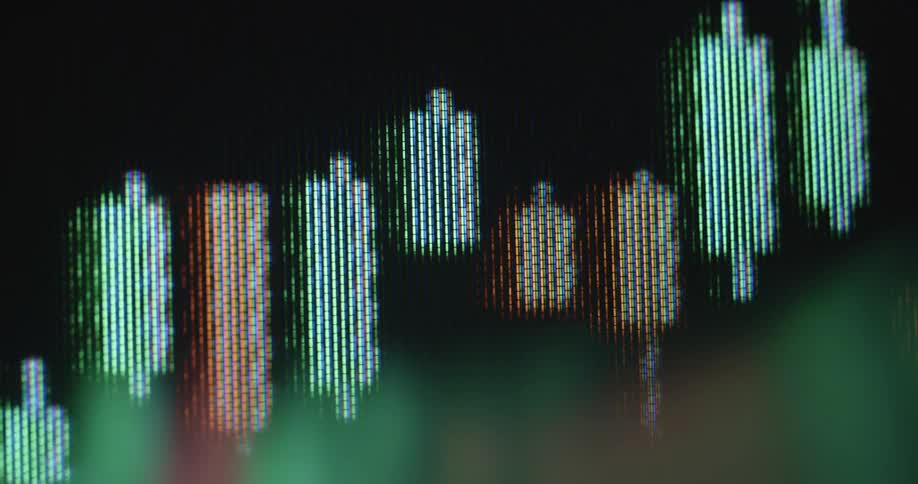
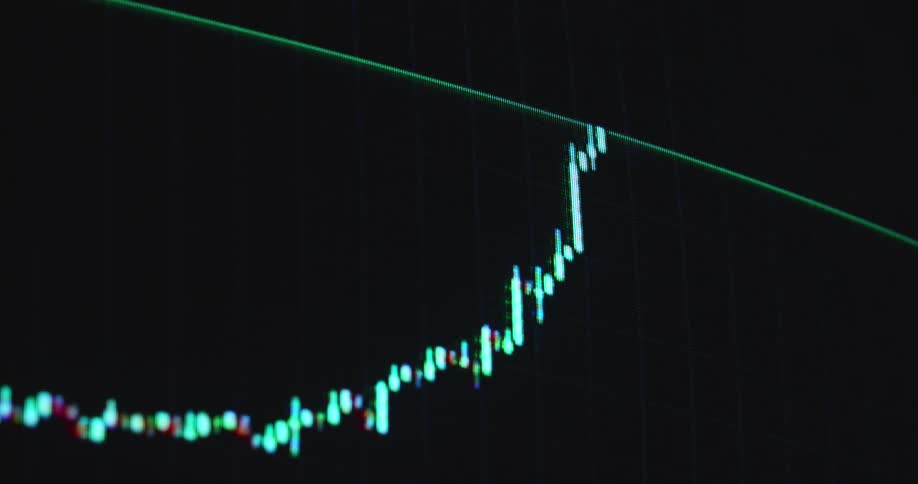
Red and neon green glowing candles create a bullish candlestick chart pattern with upward movement and positive price development as symbol for a healthy commodity or equity market or profitable stock or crypto trades via online broker app
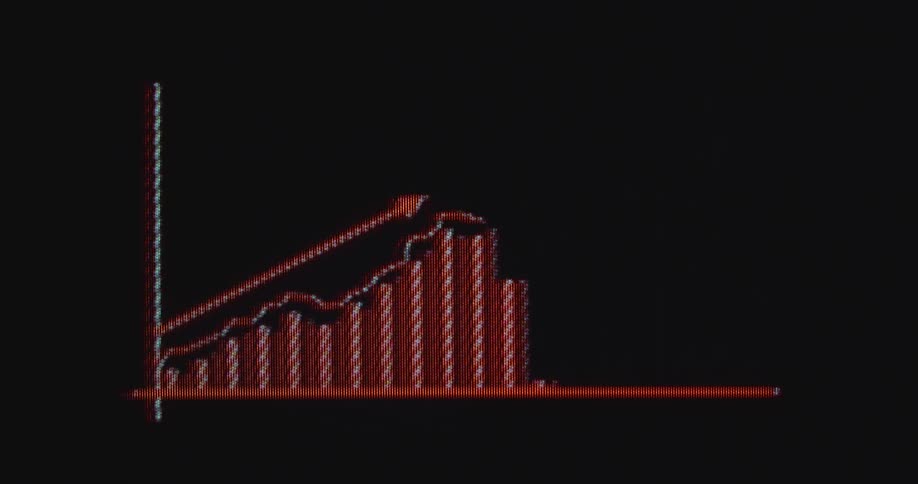
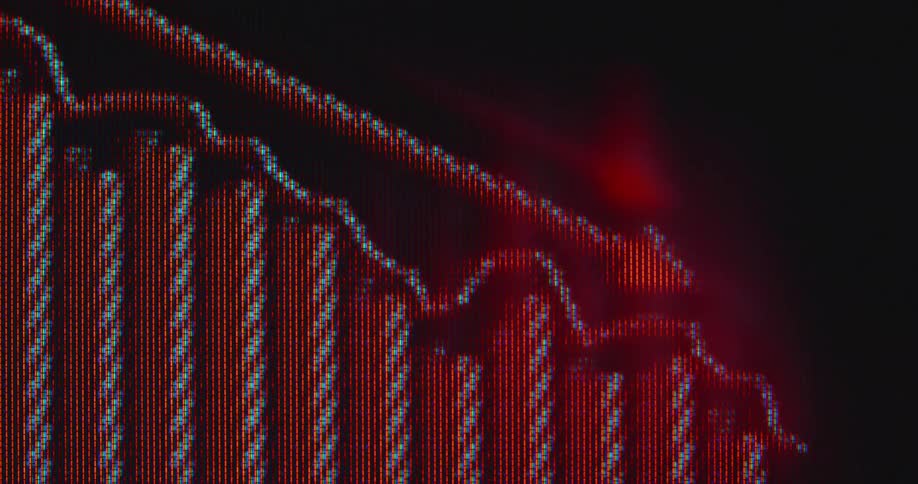
Inflation causing the costs of everyday goods to go up causing increased expenses and a rising consumer price index or CPI displayed by a digital graph in a negative red color on a pixelated computer screen
An abstract and distorted close-up of a rising green stock market chart on a digital screen
Screen displays the values and the relevant plot of changing stock data
A person is taking notes from a budget on the computer
A woman looking at a computer screen
Water droplets cover a pile of gold coins on a table
A pile of british banknotes lying on a surface
A close up of numbers and charts on a screen
A close-up, out-of-focus shot of a blue digital line graph fluctuating on a dark screen, representing stock market data or financial trends
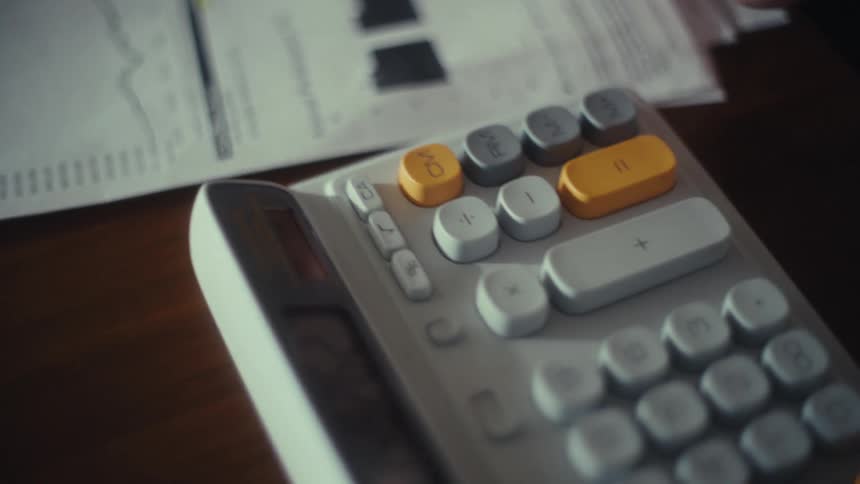
A persons hands highlight a chart on a document and then press buttons on a calculator sitting on a table next to the papers
The artwork on the display is different charts flying by
Coins being tossed up and falling down with a white background
A stack of golden colored coins have the bitcoin cryptocurrency logo on them
A business analyst slowly reviews portfolio growth charts and performance data on paper documents
Multiple rows of graphs and numbers quickly scroll by on a screen
The candlestick trading chart or graph steadily rises with a positive upward tendency and trend showing the price development of the MSCI World or S&P 500 or another ETF as a store of value and protection against inflation
A person texts on their phone
Letters glow on a small keyboard as someone types on an electronic device
The tablet display is full of numbers
The numbers scroll very fast on the monitor
A blurry stock line graph slopes downward against a blue background
A close-up of a business analytics chart loading on a digital screen, focusing on 'Services' and 'Subscriptions'
Black and white animation of bar chart of stock prices or business development features an upward arrow moving from left to right with a positive trend line and a rising value as part of financial data statistic during cooperate presentation
A person uses their tablet to check stocks
Closeup of a screen displaying distorted stock market data
Close up of a person navigating a trading interface on a mobile phone application in a living room
A person is checking a graph on their phone
Screen displaying bearish financial market graph as candlestick chart crashes while stock and crypto currency markets decline and assets lose their value due to drastically decreasing and falling prices causing panic sales and recession with volatility
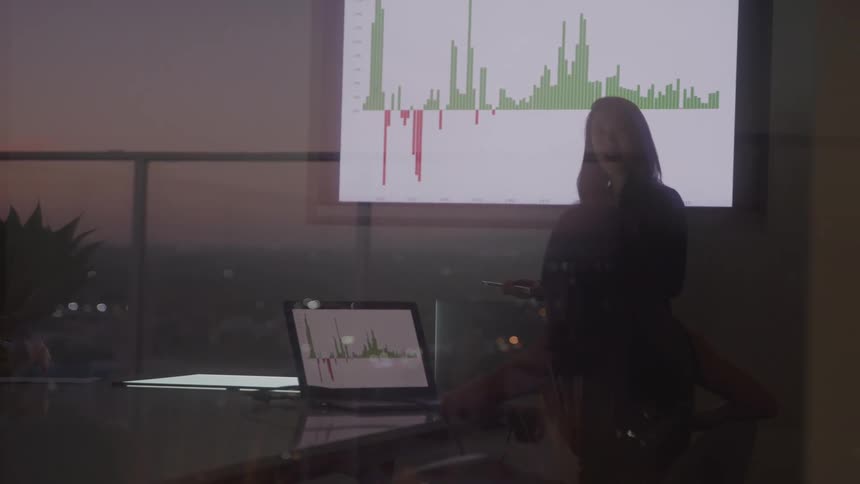
A wide shot from a distance shows a person silhouetted against the light standing in a dark office they are pointing at a graph on a large projection screen while facing a table with two laptops which are also displaying graphs
An animated blue bar graph on a black screen shows a downward trend, representing financial loss or recession
The camera captures an extreme closeup of a screen as a graph of a share index traded at Wall Street or on an online stock exchange app is plotted while going up and down or falling or rising and changing between positive green and negative red
A close-up, shallow depth of field shot of a colorful candlestick graph displaying fluctuating financial market data on a screen
A macro shot of a financial chart on a screen displaying a red 'Sharp drop' notification indicating a market crash
Financial candlestick chart on a screen indoors
Coins being thrown up in the air and falling in slow motion
A mystical nighttime timelapse of downtown Los Angeles skyscrapers poking through a thick sea of fog
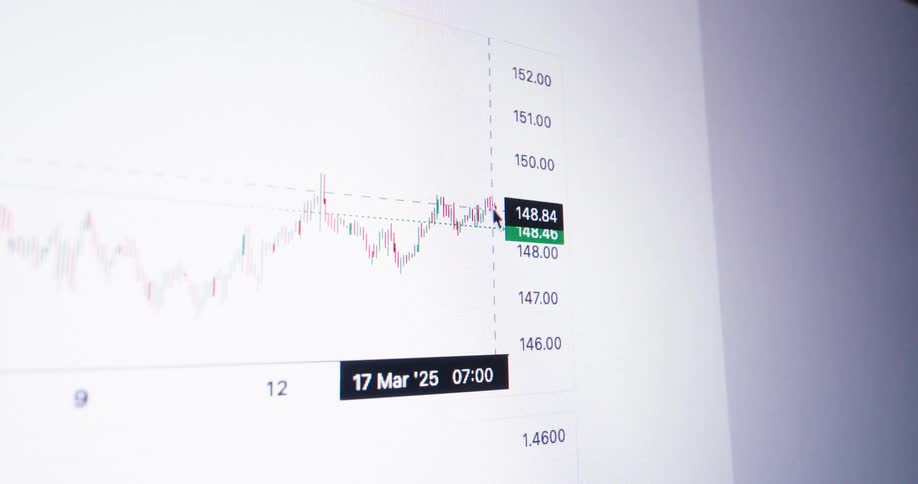
Scrolling on a chart showing the fluctuation in a stocks price
A macro view of a digital screen shows a black animated graph with a falling line chart and a downward pointing arrow overlaying vertical bar charts representing a market decline or financial loss on a white background
Stack of golden coins with the bitcoin logo printed on them
Financial candlestick chart showing strong upward movement after Bull Flag breaks resistance to the upside and bullish price action continues during massive crypto bull run and alt coin season creating generational wealth among investors and traders
A blurry, close-up view of a digital stock market chart with fluctuating line and candlestick graphs on a screen
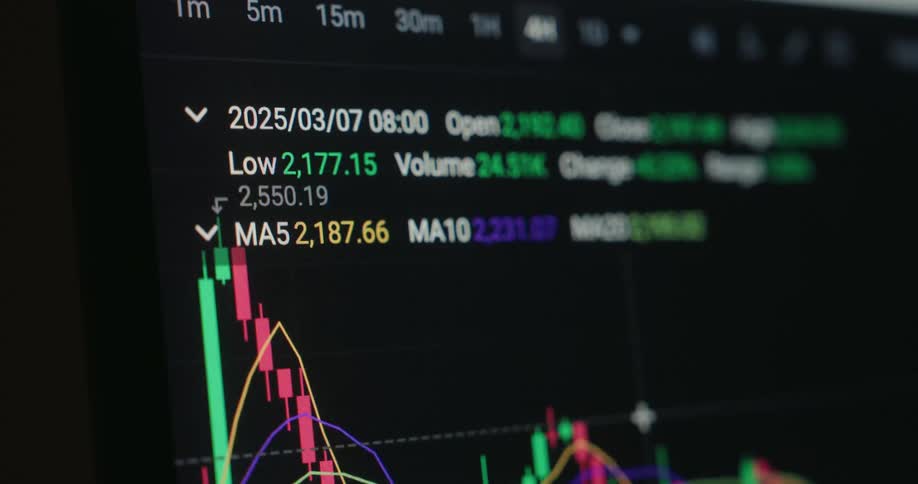
A close-up of a dynamic digital stock market chart shows the fluctuating value of an asset over time with technical data analysis
Building on a dollar bill
A magnifying glass scans down a column of decimal numbers on a spreadsheet, symbolizing data analysis and research
Abstract green and red colored candlestick chart
Close up of a candle diagram stock chart pattern on a digital RGB TV screen consisting of pixels and green and red candles as the graph rises with a positive upward tendency symbolising financial success and share trading
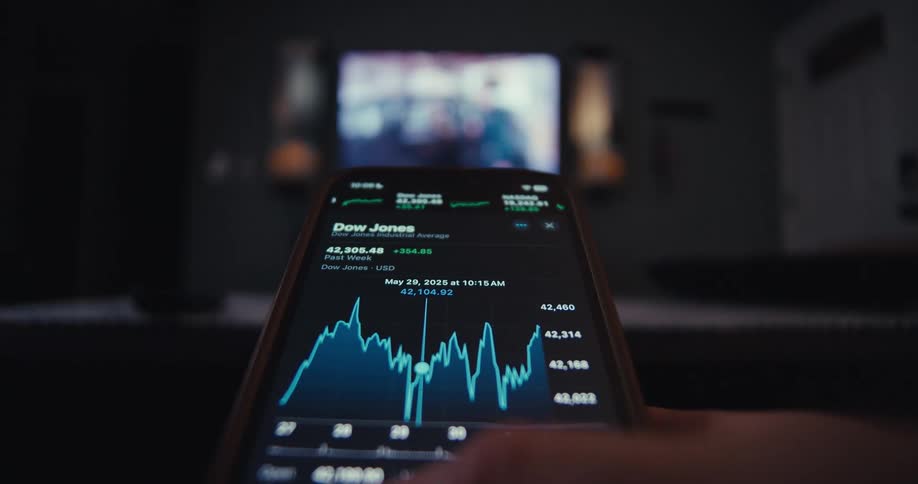
A smartphone shows a stock chart with a blurry tv in the background
Money is stacked together
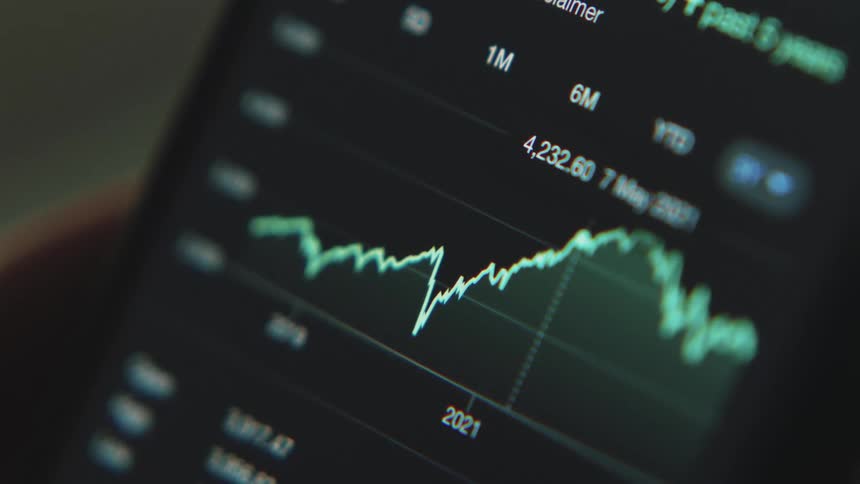
A graph speeding through the evolution in price of a stock over several years
Black dirt falls on the round coins that have an upper case b on them
A pile of coins on a reflective surface with lit up arrows
A pile of gold coins on a reflective surface
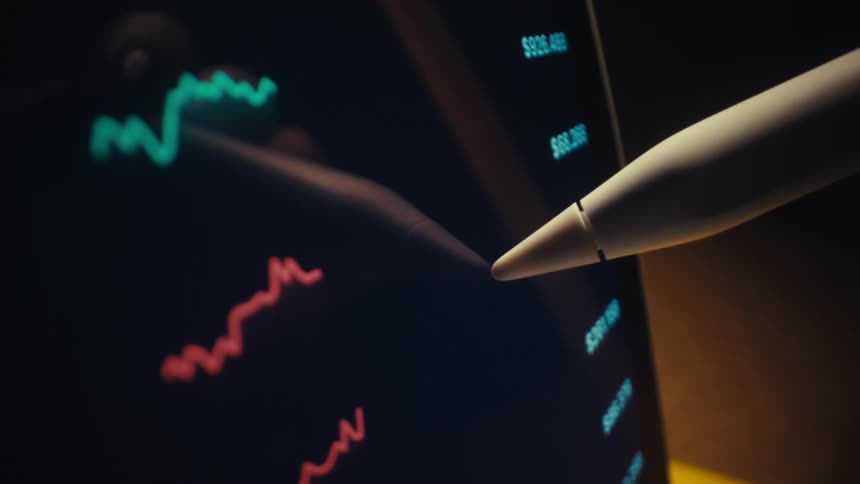
A stylus points at colorful fluctuating line graphs displayed on a digital screen suggesting data analysis or market tracking
Three variations of an animated digital bar graph show a downward trend, symbolizing financial loss or decreasing statistics
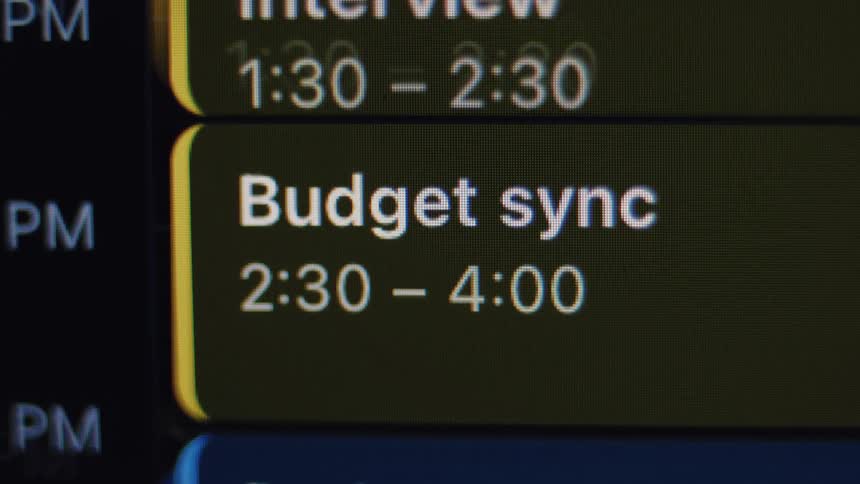
A close-up view of a digital calendar on a screen displaying a scheduled 'Budget sync' meeting
Extreme closeup of a pixelated red chart with significant downward trend highlighted by descending line and arrow as the stock market or the global economy decline and the US dollar loses value due to negative price development
A person is scrolling through information on their cell phone
Candlestick trading chart showing upward movement in the financial market as the value of the MSCI World or SP 500 ETF increases as symbol for economic growth and success with dramatic upward perspective and no camera movement
A close-up of a digital candlestick chart on a screen shows financial data fluctuating in real-time
Pixelated computer screen displays a red graph with statistical data showing the increasing inflation rate as prices for everyday goods and living costs in the US rise with a very high CPI or consumer price index causing financial problems
A close-up of a digital stock market chart on a screen shows a red notification alerting to a sharp drop in value
Sun shine turns heavy clouds obscuring downtown city skyline golden

Need help finding the
right footage?

Have it delivered to your account within 1 business day.

This is Filmsupply

Our StoryOur FilmmakersArticlesFilmsPopular SearchesAll Categories

FM

A family of brands dedicated to empowering the creative.

FILMSUPPLY

Footage licensing for productions

MUSICBED

Music licensing for filmmakers

STILLS

Image licensing for creatives

© 2026 FM LLC.

Privacy PolicyLicense TermsTerms & ConditionsCareers