Musicbed
Filmsupply
Stills
Contact Us(800) 805-6802
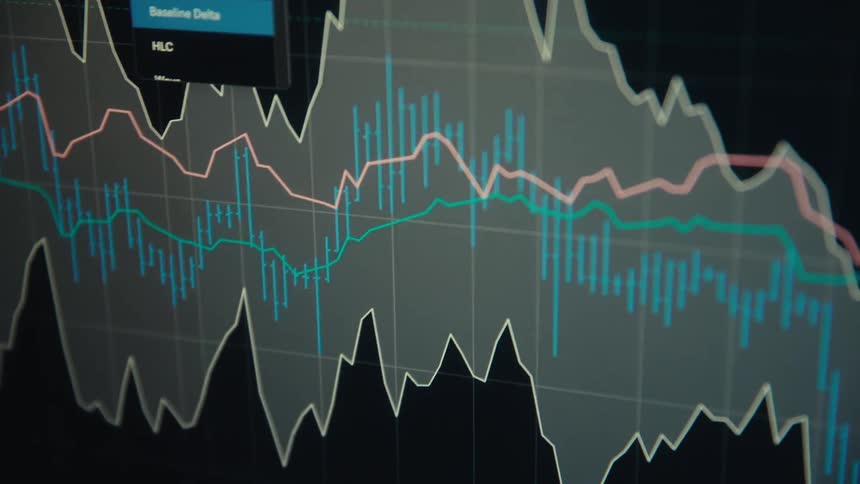
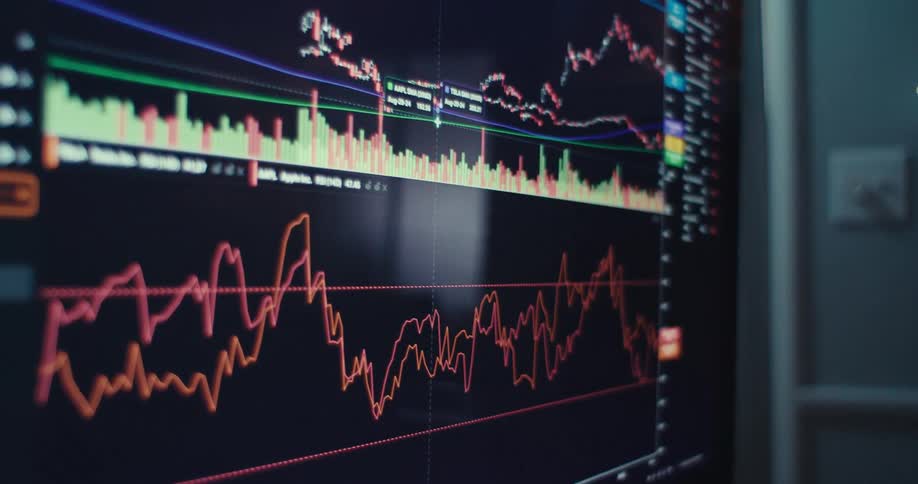
A screen shows a financial chart with multiple lines and bars that fluctuate
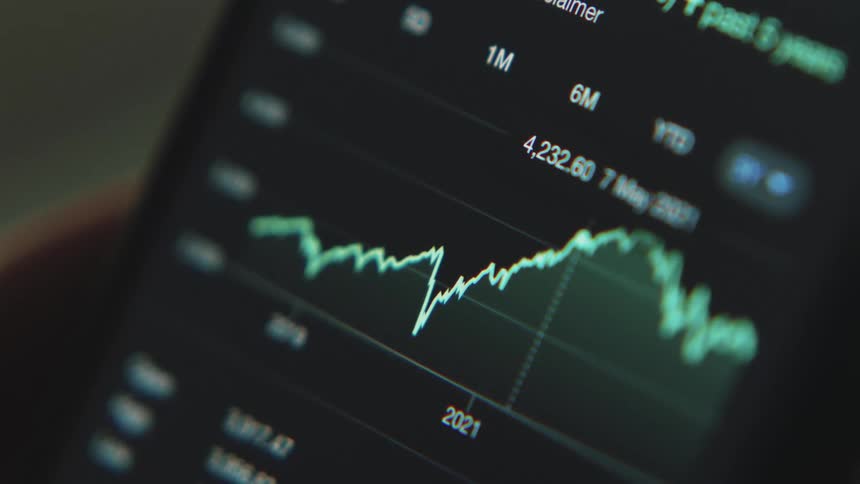
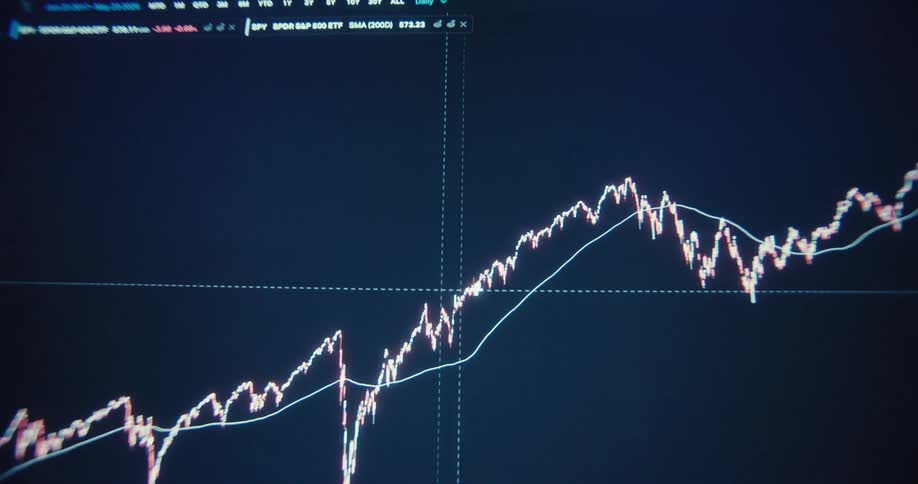
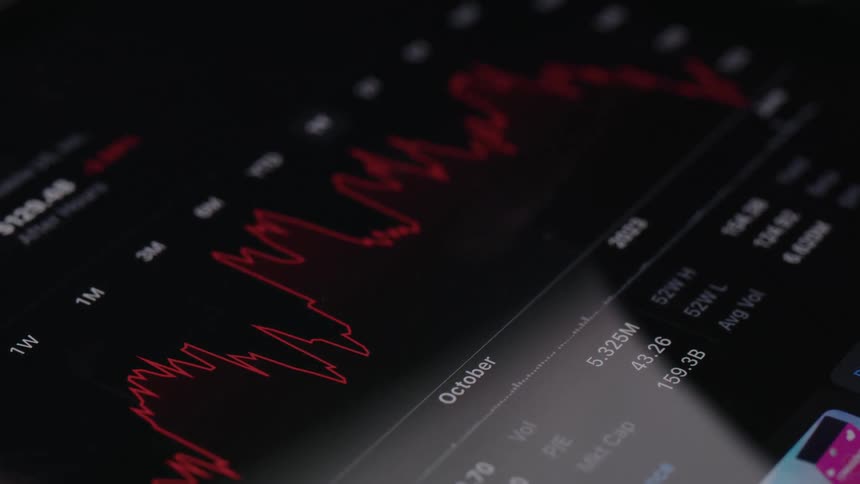
A graph speeding through the evolution in price of a stock over several years
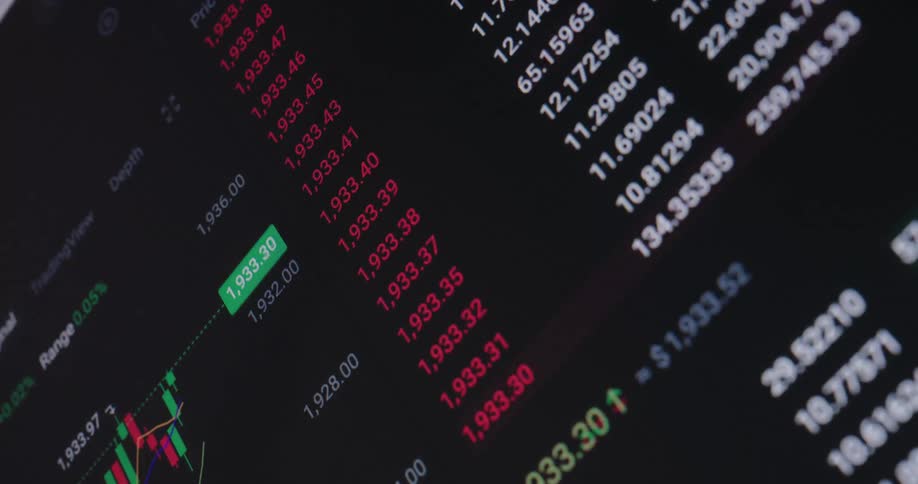
A close-up of a digital stock market chart shows fluctuating asset prices with candlestick patterns and changing numbers
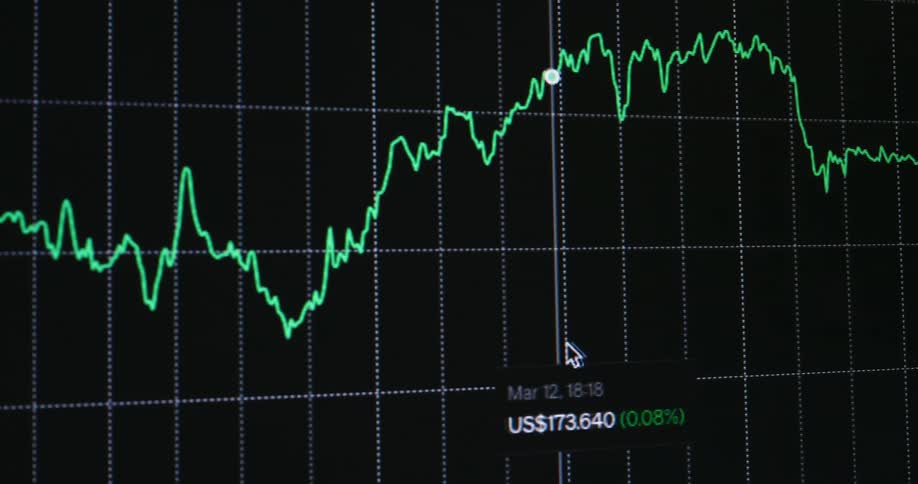
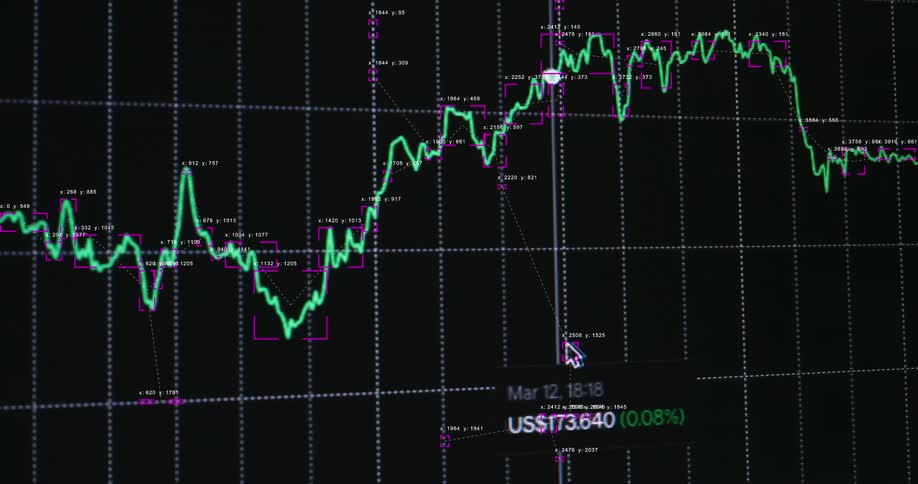
Cursor causing the screen to scroll to the right as it moves along the graph line
A close up clip of a trading chart
A blurry close-up of a green stock market chart on a digital screen showing fluctuating data and an upward trend
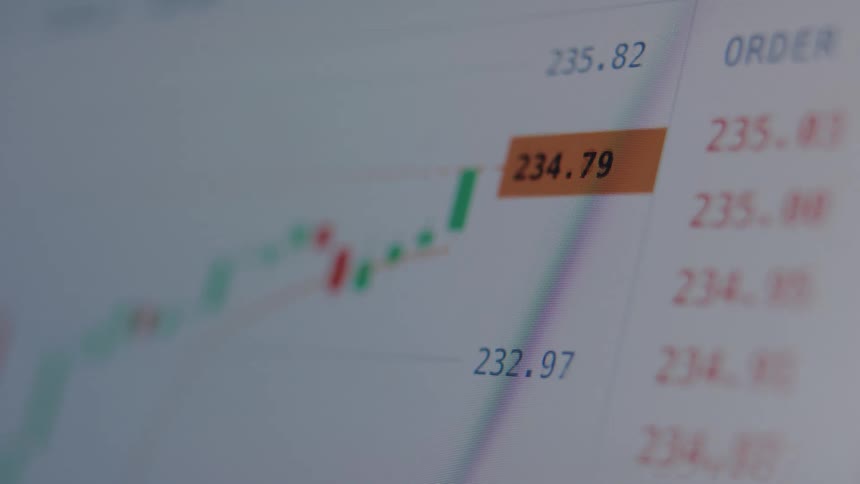
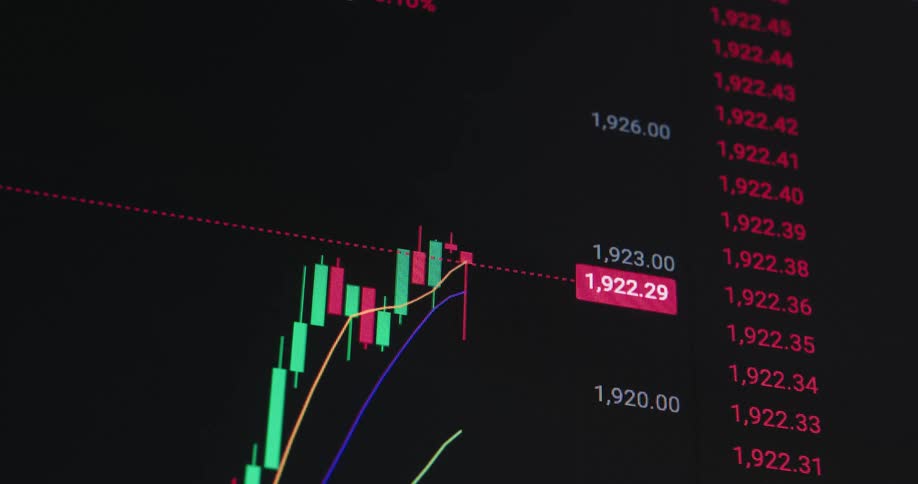
Candlestick chart of a stock market price displayed on a computer screen with green and red candles
A close up view of a computer screen displays fluctuating orange and red line graphs against a dark background
Dramatic upward perspective of Bull Flag chart pattern as the green candles break resistance to the upside and the stock or crypto currency goes on price discovery with positive upward movement and trend displayed on monitor of a professional broker
Close up of an electronic screen displaying a trading interface in white and black
Multiple lines and a candlestick chart occupy the same graph on a digital screen as a selection is made
Digital display shows graph and data points
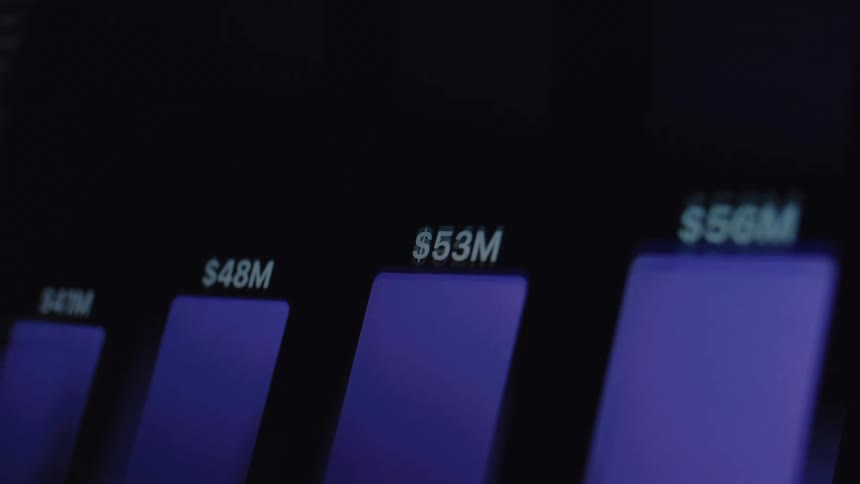
A close-up of a digital screen showing an animated financial bar graph with increasing monetary values
A close-up of a dynamic digital stock market chart shows the fluctuating value of an asset over time with technical data analysis
Computer monitors are showing graphs and data
Soft focus close up of a digital stock market candlestick chart displaying volatile price movements
Financial market candlestick chart against a dark background
Finger pointing at a market line chart displayed on a digital screen
Blue candlestick chart with bars and white trendline arrow displayed on a pixel screen with negative downward price development as symbol for unsuccessful stock trading or bad investment strategies with negative market analysis
Reflection on a screen partially obscures a candlestick chart
Blue colors the area under the line in a graph contrasting with the black background on a computer screen
A blurry, close-up view of a digital stock market chart with fluctuating line and candlestick graphs on a screen
A close-up of a digital candlestick chart on a screen shows financial data fluctuating in real-time
A high-tech digital animation shows a fluctuating green line graph on a stock market or cryptocurrency exchange chart with data analysis overlays
A computer screen displaying a stock market candlestick chart with fluctuating red and green lines indicating market trends
Close up of a monitor screen displaying an operated dark trading interface
A close-up, shallow depth of field shot of a colorful candlestick graph displaying fluctuating financial market data on a screen
A line graph shows fluctuating stock data shifting into a rising trend against a dark background
A candle diagram graph plots an array of data on a pixel screen with numbers representing rising and falling real estate prices or changes in the stock market or crypto currency finance sector
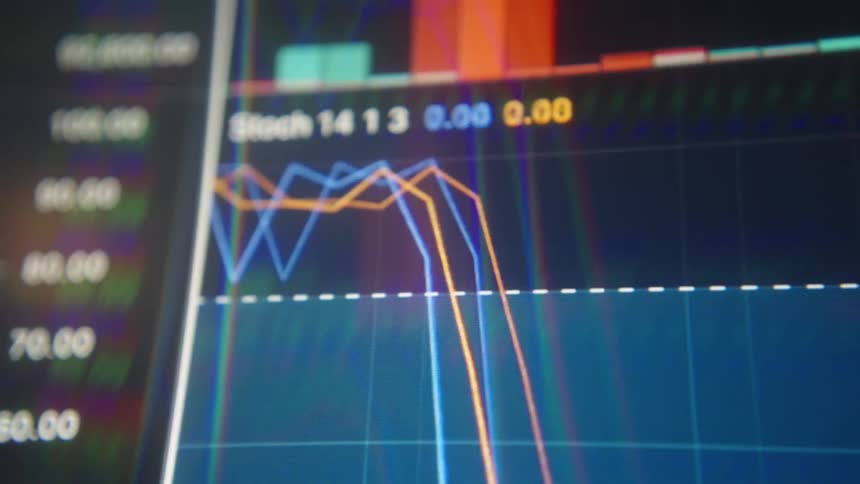
A screen with red and blue graphs
Financial chart with colored lines and areas showing market fluctuations
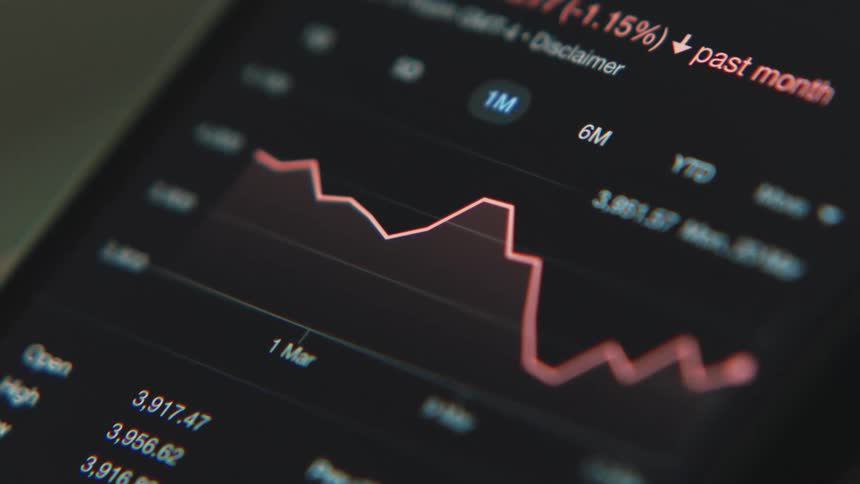
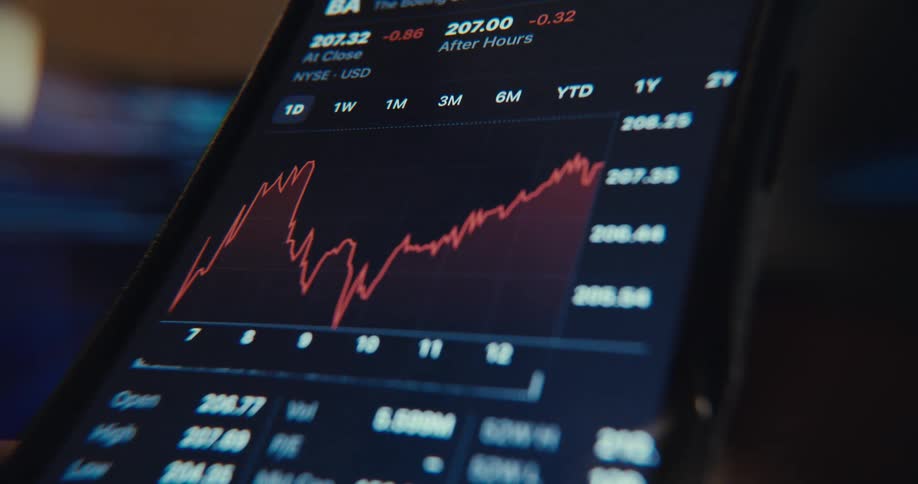
A person checks stock price history on their smartphone changing the graph time frame with their thumb
A macro shot of a digital screen displays the volatile movement of stock market prices
Graph of the value of a currency
A clip of a screen displaying a digital trading candlesticks
Person scrolls through stock information on a tablet
An abstract, out-of-focus animation of a digital stock market chart shows fluctuating data and glowing trend lines
A monitor displays a stock market candlestick chart with green and red candles moving across a dark grid
A bullish bull flag chart pattern is displayed on a dark monitor as the red and green candlestick candles form sideways consolidation before breaking resistance for a massive move to the upside with positive price development and profit in a bull run
The line graph is moving on the screen
Closeup of a screen displaying a fluctuating line graph
Series of candlestick stock prices displayed on a screen
A close-up of a digital stock market chart on a screen displaying real-time, fluctuating share prices
Charts of currencies rising and falling
Line graphs and numbers move across the monitor
Closeup of a computer screen displaying realtime stock market charts and financial data
Close-up of a real-time digital stock market candlestick chart showing a bullish upward trend on a computer screen
A display showing charts of a stock price
Dynamic dramatic macro footage with shaky movement of a stock trading chart or data graph animation moving upwards with a positive trend line indicating a stock market or crypto bull run and the increase in value of different assets
A graph of orange lines
A smartphone screen displays various stock market charts rapidly changing between green upward trend and red downward trend graphs for different companies and indices
A blurred, close-up, and stylized animation of a digital stock market chart with glowing lines and fluctuating data
A close-up of a digital stock market chart on a screen shows a red notification alerting to a sharp drop in value
A footage of a digital trading screen
A person uses their tablet to check stocks
A computer screen displays fluctuating stock market charts and trading data
A blurry, abstract close-up of a green stock market chart on a digital screen, with graphs and data showing upward trends and growth
Price variation chart with green and red lines showing financial values
Multiple data points at different values are continuously plotted next to a candle chart of a stock or crypto currency trading graph in a finance application or app on a dark pixelated computer screen
Close up of a blurry device screen displaying a trading interface in green over a dark background
Closeup of a screen displaying a stock market chart
A finger scrolling on aglowing market chart on a screenthat shows fluctuating prices with sharp dips and recoveries
Finger touches a smartphone screen displaying a line financial chart on a dark interface

Need help finding the
right footage?

Have it delivered to your account within 1 business day.

This is Filmsupply

Our StoryOur FilmmakersArticlesFilmsPopular SearchesAll Categories

FM

A family of brands dedicated to empowering the creative.

FILMSUPPLY

Footage licensing for productions

MUSICBED

Music licensing for filmmakers

STILLS

Image licensing for creatives

© 2026 FM LLC.

Privacy PolicyLicense TermsTerms & ConditionsCareers