Musicbed
Filmsupply
Stills
Contact Us(800) 805-6802
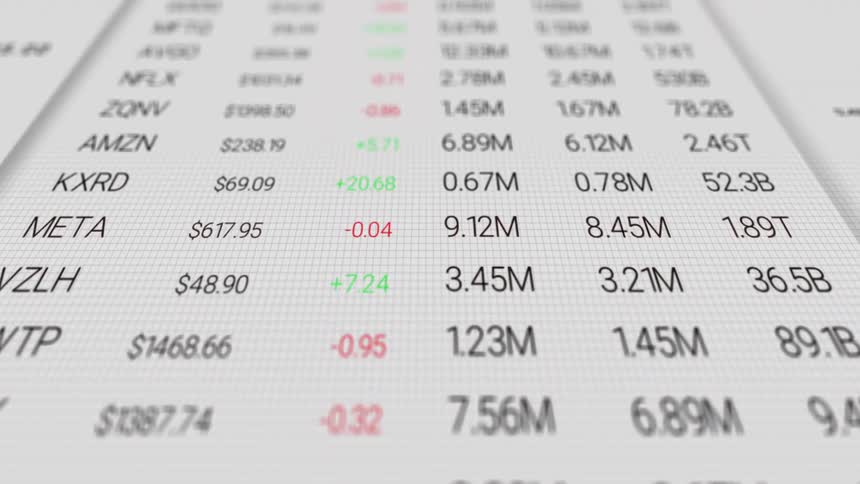
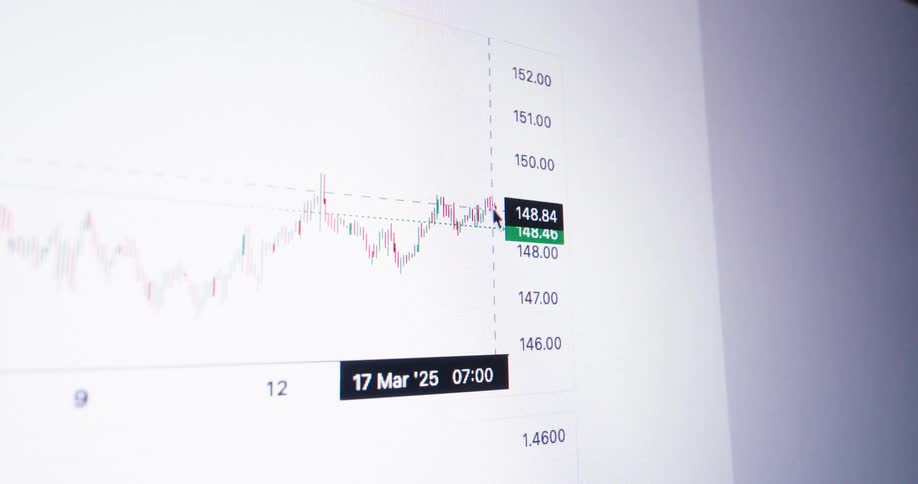
Live stock market prices for various instruments displayed on a monitor
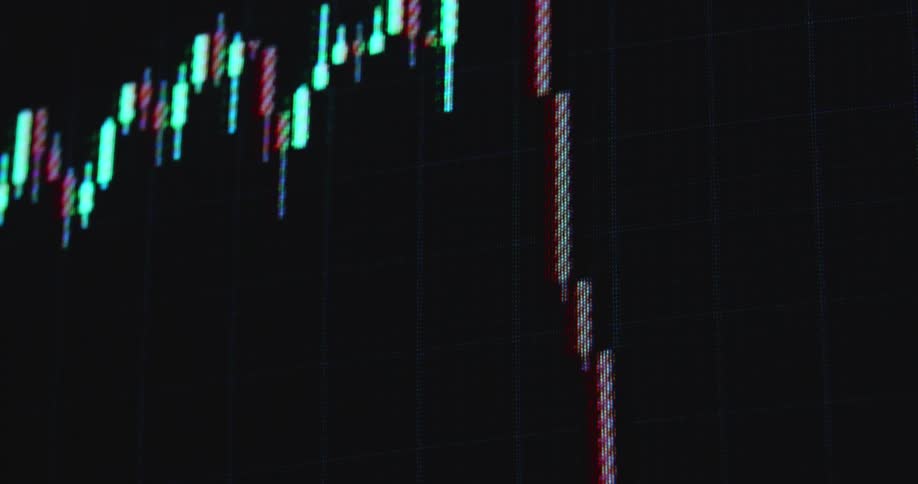
The financial markets are crashing due to a recession making stocks and shares drop and go down in price with decreasing value symbolized by a falling candlestick chart with red candles on a RGB pixel screen with black background
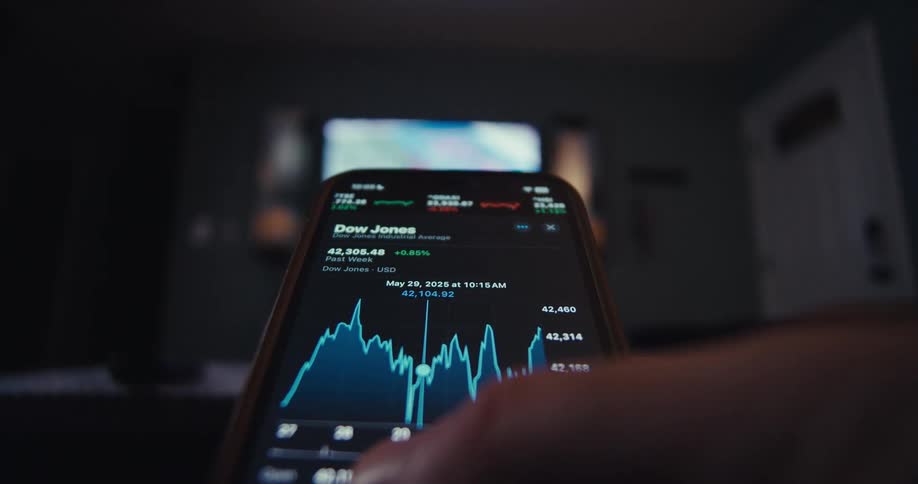
Close up of a person navigating a trading interface in a mobile phone app in the living room
An animated red bar graph with a downward pointing arrow trends down, symbolizing economic recession
The prices changes on the cryptocurrency displayed on the phone
The camera captures an extreme closeup of a screen as a graph of a share index traded at Wall Street or on an online stock exchange app is plotted while going up and down or falling or rising and changing between positive green and negative red
A volatile stock on a trading app rises dramatically until a 'Global Market Crisis' alert appears, causing the price to crash and the market to close
Pixelated candlestick chart on a screen or monitor panel forming a bullish flag pattern while the trading chart analysis shows that the graph is about to break resistance to the upside making the price of the stock or asset go up and increase in value
A military soldier in uniform and helmet standing in a forest at midday scanning the surroundings
Financial candlestick chart against a gray screen
Colorful candlestick chart against a background
A rapid scroll through various online news articles and headlines about the biotechnology industry
Digital financial data in background
A closeup shot reveals multiple stacks of one hundred dollar bills each held together by a tenthousanddollar currency band
A person uses a stylus to draw a circle around text on a touch screen tablet
Pixelated screen of a vintage 90s computer displaying a green graph with an arrow pointing upwards symbolizing the beginning of the digital financial era and the first online trading platforms for buying stocks in the internet
Screen displaying a decreasing red graph as the international stock markets and trading exchanges are crashing and prices are falling dramatically due to global recession and economic crisis causing ETFs and the gold price to decline
A blurred, close-up, and stylized animation of a digital stock market chart with glowing lines and fluctuating data
Gold coins sit in a pile of dirt
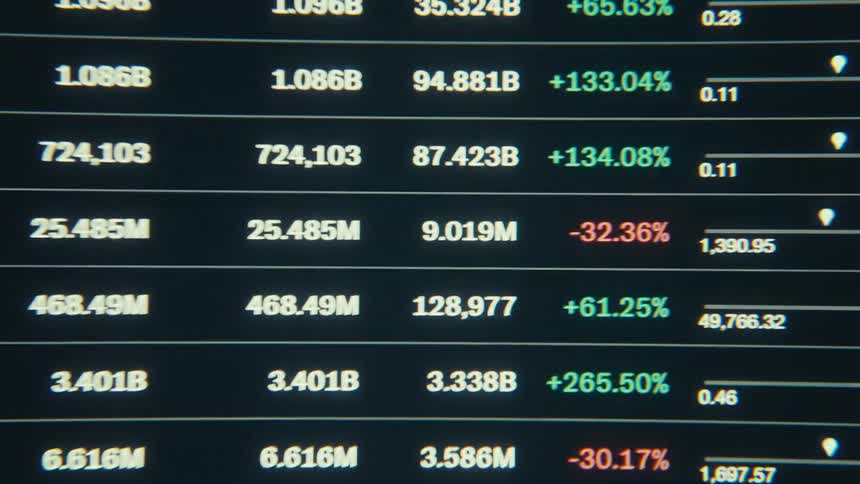
A shot shows a view of a screen with a list of companies and their financial data
Scrolling through the phone
A blurry close-up of a green stock market chart on a digital screen showing fluctuating data and an upward trend
A stack of american banknotes fall onto a black surface
The animated trading graph or candlestick chart is moving on the computer display as a recession hits the global finance markets and the prices crash as red candles symbolize the end of a market cycle and the beginning of a financial crisis or depression
A digital stock trading interface displaying microsofts stock performance with a negative change along with a watchlist containing cme futures and a stylus interacting with the screen
A blurry, abstract close-up of a green stock market chart on a digital screen, with graphs and data showing upward trends and growth
Glowing green and red digital line graphs display financial data on a dark background
A person is looking at stock information on their phone
A fastpaced sequence of glowing candlestick charts and fluctuating stock market tickers appears through glitchy transitions and bright light leaks creating a highenergy atmosphere of digital financial trading
Animated dollar sign rotates and changes color against a black background
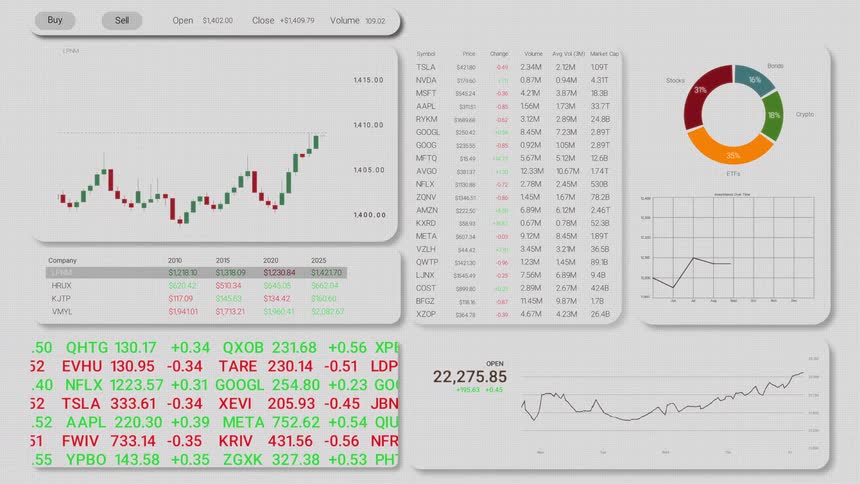
A screen shows a graph with numbers moving and a pie chart with data
A close view shows blurry digital graphs and stock market data with red and green bars moving quickly across a dark screen
Macro close up of a red arrow that moves up across a pixelated screen as a financial trading graph is building beneath it symbolizing economic growth or rising stock prices or crypto currency trading as successful investment
Macro close-up view of a digital screen shows an animated graph with a rising line chart and an upward pointing arrow overlaying vertical bar charts representing market growth or financial success on a white computer screen background
The screen has numbers and percentages displayed in a list
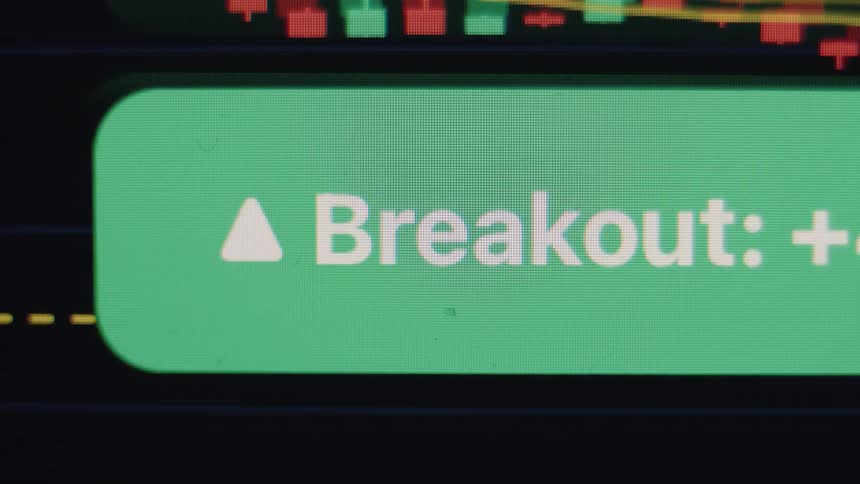
A macro close-up of a green 'Breakout' notification with an upward arrow appearing on a digital stock market or cryptocurrency trading chart
Red falling financial market chart
A close up clip of a trading chart
On a laptop a user types stocks to watch into google chrome transitioning to a search results page
A finger scrolls a glowing market chart on a screen that shows fluctuating prices with sharp dips and recoveries
Scrolling on a chart showing the fluctuation in a stocks price
A close view shows blurry digital graphs and stock market data with red and green bars moving quickly across a dark screen
The tablet display is full of numbers
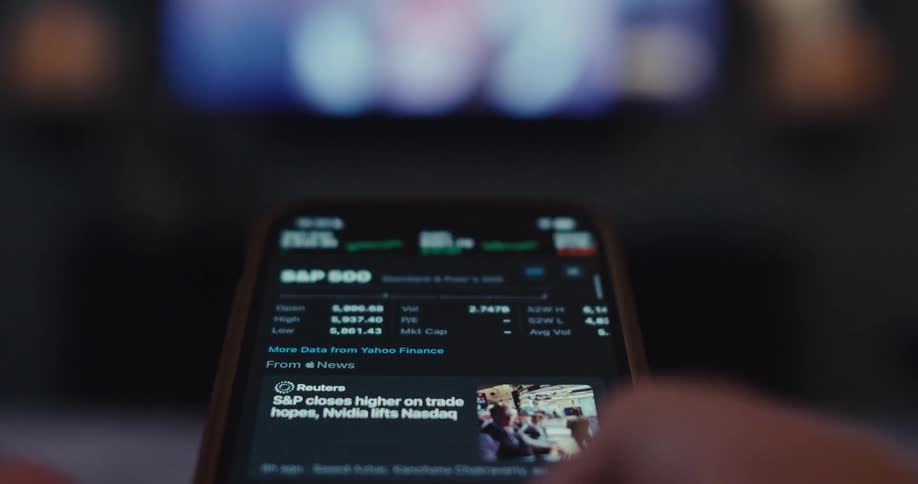
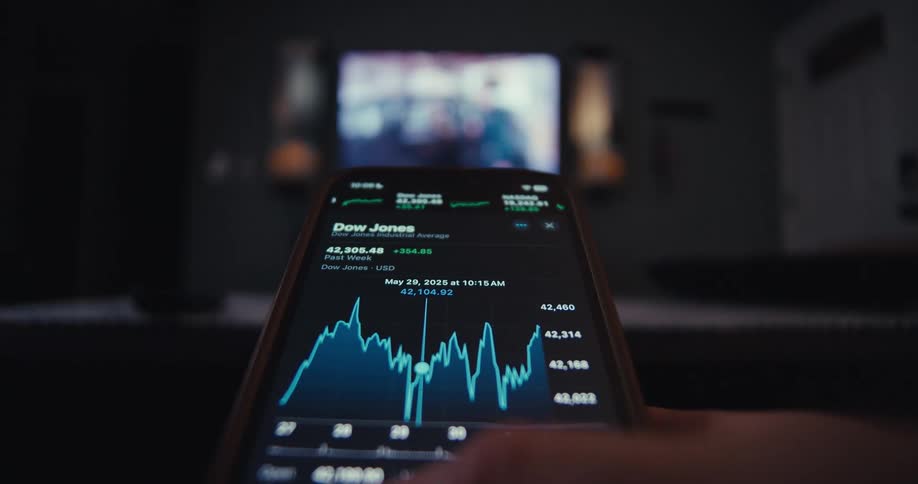
A smartphone shows a stock chart with a blurry tv in the background
An abstract, out-of-focus digital stock market ticker scrolls rapidly, showing fluctuating financial data in red and green
A computer monitor displays a candlestick chart of a stock price with the graph actively scrolling to the right
Volatile candlestick chart rises and falls to bottom of screen due to dramatic market crash or collapse causing panic and global economic recession providing great trading opportunities for day-traders that view volatility as opportunity and buy the dip
A computer screen displaying a stock market candlestick chart with fluctuating red and green lines indicating market trends
Close up of a monitor screen displaying an operated dark trading interface
Overlapping line and candlestick charts display intense financial fluctuations
Data value displayed changes while cursor moves across a data plot on a computer screen
A closeup shot shows a computer screen displaying a volatile financial graph with jagged lines fluctuating up and down in a rapid unpredictable pattern the camera pans along the digital chart showcasing the dynamic and complex movements of the data
A close-up of a dynamic digital stock market chart shows the fluctuating value of an asset over time with technical data analysis
Series of candlestick stock prices displayed on a screen
A close up shot of a dark digital screen displays a list of cryptocurrency data and financial charts with shifting green and red lines
A screen displays the cryptocurrency btc with a 691 increase
Static shot of a falling graph from an online trading application in a down trend during critical market cycle entering bear market after a crash and crisis on vintage screen with rgb pixels and glitches and retro digital look
Lines on a graph on a screen are moving
The pixelated computer screen shows the financial market reacting to a black swan event such as 9/11 causing a global economic crisis and crash followed by recession and great depression as the stock market collapses
Pixelated computer or television screen displaying an animated Euro icon in the colors of the EU or European Union as symbol for a digital EUR currency as the future of the finance system
A financial chart displaying colorful candlestick patterns indicates market trends and price movements
A macro close-up of a digital financial chart displaying the 24-hour high price for a stock or cryptocurrency
A closeup view of a stock market chart with red and green candlesticks fluctuating

Need help finding the
right footage?

Have it delivered to your account within 1 business day.

This is Filmsupply

Our StoryOur FilmmakersArticlesFilmsPopular SearchesAll Categories

FM

A family of brands dedicated to empowering the creative.

FILMSUPPLY

Footage licensing for productions

MUSICBED

Music licensing for filmmakers

STILLS

Image licensing for creatives

© 2026 FM LLC.

Privacy PolicyLicense TermsTerms & ConditionsCareers